
Key Insights
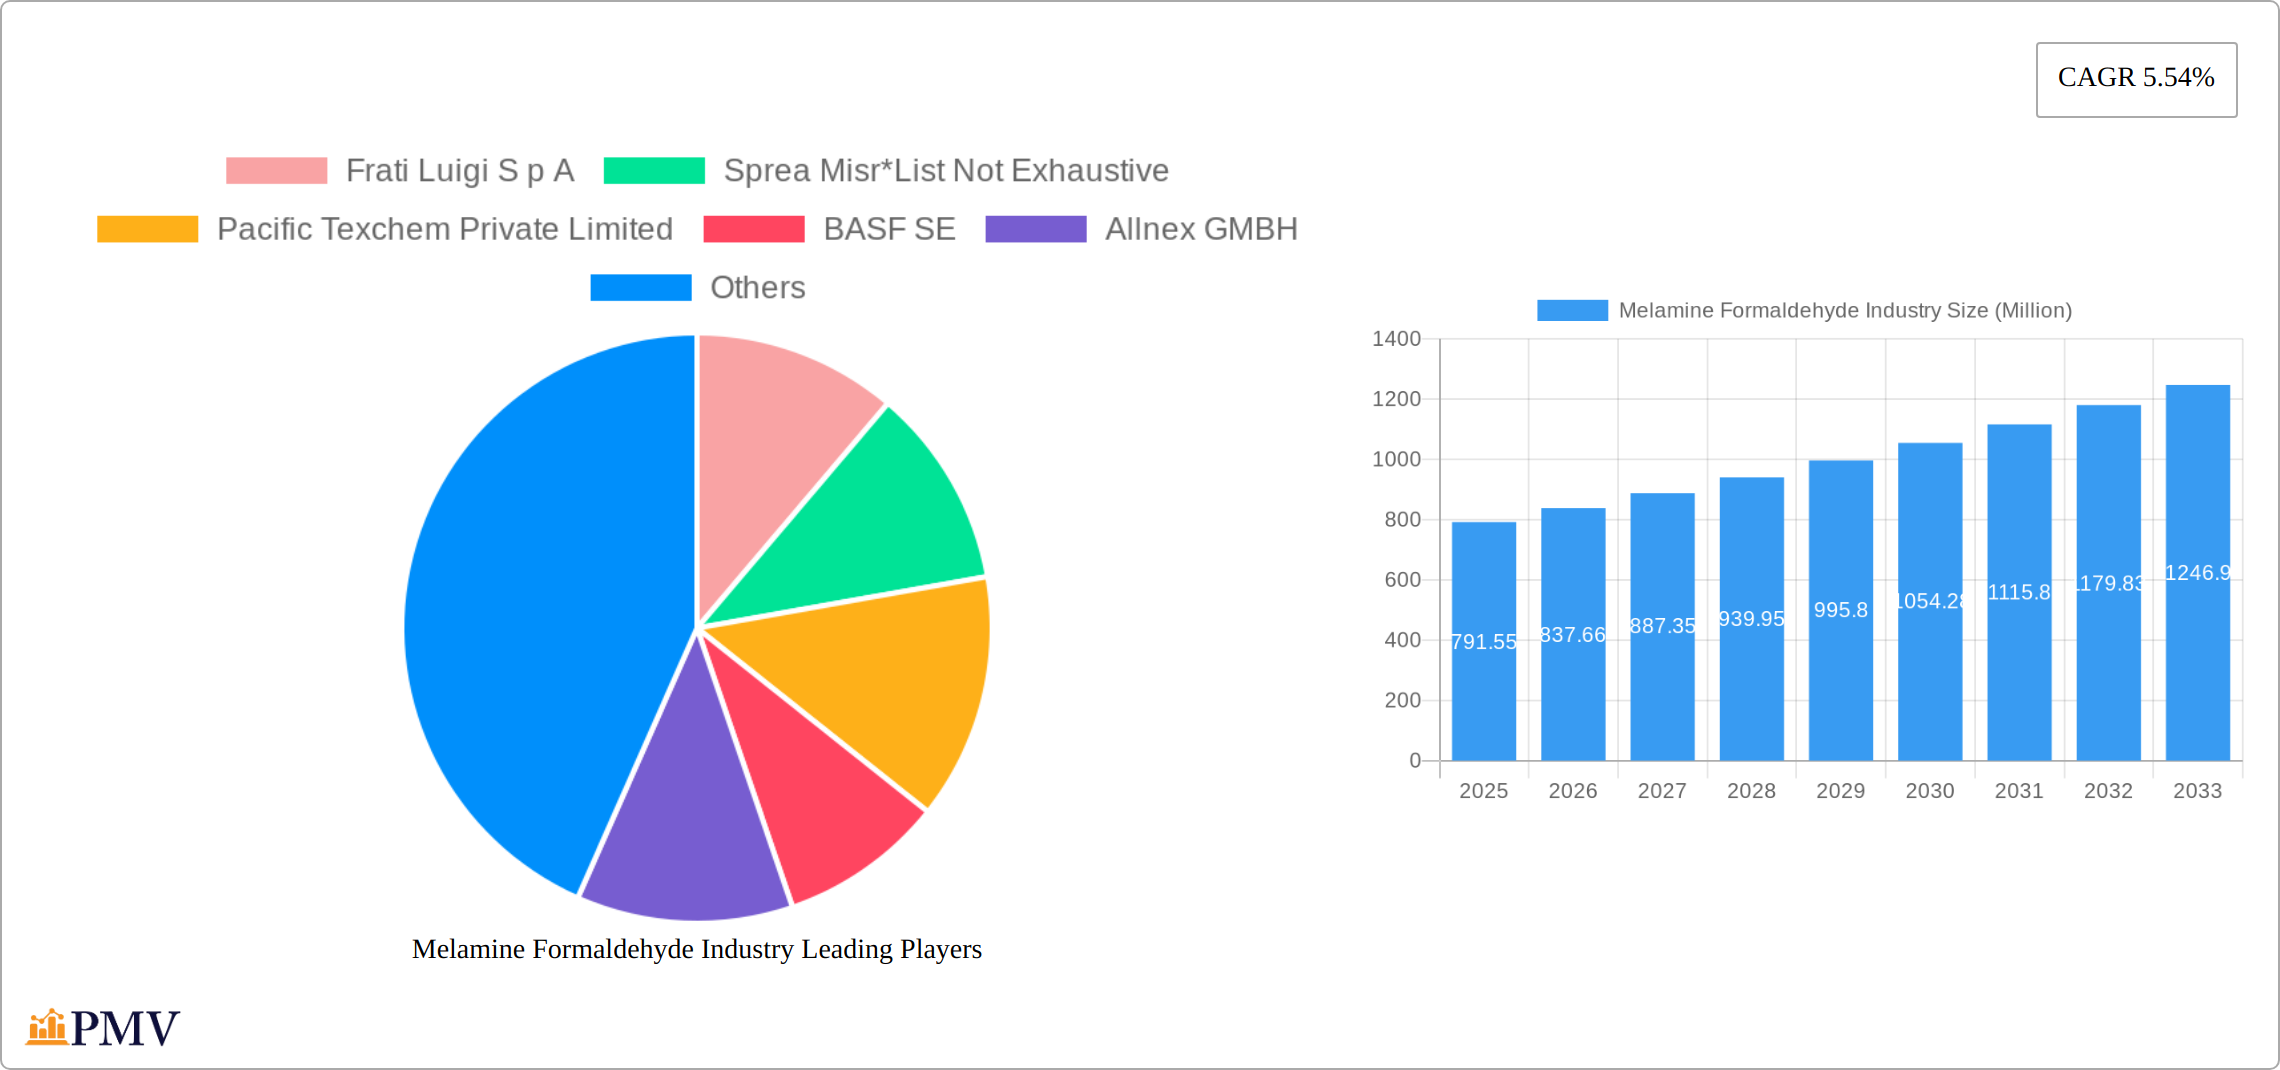
The global Melamine Formaldehyde Resin (MFR) market, valued at $791.55 million in 2025, is projected to experience robust growth, driven by increasing demand across diverse applications. The 5.54% CAGR from 2025 to 2033 indicates a significant expansion, fueled primarily by the construction and automotive industries. Growing infrastructure development globally, particularly in Asia-Pacific and North America, significantly boosts the demand for laminates and wood adhesives, key applications of MFR. Furthermore, the rising adoption of MFR in molding compounds for durable and lightweight components in the automotive sector contributes to market expansion. The increasing preference for sustainable and eco-friendly materials in various applications is also shaping the market landscape, prompting manufacturers to develop more environmentally friendly MFR formulations. However, stringent environmental regulations regarding formaldehyde emissions and fluctuating raw material prices pose challenges to market growth. The market is segmented by type (iso-butylated, n-butylated, and others) and application (laminates, wood adhesives, molding compounds, paints & coatings, and others). Competition within the market is moderately intense, with key players like BASF SE, Hexion, and AkzoNobel NV vying for market share through innovation and strategic partnerships. The Asia-Pacific region is anticipated to dominate the market due to its rapid industrialization and expanding construction sector.
The market's future trajectory depends on several factors. Continued economic growth in key regions will undoubtedly stimulate demand. Technological advancements leading to the development of higher-performance and more sustainable MFR variants will also play a crucial role. Furthermore, collaborations between resin manufacturers and end-users to optimize product formulation and application methods can accelerate market growth. Conversely, potential volatility in raw material costs and stricter environmental regulations could temper market expansion. Companies are actively engaged in research and development to address these challenges and create more efficient and eco-conscious production processes. Therefore, a balanced approach focusing on innovation, sustainability, and strategic partnerships will be crucial for players to thrive in the competitive MFR market.
Melamine Formaldehyde Industry Market Report: 2019-2033
This comprehensive report provides an in-depth analysis of the global Melamine Formaldehyde industry, offering invaluable insights for businesses, investors, and researchers. Covering the period from 2019 to 2033, with a focus on 2025 as the base and estimated year, this study unveils the market's structure, competitive landscape, growth drivers, and future outlook. The report meticulously examines various segments, including different resin types and applications, offering detailed market sizing and growth projections in Millions.
Melamine Formaldehyde Industry Market Structure & Competitive Dynamics
This section analyzes the competitive dynamics of the melamine formaldehyde market, examining market concentration, innovation, regulatory landscapes, and industry trends. The report explores the impact of mergers and acquisitions (M&A) activities, quantifying deal values where possible (xx Million). Key aspects include:
Market Concentration: The report assesses the level of market concentration, identifying major players and their respective market shares. For example, BASF SE and Allnex GMBH are expected to hold significant market share in 2025 (xx% and xx% respectively). The analysis considers factors influencing market concentration, such as economies of scale and barriers to entry.
Innovation Ecosystems: The study evaluates the innovative capacity within the melamine formaldehyde industry, focusing on R&D investments, technological advancements, and the emergence of new product variations. This includes analysis of patent filings and collaborations.
Regulatory Frameworks: The report assesses the impact of existing and emerging regulations on industry players, considering their influence on production processes, material sourcing, and product safety standards.
Product Substitutes: The report identifies potential substitute materials for melamine formaldehyde resins and analyzes their impact on market demand and competition.
End-User Trends: The study analyzes shifts in end-user demand across key applications, identifying emerging trends and their implications for manufacturers.
M&A Activities: The report documents significant M&A activities within the industry during the study period (2019-2024), including deal values (xx Million) and their impact on market consolidation and competitive dynamics. Examples of transactions may include those involving smaller companies being acquired by larger players to expand their product portfolio and market reach.
Melamine Formaldehyde Industry Industry Trends & Insights
This section delves into the key trends shaping the melamine formaldehyde market. The analysis includes:
Market Growth Drivers: Factors such as increasing demand for wood adhesives, laminates, and coatings in construction and furniture industries fuel market expansion. The report quantifies these drivers through market size estimations and Compound Annual Growth Rate (CAGR) projections (e.g., a projected CAGR of xx% from 2025 to 2033 for the global market).
Technological Disruptions: The report examines emerging technologies that are impacting the industry, such as advancements in resin formulations and manufacturing processes leading to improved product performance and efficiency.
Consumer Preferences: The influence of consumer preferences for sustainable and environmentally friendly products is assessed, considering their impact on market demand and product development.
Competitive Dynamics: The competitive landscape continues to evolve, with companies focusing on strategic alliances and expansion into new markets. The report analyzes these competitive strategies and their implications for market share and profitability. This includes an assessment of pricing strategies and marketing efforts by key players.

Dominant Markets & Segments in Melamine Formaldehyde Industry
This section identifies the leading regional, national, and segmental markets.
Leading Regions/Countries: (Example: The Asia-Pacific region is projected to dominate the melamine formaldehyde market in 2025, driven by robust construction activity and industrial growth in countries like China and India.)
Dominant Segments:
Type: Iso-butylated Melamine Formaldehyde Resin is likely to hold the largest market share, followed by n-butylated Melamine Formaldehyde Resin and Other Types. The report analyzes the market size and growth prospects of each type.
Application: Laminates is expected to be the largest application segment, driven by increasing demand in the construction industry. Wood Adhesives, Molding Compounds, and Paints and Coatings represent significant application segments, each with detailed analysis of market size and growth drivers.
Key Drivers:
Economic Policies: Government initiatives promoting construction and infrastructure development significantly influence market growth in various regions.
Infrastructure Development: Expansion in infrastructure projects worldwide fuels the demand for melamine formaldehyde resins in various applications.
The detailed dominance analysis explores the factors contributing to the market leadership of specific regions, countries, and segments, including economic conditions, government policies, and consumer preferences.
Melamine Formaldehyde Industry Product Innovations
Recent product developments have focused on enhancing the performance characteristics of melamine formaldehyde resins, including improved durability, water resistance, and adhesion properties. This has enabled the expansion into new applications and the creation of more sustainable and environmentally friendly products. Technological trends such as the use of nanotechnology and bio-based materials are driving innovation in the industry, offering enhanced product features and cost-effectiveness.
Report Segmentation & Scope
This report segments the Melamine Formaldehyde market based on:
Type:
- Iso-butylated Melamine Formaldehyde Resin: [Growth projection, market size in Million, competitive dynamics]
- n-butylated Melamine Formaldehyde Resin: [Growth projection, market size in Million, competitive dynamics]
- Other Types: [Growth projection, market size in Million, competitive dynamics]
Application:
- Laminates: [Growth projection, market size in Million, competitive dynamics]
- Wood Adhesives: [Growth projection, market size in Million, competitive dynamics]
- Molding Compounds: [Growth projection, market size in Million, competitive dynamics]
- Paints and Coatings: [Growth projection, market size in Million, competitive dynamics]
- Other Applications: [Growth projection, market size in Million, competitive dynamics]
Key Drivers of Melamine Formaldehyde Industry Growth
The growth of the melamine formaldehyde industry is driven by several key factors: the rising demand for construction materials, furniture, and consumer goods; technological advancements leading to improved resin formulations and production processes; and supportive government policies promoting infrastructure development in various regions.
Challenges in the Melamine Formaldehyde Industry Sector
The industry faces challenges such as fluctuating raw material prices, stringent environmental regulations, and intense competition from substitute materials. These factors can impact production costs, profitability, and market share.
Leading Players in the Melamine Formaldehyde Industry Market
- Frati Luigi S p A
- Sprea Misr
- Pacific Texchem Private Limited
- BASF SE
- Allnex GMBH
- Hexion
- Metadynea Metafrax Group
- AkzoNobel NV
- Arclin Inc
- Cornerstone Chemical
Key Developments in Melamine Formaldehyde Industry Sector
- 2022 Q3: Allnex GMBH launched a new, sustainably produced melamine formaldehyde resin.
- 2021 Q4: BASF SE announced a significant investment in expanding its melamine formaldehyde production capacity.
- 2020 Q1: A major merger between two smaller players resulted in a significant shift in the market share. (Further details within the full report) (Note: These are example developments. The full report will contain more detailed and updated information.)
Strategic Melamine Formaldehyde Industry Market Outlook
The melamine formaldehyde market is poised for significant growth in the coming years, driven by increasing demand from key sectors and ongoing technological advancements. Strategic opportunities exist for companies to capitalize on this growth through innovation, expansion into new markets, and strategic partnerships. Focusing on sustainable and environmentally friendly solutions will be crucial for long-term success in this evolving market.
Melamine Formaldehyde Industry Segmentation
-
1. Type
- 1.1. Iso-butylated Melamine Formaldehyde Resin
- 1.2. n-butylated Melamine Formaldehyde Resin
- 1.3. Other Types
-
2. Application
- 2.1. Laminates
- 2.2. Wood Adhesives
- 2.3. Molding Compounds
- 2.4. Paints and Coatings
- 2.5. Other Applications
Melamine Formaldehyde Industry Segmentation By Geography
-
1. Asia Pacific
- 1.1. China
- 1.2. India
- 1.3. Japan
- 1.4. South Korea
- 1.5. Rest of Asia Pacific
-
2. North America
- 2.1. United States
- 2.2. Canada
- 2.3. Mexico
-
3. Europe
- 3.1. Germany
- 3.2. United Kingdom
- 3.3. France
- 3.4. Italy
- 3.5. Rest of Europe
-
4. South America
- 4.1. Brazil
- 4.2. Argentina
- 4.3. Rest of South America
-
5. Middle East and Africa
- 5.1. Saudi Arabia
- 5.2. South Africa
- 5.3. Rest of Middle East and Africa

Melamine Formaldehyde Industry REPORT HIGHLIGHTS
| Aspects | Details |
|---|---|
| Study Period | 2019-2033 |
| Base Year | 2024 |
| Estimated Year | 2025 |
| Forecast Period | 2025-2033 |
| Historical Period | 2019-2024 |
| Growth Rate | CAGR of 5.54% from 2019-2033 |
| Segmentation |
|
Table of Contents
- 1. Introduction
- 1.1. Research Scope
- 1.2. Market Segmentation
- 1.3. Research Methodology
- 1.4. Definitions and Assumptions
- 2. Executive Summary
- 2.1. Introduction
- 3. Market Dynamics
- 3.1. Introduction
- 3.2. Market Drivers
- 3.2.1. Growing Demand for Formica Laminated Furniture; Growth in the Construction Industry; Other Drivers
- 3.3. Market Restrains
- 3.3.1. Decline in the Automotive Industry; Other Restraints
- 3.4. Market Trends
- 3.4.1. Laminates Segment to Dominate the Market
- 4. Market Factor Analysis
- 4.1. Porters Five Forces
- 4.2. Supply/Value Chain
- 4.3. PESTEL analysis
- 4.4. Market Entropy
- 4.5. Patent/Trademark Analysis
- 5. Global Melamine Formaldehyde Industry Analysis, Insights and Forecast, 2019-2031
- 5.1. Market Analysis, Insights and Forecast - by Type
- 5.1.1. Iso-butylated Melamine Formaldehyde Resin
- 5.1.2. n-butylated Melamine Formaldehyde Resin
- 5.1.3. Other Types
- 5.2. Market Analysis, Insights and Forecast - by Application
- 5.2.1. Laminates
- 5.2.2. Wood Adhesives
- 5.2.3. Molding Compounds
- 5.2.4. Paints and Coatings
- 5.2.5. Other Applications
- 5.3. Market Analysis, Insights and Forecast - by Region
- 5.3.1. Asia Pacific
- 5.3.2. North America
- 5.3.3. Europe
- 5.3.4. South America
- 5.3.5. Middle East and Africa
- 5.1. Market Analysis, Insights and Forecast - by Type
- 6. Asia Pacific Melamine Formaldehyde Industry Analysis, Insights and Forecast, 2019-2031
- 6.1. Market Analysis, Insights and Forecast - by Type
- 6.1.1. Iso-butylated Melamine Formaldehyde Resin
- 6.1.2. n-butylated Melamine Formaldehyde Resin
- 6.1.3. Other Types
- 6.2. Market Analysis, Insights and Forecast - by Application
- 6.2.1. Laminates
- 6.2.2. Wood Adhesives
- 6.2.3. Molding Compounds
- 6.2.4. Paints and Coatings
- 6.2.5. Other Applications
- 6.1. Market Analysis, Insights and Forecast - by Type
- 7. North America Melamine Formaldehyde Industry Analysis, Insights and Forecast, 2019-2031
- 7.1. Market Analysis, Insights and Forecast - by Type
- 7.1.1. Iso-butylated Melamine Formaldehyde Resin
- 7.1.2. n-butylated Melamine Formaldehyde Resin
- 7.1.3. Other Types
- 7.2. Market Analysis, Insights and Forecast - by Application
- 7.2.1. Laminates
- 7.2.2. Wood Adhesives
- 7.2.3. Molding Compounds
- 7.2.4. Paints and Coatings
- 7.2.5. Other Applications
- 7.1. Market Analysis, Insights and Forecast - by Type
- 8. Europe Melamine Formaldehyde Industry Analysis, Insights and Forecast, 2019-2031
- 8.1. Market Analysis, Insights and Forecast - by Type
- 8.1.1. Iso-butylated Melamine Formaldehyde Resin
- 8.1.2. n-butylated Melamine Formaldehyde Resin
- 8.1.3. Other Types
- 8.2. Market Analysis, Insights and Forecast - by Application
- 8.2.1. Laminates
- 8.2.2. Wood Adhesives
- 8.2.3. Molding Compounds
- 8.2.4. Paints and Coatings
- 8.2.5. Other Applications
- 8.1. Market Analysis, Insights and Forecast - by Type
- 9. South America Melamine Formaldehyde Industry Analysis, Insights and Forecast, 2019-2031
- 9.1. Market Analysis, Insights and Forecast - by Type
- 9.1.1. Iso-butylated Melamine Formaldehyde Resin
- 9.1.2. n-butylated Melamine Formaldehyde Resin
- 9.1.3. Other Types
- 9.2. Market Analysis, Insights and Forecast - by Application
- 9.2.1. Laminates
- 9.2.2. Wood Adhesives
- 9.2.3. Molding Compounds
- 9.2.4. Paints and Coatings
- 9.2.5. Other Applications
- 9.1. Market Analysis, Insights and Forecast - by Type
- 10. Middle East and Africa Melamine Formaldehyde Industry Analysis, Insights and Forecast, 2019-2031
- 10.1. Market Analysis, Insights and Forecast - by Type
- 10.1.1. Iso-butylated Melamine Formaldehyde Resin
- 10.1.2. n-butylated Melamine Formaldehyde Resin
- 10.1.3. Other Types
- 10.2. Market Analysis, Insights and Forecast - by Application
- 10.2.1. Laminates
- 10.2.2. Wood Adhesives
- 10.2.3. Molding Compounds
- 10.2.4. Paints and Coatings
- 10.2.5. Other Applications
- 10.1. Market Analysis, Insights and Forecast - by Type
- 11. North America Melamine Formaldehyde Industry Analysis, Insights and Forecast, 2019-2031
- 11.1. Market Analysis, Insights and Forecast - By Country/Sub-region
- 11.1.1 United States
- 11.1.2 Canada
- 11.1.3 Mexico
- 12. Europe Melamine Formaldehyde Industry Analysis, Insights and Forecast, 2019-2031
- 12.1. Market Analysis, Insights and Forecast - By Country/Sub-region
- 12.1.1 Germany
- 12.1.2 France
- 12.1.3 Italy
- 12.1.4 United Kingdom
- 12.1.5 Netherlands
- 12.1.6 Rest of Europe
- 13. Asia Pacific Melamine Formaldehyde Industry Analysis, Insights and Forecast, 2019-2031
- 13.1. Market Analysis, Insights and Forecast - By Country/Sub-region
- 13.1.1 China
- 13.1.2 Japan
- 13.1.3 India
- 13.1.4 South Korea
- 13.1.5 Taiwan
- 13.1.6 Australia
- 13.1.7 Rest of Asia-Pacific
- 14. South America Melamine Formaldehyde Industry Analysis, Insights and Forecast, 2019-2031
- 14.1. Market Analysis, Insights and Forecast - By Country/Sub-region
- 14.1.1 Brazil
- 14.1.2 Argentina
- 14.1.3 Rest of South America
- 15. MEA Melamine Formaldehyde Industry Analysis, Insights and Forecast, 2019-2031
- 15.1. Market Analysis, Insights and Forecast - By Country/Sub-region
- 15.1.1 Middle East
- 15.1.2 Africa
- 16. Competitive Analysis
- 16.1. Global Market Share Analysis 2024
- 16.2. Company Profiles
- 16.2.1 Frati Luigi S p A
- 16.2.1.1. Overview
- 16.2.1.2. Products
- 16.2.1.3. SWOT Analysis
- 16.2.1.4. Recent Developments
- 16.2.1.5. Financials (Based on Availability)
- 16.2.2 Sprea Misr*List Not Exhaustive
- 16.2.2.1. Overview
- 16.2.2.2. Products
- 16.2.2.3. SWOT Analysis
- 16.2.2.4. Recent Developments
- 16.2.2.5. Financials (Based on Availability)
- 16.2.3 Pacific Texchem Private Limited
- 16.2.3.1. Overview
- 16.2.3.2. Products
- 16.2.3.3. SWOT Analysis
- 16.2.3.4. Recent Developments
- 16.2.3.5. Financials (Based on Availability)
- 16.2.4 BASF SE
- 16.2.4.1. Overview
- 16.2.4.2. Products
- 16.2.4.3. SWOT Analysis
- 16.2.4.4. Recent Developments
- 16.2.4.5. Financials (Based on Availability)
- 16.2.5 Allnex GMBH
- 16.2.5.1. Overview
- 16.2.5.2. Products
- 16.2.5.3. SWOT Analysis
- 16.2.5.4. Recent Developments
- 16.2.5.5. Financials (Based on Availability)
- 16.2.6 Hexion
- 16.2.6.1. Overview
- 16.2.6.2. Products
- 16.2.6.3. SWOT Analysis
- 16.2.6.4. Recent Developments
- 16.2.6.5. Financials (Based on Availability)
- 16.2.7 Metadynea Metafrax Group
- 16.2.7.1. Overview
- 16.2.7.2. Products
- 16.2.7.3. SWOT Analysis
- 16.2.7.4. Recent Developments
- 16.2.7.5. Financials (Based on Availability)
- 16.2.8 AkzoNobel NV
- 16.2.8.1. Overview
- 16.2.8.2. Products
- 16.2.8.3. SWOT Analysis
- 16.2.8.4. Recent Developments
- 16.2.8.5. Financials (Based on Availability)
- 16.2.9 Arclin Inc
- 16.2.9.1. Overview
- 16.2.9.2. Products
- 16.2.9.3. SWOT Analysis
- 16.2.9.4. Recent Developments
- 16.2.9.5. Financials (Based on Availability)
- 16.2.10 Cornerstone Chemical
- 16.2.10.1. Overview
- 16.2.10.2. Products
- 16.2.10.3. SWOT Analysis
- 16.2.10.4. Recent Developments
- 16.2.10.5. Financials (Based on Availability)
- 16.2.1 Frati Luigi S p A
List of Figures
- Figure 1: Global Melamine Formaldehyde Industry Revenue Breakdown (Million, %) by Region 2024 & 2032
- Figure 2: Global Melamine Formaldehyde Industry Volume Breakdown (K Tons, %) by Region 2024 & 2032
- Figure 3: North America Melamine Formaldehyde Industry Revenue (Million), by Country 2024 & 2032
- Figure 4: North America Melamine Formaldehyde Industry Volume (K Tons), by Country 2024 & 2032
- Figure 5: North America Melamine Formaldehyde Industry Revenue Share (%), by Country 2024 & 2032
- Figure 6: North America Melamine Formaldehyde Industry Volume Share (%), by Country 2024 & 2032
- Figure 7: Europe Melamine Formaldehyde Industry Revenue (Million), by Country 2024 & 2032
- Figure 8: Europe Melamine Formaldehyde Industry Volume (K Tons), by Country 2024 & 2032
- Figure 9: Europe Melamine Formaldehyde Industry Revenue Share (%), by Country 2024 & 2032
- Figure 10: Europe Melamine Formaldehyde Industry Volume Share (%), by Country 2024 & 2032
- Figure 11: Asia Pacific Melamine Formaldehyde Industry Revenue (Million), by Country 2024 & 2032
- Figure 12: Asia Pacific Melamine Formaldehyde Industry Volume (K Tons), by Country 2024 & 2032
- Figure 13: Asia Pacific Melamine Formaldehyde Industry Revenue Share (%), by Country 2024 & 2032
- Figure 14: Asia Pacific Melamine Formaldehyde Industry Volume Share (%), by Country 2024 & 2032
- Figure 15: South America Melamine Formaldehyde Industry Revenue (Million), by Country 2024 & 2032
- Figure 16: South America Melamine Formaldehyde Industry Volume (K Tons), by Country 2024 & 2032
- Figure 17: South America Melamine Formaldehyde Industry Revenue Share (%), by Country 2024 & 2032
- Figure 18: South America Melamine Formaldehyde Industry Volume Share (%), by Country 2024 & 2032
- Figure 19: MEA Melamine Formaldehyde Industry Revenue (Million), by Country 2024 & 2032
- Figure 20: MEA Melamine Formaldehyde Industry Volume (K Tons), by Country 2024 & 2032
- Figure 21: MEA Melamine Formaldehyde Industry Revenue Share (%), by Country 2024 & 2032
- Figure 22: MEA Melamine Formaldehyde Industry Volume Share (%), by Country 2024 & 2032
- Figure 23: Asia Pacific Melamine Formaldehyde Industry Revenue (Million), by Type 2024 & 2032
- Figure 24: Asia Pacific Melamine Formaldehyde Industry Volume (K Tons), by Type 2024 & 2032
- Figure 25: Asia Pacific Melamine Formaldehyde Industry Revenue Share (%), by Type 2024 & 2032
- Figure 26: Asia Pacific Melamine Formaldehyde Industry Volume Share (%), by Type 2024 & 2032
- Figure 27: Asia Pacific Melamine Formaldehyde Industry Revenue (Million), by Application 2024 & 2032
- Figure 28: Asia Pacific Melamine Formaldehyde Industry Volume (K Tons), by Application 2024 & 2032
- Figure 29: Asia Pacific Melamine Formaldehyde Industry Revenue Share (%), by Application 2024 & 2032
- Figure 30: Asia Pacific Melamine Formaldehyde Industry Volume Share (%), by Application 2024 & 2032
- Figure 31: Asia Pacific Melamine Formaldehyde Industry Revenue (Million), by Country 2024 & 2032
- Figure 32: Asia Pacific Melamine Formaldehyde Industry Volume (K Tons), by Country 2024 & 2032
- Figure 33: Asia Pacific Melamine Formaldehyde Industry Revenue Share (%), by Country 2024 & 2032
- Figure 34: Asia Pacific Melamine Formaldehyde Industry Volume Share (%), by Country 2024 & 2032
- Figure 35: North America Melamine Formaldehyde Industry Revenue (Million), by Type 2024 & 2032
- Figure 36: North America Melamine Formaldehyde Industry Volume (K Tons), by Type 2024 & 2032
- Figure 37: North America Melamine Formaldehyde Industry Revenue Share (%), by Type 2024 & 2032
- Figure 38: North America Melamine Formaldehyde Industry Volume Share (%), by Type 2024 & 2032
- Figure 39: North America Melamine Formaldehyde Industry Revenue (Million), by Application 2024 & 2032
- Figure 40: North America Melamine Formaldehyde Industry Volume (K Tons), by Application 2024 & 2032
- Figure 41: North America Melamine Formaldehyde Industry Revenue Share (%), by Application 2024 & 2032
- Figure 42: North America Melamine Formaldehyde Industry Volume Share (%), by Application 2024 & 2032
- Figure 43: North America Melamine Formaldehyde Industry Revenue (Million), by Country 2024 & 2032
- Figure 44: North America Melamine Formaldehyde Industry Volume (K Tons), by Country 2024 & 2032
- Figure 45: North America Melamine Formaldehyde Industry Revenue Share (%), by Country 2024 & 2032
- Figure 46: North America Melamine Formaldehyde Industry Volume Share (%), by Country 2024 & 2032
- Figure 47: Europe Melamine Formaldehyde Industry Revenue (Million), by Type 2024 & 2032
- Figure 48: Europe Melamine Formaldehyde Industry Volume (K Tons), by Type 2024 & 2032
- Figure 49: Europe Melamine Formaldehyde Industry Revenue Share (%), by Type 2024 & 2032
- Figure 50: Europe Melamine Formaldehyde Industry Volume Share (%), by Type 2024 & 2032
- Figure 51: Europe Melamine Formaldehyde Industry Revenue (Million), by Application 2024 & 2032
- Figure 52: Europe Melamine Formaldehyde Industry Volume (K Tons), by Application 2024 & 2032
- Figure 53: Europe Melamine Formaldehyde Industry Revenue Share (%), by Application 2024 & 2032
- Figure 54: Europe Melamine Formaldehyde Industry Volume Share (%), by Application 2024 & 2032
- Figure 55: Europe Melamine Formaldehyde Industry Revenue (Million), by Country 2024 & 2032
- Figure 56: Europe Melamine Formaldehyde Industry Volume (K Tons), by Country 2024 & 2032
- Figure 57: Europe Melamine Formaldehyde Industry Revenue Share (%), by Country 2024 & 2032
- Figure 58: Europe Melamine Formaldehyde Industry Volume Share (%), by Country 2024 & 2032
- Figure 59: South America Melamine Formaldehyde Industry Revenue (Million), by Type 2024 & 2032
- Figure 60: South America Melamine Formaldehyde Industry Volume (K Tons), by Type 2024 & 2032
- Figure 61: South America Melamine Formaldehyde Industry Revenue Share (%), by Type 2024 & 2032
- Figure 62: South America Melamine Formaldehyde Industry Volume Share (%), by Type 2024 & 2032
- Figure 63: South America Melamine Formaldehyde Industry Revenue (Million), by Application 2024 & 2032
- Figure 64: South America Melamine Formaldehyde Industry Volume (K Tons), by Application 2024 & 2032
- Figure 65: South America Melamine Formaldehyde Industry Revenue Share (%), by Application 2024 & 2032
- Figure 66: South America Melamine Formaldehyde Industry Volume Share (%), by Application 2024 & 2032
- Figure 67: South America Melamine Formaldehyde Industry Revenue (Million), by Country 2024 & 2032
- Figure 68: South America Melamine Formaldehyde Industry Volume (K Tons), by Country 2024 & 2032
- Figure 69: South America Melamine Formaldehyde Industry Revenue Share (%), by Country 2024 & 2032
- Figure 70: South America Melamine Formaldehyde Industry Volume Share (%), by Country 2024 & 2032
- Figure 71: Middle East and Africa Melamine Formaldehyde Industry Revenue (Million), by Type 2024 & 2032
- Figure 72: Middle East and Africa Melamine Formaldehyde Industry Volume (K Tons), by Type 2024 & 2032
- Figure 73: Middle East and Africa Melamine Formaldehyde Industry Revenue Share (%), by Type 2024 & 2032
- Figure 74: Middle East and Africa Melamine Formaldehyde Industry Volume Share (%), by Type 2024 & 2032
- Figure 75: Middle East and Africa Melamine Formaldehyde Industry Revenue (Million), by Application 2024 & 2032
- Figure 76: Middle East and Africa Melamine Formaldehyde Industry Volume (K Tons), by Application 2024 & 2032
- Figure 77: Middle East and Africa Melamine Formaldehyde Industry Revenue Share (%), by Application 2024 & 2032
- Figure 78: Middle East and Africa Melamine Formaldehyde Industry Volume Share (%), by Application 2024 & 2032
- Figure 79: Middle East and Africa Melamine Formaldehyde Industry Revenue (Million), by Country 2024 & 2032
- Figure 80: Middle East and Africa Melamine Formaldehyde Industry Volume (K Tons), by Country 2024 & 2032
- Figure 81: Middle East and Africa Melamine Formaldehyde Industry Revenue Share (%), by Country 2024 & 2032
- Figure 82: Middle East and Africa Melamine Formaldehyde Industry Volume Share (%), by Country 2024 & 2032
List of Tables
- Table 1: Global Melamine Formaldehyde Industry Revenue Million Forecast, by Region 2019 & 2032
- Table 2: Global Melamine Formaldehyde Industry Volume K Tons Forecast, by Region 2019 & 2032
- Table 3: Global Melamine Formaldehyde Industry Revenue Million Forecast, by Type 2019 & 2032
- Table 4: Global Melamine Formaldehyde Industry Volume K Tons Forecast, by Type 2019 & 2032
- Table 5: Global Melamine Formaldehyde Industry Revenue Million Forecast, by Application 2019 & 2032
- Table 6: Global Melamine Formaldehyde Industry Volume K Tons Forecast, by Application 2019 & 2032
- Table 7: Global Melamine Formaldehyde Industry Revenue Million Forecast, by Region 2019 & 2032
- Table 8: Global Melamine Formaldehyde Industry Volume K Tons Forecast, by Region 2019 & 2032
- Table 9: Global Melamine Formaldehyde Industry Revenue Million Forecast, by Country 2019 & 2032
- Table 10: Global Melamine Formaldehyde Industry Volume K Tons Forecast, by Country 2019 & 2032
- Table 11: United States Melamine Formaldehyde Industry Revenue (Million) Forecast, by Application 2019 & 2032
- Table 12: United States Melamine Formaldehyde Industry Volume (K Tons) Forecast, by Application 2019 & 2032
- Table 13: Canada Melamine Formaldehyde Industry Revenue (Million) Forecast, by Application 2019 & 2032
- Table 14: Canada Melamine Formaldehyde Industry Volume (K Tons) Forecast, by Application 2019 & 2032
- Table 15: Mexico Melamine Formaldehyde Industry Revenue (Million) Forecast, by Application 2019 & 2032
- Table 16: Mexico Melamine Formaldehyde Industry Volume (K Tons) Forecast, by Application 2019 & 2032
- Table 17: Global Melamine Formaldehyde Industry Revenue Million Forecast, by Country 2019 & 2032
- Table 18: Global Melamine Formaldehyde Industry Volume K Tons Forecast, by Country 2019 & 2032
- Table 19: Germany Melamine Formaldehyde Industry Revenue (Million) Forecast, by Application 2019 & 2032
- Table 20: Germany Melamine Formaldehyde Industry Volume (K Tons) Forecast, by Application 2019 & 2032
- Table 21: France Melamine Formaldehyde Industry Revenue (Million) Forecast, by Application 2019 & 2032
- Table 22: France Melamine Formaldehyde Industry Volume (K Tons) Forecast, by Application 2019 & 2032
- Table 23: Italy Melamine Formaldehyde Industry Revenue (Million) Forecast, by Application 2019 & 2032
- Table 24: Italy Melamine Formaldehyde Industry Volume (K Tons) Forecast, by Application 2019 & 2032
- Table 25: United Kingdom Melamine Formaldehyde Industry Revenue (Million) Forecast, by Application 2019 & 2032
- Table 26: United Kingdom Melamine Formaldehyde Industry Volume (K Tons) Forecast, by Application 2019 & 2032
- Table 27: Netherlands Melamine Formaldehyde Industry Revenue (Million) Forecast, by Application 2019 & 2032
- Table 28: Netherlands Melamine Formaldehyde Industry Volume (K Tons) Forecast, by Application 2019 & 2032
- Table 29: Rest of Europe Melamine Formaldehyde Industry Revenue (Million) Forecast, by Application 2019 & 2032
- Table 30: Rest of Europe Melamine Formaldehyde Industry Volume (K Tons) Forecast, by Application 2019 & 2032
- Table 31: Global Melamine Formaldehyde Industry Revenue Million Forecast, by Country 2019 & 2032
- Table 32: Global Melamine Formaldehyde Industry Volume K Tons Forecast, by Country 2019 & 2032
- Table 33: China Melamine Formaldehyde Industry Revenue (Million) Forecast, by Application 2019 & 2032
- Table 34: China Melamine Formaldehyde Industry Volume (K Tons) Forecast, by Application 2019 & 2032
- Table 35: Japan Melamine Formaldehyde Industry Revenue (Million) Forecast, by Application 2019 & 2032
- Table 36: Japan Melamine Formaldehyde Industry Volume (K Tons) Forecast, by Application 2019 & 2032
- Table 37: India Melamine Formaldehyde Industry Revenue (Million) Forecast, by Application 2019 & 2032
- Table 38: India Melamine Formaldehyde Industry Volume (K Tons) Forecast, by Application 2019 & 2032
- Table 39: South Korea Melamine Formaldehyde Industry Revenue (Million) Forecast, by Application 2019 & 2032
- Table 40: South Korea Melamine Formaldehyde Industry Volume (K Tons) Forecast, by Application 2019 & 2032
- Table 41: Taiwan Melamine Formaldehyde Industry Revenue (Million) Forecast, by Application 2019 & 2032
- Table 42: Taiwan Melamine Formaldehyde Industry Volume (K Tons) Forecast, by Application 2019 & 2032
- Table 43: Australia Melamine Formaldehyde Industry Revenue (Million) Forecast, by Application 2019 & 2032
- Table 44: Australia Melamine Formaldehyde Industry Volume (K Tons) Forecast, by Application 2019 & 2032
- Table 45: Rest of Asia-Pacific Melamine Formaldehyde Industry Revenue (Million) Forecast, by Application 2019 & 2032
- Table 46: Rest of Asia-Pacific Melamine Formaldehyde Industry Volume (K Tons) Forecast, by Application 2019 & 2032
- Table 47: Global Melamine Formaldehyde Industry Revenue Million Forecast, by Country 2019 & 2032
- Table 48: Global Melamine Formaldehyde Industry Volume K Tons Forecast, by Country 2019 & 2032
- Table 49: Brazil Melamine Formaldehyde Industry Revenue (Million) Forecast, by Application 2019 & 2032
- Table 50: Brazil Melamine Formaldehyde Industry Volume (K Tons) Forecast, by Application 2019 & 2032
- Table 51: Argentina Melamine Formaldehyde Industry Revenue (Million) Forecast, by Application 2019 & 2032
- Table 52: Argentina Melamine Formaldehyde Industry Volume (K Tons) Forecast, by Application 2019 & 2032
- Table 53: Rest of South America Melamine Formaldehyde Industry Revenue (Million) Forecast, by Application 2019 & 2032
- Table 54: Rest of South America Melamine Formaldehyde Industry Volume (K Tons) Forecast, by Application 2019 & 2032
- Table 55: Global Melamine Formaldehyde Industry Revenue Million Forecast, by Country 2019 & 2032
- Table 56: Global Melamine Formaldehyde Industry Volume K Tons Forecast, by Country 2019 & 2032
- Table 57: Middle East Melamine Formaldehyde Industry Revenue (Million) Forecast, by Application 2019 & 2032
- Table 58: Middle East Melamine Formaldehyde Industry Volume (K Tons) Forecast, by Application 2019 & 2032
- Table 59: Africa Melamine Formaldehyde Industry Revenue (Million) Forecast, by Application 2019 & 2032
- Table 60: Africa Melamine Formaldehyde Industry Volume (K Tons) Forecast, by Application 2019 & 2032
- Table 61: Global Melamine Formaldehyde Industry Revenue Million Forecast, by Type 2019 & 2032
- Table 62: Global Melamine Formaldehyde Industry Volume K Tons Forecast, by Type 2019 & 2032
- Table 63: Global Melamine Formaldehyde Industry Revenue Million Forecast, by Application 2019 & 2032
- Table 64: Global Melamine Formaldehyde Industry Volume K Tons Forecast, by Application 2019 & 2032
- Table 65: Global Melamine Formaldehyde Industry Revenue Million Forecast, by Country 2019 & 2032
- Table 66: Global Melamine Formaldehyde Industry Volume K Tons Forecast, by Country 2019 & 2032
- Table 67: China Melamine Formaldehyde Industry Revenue (Million) Forecast, by Application 2019 & 2032
- Table 68: China Melamine Formaldehyde Industry Volume (K Tons) Forecast, by Application 2019 & 2032
- Table 69: India Melamine Formaldehyde Industry Revenue (Million) Forecast, by Application 2019 & 2032
- Table 70: India Melamine Formaldehyde Industry Volume (K Tons) Forecast, by Application 2019 & 2032
- Table 71: Japan Melamine Formaldehyde Industry Revenue (Million) Forecast, by Application 2019 & 2032
- Table 72: Japan Melamine Formaldehyde Industry Volume (K Tons) Forecast, by Application 2019 & 2032
- Table 73: South Korea Melamine Formaldehyde Industry Revenue (Million) Forecast, by Application 2019 & 2032
- Table 74: South Korea Melamine Formaldehyde Industry Volume (K Tons) Forecast, by Application 2019 & 2032
- Table 75: Rest of Asia Pacific Melamine Formaldehyde Industry Revenue (Million) Forecast, by Application 2019 & 2032
- Table 76: Rest of Asia Pacific Melamine Formaldehyde Industry Volume (K Tons) Forecast, by Application 2019 & 2032
- Table 77: Global Melamine Formaldehyde Industry Revenue Million Forecast, by Type 2019 & 2032
- Table 78: Global Melamine Formaldehyde Industry Volume K Tons Forecast, by Type 2019 & 2032
- Table 79: Global Melamine Formaldehyde Industry Revenue Million Forecast, by Application 2019 & 2032
- Table 80: Global Melamine Formaldehyde Industry Volume K Tons Forecast, by Application 2019 & 2032
- Table 81: Global Melamine Formaldehyde Industry Revenue Million Forecast, by Country 2019 & 2032
- Table 82: Global Melamine Formaldehyde Industry Volume K Tons Forecast, by Country 2019 & 2032
- Table 83: United States Melamine Formaldehyde Industry Revenue (Million) Forecast, by Application 2019 & 2032
- Table 84: United States Melamine Formaldehyde Industry Volume (K Tons) Forecast, by Application 2019 & 2032
- Table 85: Canada Melamine Formaldehyde Industry Revenue (Million) Forecast, by Application 2019 & 2032
- Table 86: Canada Melamine Formaldehyde Industry Volume (K Tons) Forecast, by Application 2019 & 2032
- Table 87: Mexico Melamine Formaldehyde Industry Revenue (Million) Forecast, by Application 2019 & 2032
- Table 88: Mexico Melamine Formaldehyde Industry Volume (K Tons) Forecast, by Application 2019 & 2032
- Table 89: Global Melamine Formaldehyde Industry Revenue Million Forecast, by Type 2019 & 2032
- Table 90: Global Melamine Formaldehyde Industry Volume K Tons Forecast, by Type 2019 & 2032
- Table 91: Global Melamine Formaldehyde Industry Revenue Million Forecast, by Application 2019 & 2032
- Table 92: Global Melamine Formaldehyde Industry Volume K Tons Forecast, by Application 2019 & 2032
- Table 93: Global Melamine Formaldehyde Industry Revenue Million Forecast, by Country 2019 & 2032
- Table 94: Global Melamine Formaldehyde Industry Volume K Tons Forecast, by Country 2019 & 2032
- Table 95: Germany Melamine Formaldehyde Industry Revenue (Million) Forecast, by Application 2019 & 2032
- Table 96: Germany Melamine Formaldehyde Industry Volume (K Tons) Forecast, by Application 2019 & 2032
- Table 97: United Kingdom Melamine Formaldehyde Industry Revenue (Million) Forecast, by Application 2019 & 2032
- Table 98: United Kingdom Melamine Formaldehyde Industry Volume (K Tons) Forecast, by Application 2019 & 2032
- Table 99: France Melamine Formaldehyde Industry Revenue (Million) Forecast, by Application 2019 & 2032
- Table 100: France Melamine Formaldehyde Industry Volume (K Tons) Forecast, by Application 2019 & 2032
- Table 101: Italy Melamine Formaldehyde Industry Revenue (Million) Forecast, by Application 2019 & 2032
- Table 102: Italy Melamine Formaldehyde Industry Volume (K Tons) Forecast, by Application 2019 & 2032
- Table 103: Rest of Europe Melamine Formaldehyde Industry Revenue (Million) Forecast, by Application 2019 & 2032
- Table 104: Rest of Europe Melamine Formaldehyde Industry Volume (K Tons) Forecast, by Application 2019 & 2032
- Table 105: Global Melamine Formaldehyde Industry Revenue Million Forecast, by Type 2019 & 2032
- Table 106: Global Melamine Formaldehyde Industry Volume K Tons Forecast, by Type 2019 & 2032
- Table 107: Global Melamine Formaldehyde Industry Revenue Million Forecast, by Application 2019 & 2032
- Table 108: Global Melamine Formaldehyde Industry Volume K Tons Forecast, by Application 2019 & 2032
- Table 109: Global Melamine Formaldehyde Industry Revenue Million Forecast, by Country 2019 & 2032
- Table 110: Global Melamine Formaldehyde Industry Volume K Tons Forecast, by Country 2019 & 2032
- Table 111: Brazil Melamine Formaldehyde Industry Revenue (Million) Forecast, by Application 2019 & 2032
- Table 112: Brazil Melamine Formaldehyde Industry Volume (K Tons) Forecast, by Application 2019 & 2032
- Table 113: Argentina Melamine Formaldehyde Industry Revenue (Million) Forecast, by Application 2019 & 2032
- Table 114: Argentina Melamine Formaldehyde Industry Volume (K Tons) Forecast, by Application 2019 & 2032
- Table 115: Rest of South America Melamine Formaldehyde Industry Revenue (Million) Forecast, by Application 2019 & 2032
- Table 116: Rest of South America Melamine Formaldehyde Industry Volume (K Tons) Forecast, by Application 2019 & 2032
- Table 117: Global Melamine Formaldehyde Industry Revenue Million Forecast, by Type 2019 & 2032
- Table 118: Global Melamine Formaldehyde Industry Volume K Tons Forecast, by Type 2019 & 2032
- Table 119: Global Melamine Formaldehyde Industry Revenue Million Forecast, by Application 2019 & 2032
- Table 120: Global Melamine Formaldehyde Industry Volume K Tons Forecast, by Application 2019 & 2032
- Table 121: Global Melamine Formaldehyde Industry Revenue Million Forecast, by Country 2019 & 2032
- Table 122: Global Melamine Formaldehyde Industry Volume K Tons Forecast, by Country 2019 & 2032
- Table 123: Saudi Arabia Melamine Formaldehyde Industry Revenue (Million) Forecast, by Application 2019 & 2032
- Table 124: Saudi Arabia Melamine Formaldehyde Industry Volume (K Tons) Forecast, by Application 2019 & 2032
- Table 125: South Africa Melamine Formaldehyde Industry Revenue (Million) Forecast, by Application 2019 & 2032
- Table 126: South Africa Melamine Formaldehyde Industry Volume (K Tons) Forecast, by Application 2019 & 2032
- Table 127: Rest of Middle East and Africa Melamine Formaldehyde Industry Revenue (Million) Forecast, by Application 2019 & 2032
- Table 128: Rest of Middle East and Africa Melamine Formaldehyde Industry Volume (K Tons) Forecast, by Application 2019 & 2032
Frequently Asked Questions
1. What is the projected Compound Annual Growth Rate (CAGR) of the Melamine Formaldehyde Industry?
The projected CAGR is approximately 5.54%.
2. Which companies are prominent players in the Melamine Formaldehyde Industry?
Key companies in the market include Frati Luigi S p A, Sprea Misr*List Not Exhaustive, Pacific Texchem Private Limited, BASF SE, Allnex GMBH, Hexion, Metadynea Metafrax Group, AkzoNobel NV, Arclin Inc, Cornerstone Chemical.
3. What are the main segments of the Melamine Formaldehyde Industry?
The market segments include Type, Application.
4. Can you provide details about the market size?
The market size is estimated to be USD 791.55 Million as of 2022.
5. What are some drivers contributing to market growth?
Growing Demand for Formica Laminated Furniture; Growth in the Construction Industry; Other Drivers.
6. What are the notable trends driving market growth?
Laminates Segment to Dominate the Market.
7. Are there any restraints impacting market growth?
Decline in the Automotive Industry; Other Restraints.
8. Can you provide examples of recent developments in the market?
The recent developments about the major players in the market are being covered in the complete study.
9. What pricing options are available for accessing the report?
Pricing options include single-user, multi-user, and enterprise licenses priced at USD 3,950, USD 4,950, and USD 6,950 respectively.
10. Is the market size provided in terms of value or volume?
The market size is provided in terms of value, measured in Million and volume, measured in K Tons.
11. Are there any specific market keywords associated with the report?
Yes, the market keyword associated with the report is "Melamine Formaldehyde Industry," which aids in identifying and referencing the specific market segment covered.
12. How do I determine which pricing option suits my needs best?
The pricing options vary based on user requirements and access needs. Individual users may opt for single-user licenses, while businesses requiring broader access may choose multi-user or enterprise licenses for cost-effective access to the report.
13. Are there any additional resources or data provided in the Melamine Formaldehyde Industry report?
While the report offers comprehensive insights, it's advisable to review the specific contents or supplementary materials provided to ascertain if additional resources or data are available.
14. How can I stay updated on further developments or reports in the Melamine Formaldehyde Industry?
To stay informed about further developments, trends, and reports in the Melamine Formaldehyde Industry, consider subscribing to industry newsletters, following relevant companies and organizations, or regularly checking reputable industry news sources and publications.
Methodology
Step 1 - Identification of Relevant Samples Size from Population Database


Step 2 - Approaches for Defining Global Market Size (Value, Volume* & Price*)

Note*: In applicable scenarios
Step 3 - Data Sources
Primary Research
- Web Analytics
- Survey Reports
- Research Institute
- Latest Research Reports
- Opinion Leaders
Secondary Research
- Annual Reports
- White Paper
- Latest Press Release
- Industry Association
- Paid Database
- Investor Presentations

Step 4 - Data Triangulation
Involves using different sources of information in order to increase the validity of a study
These sources are likely to be stakeholders in a program - participants, other researchers, program staff, other community members, and so on.
Then we put all data in single framework & apply various statistical tools to find out the dynamic on the market.
During the analysis stage, feedback from the stakeholder groups would be compared to determine areas of agreement as well as areas of divergence


