
Key Insights
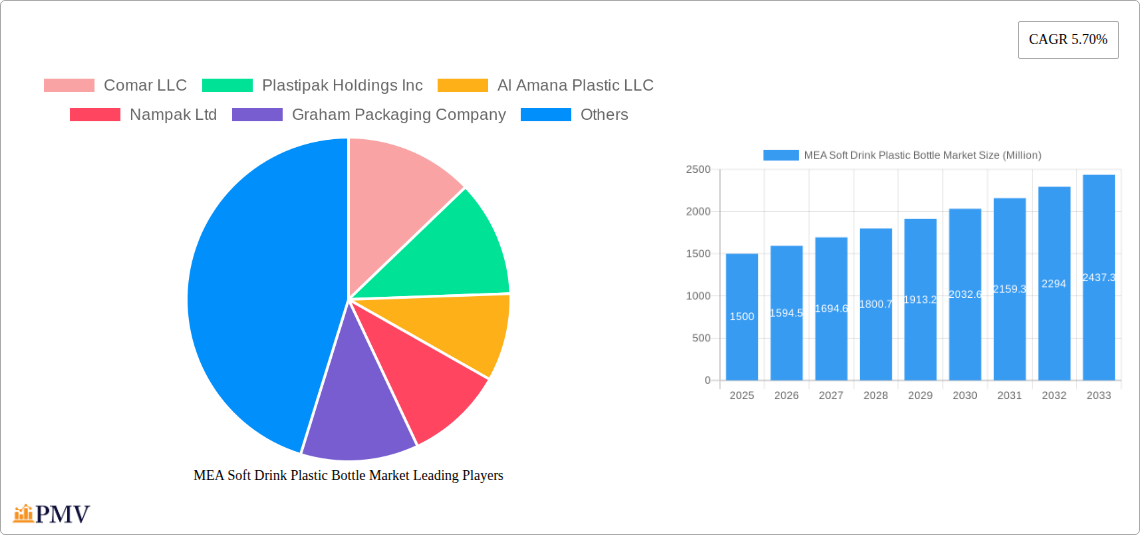
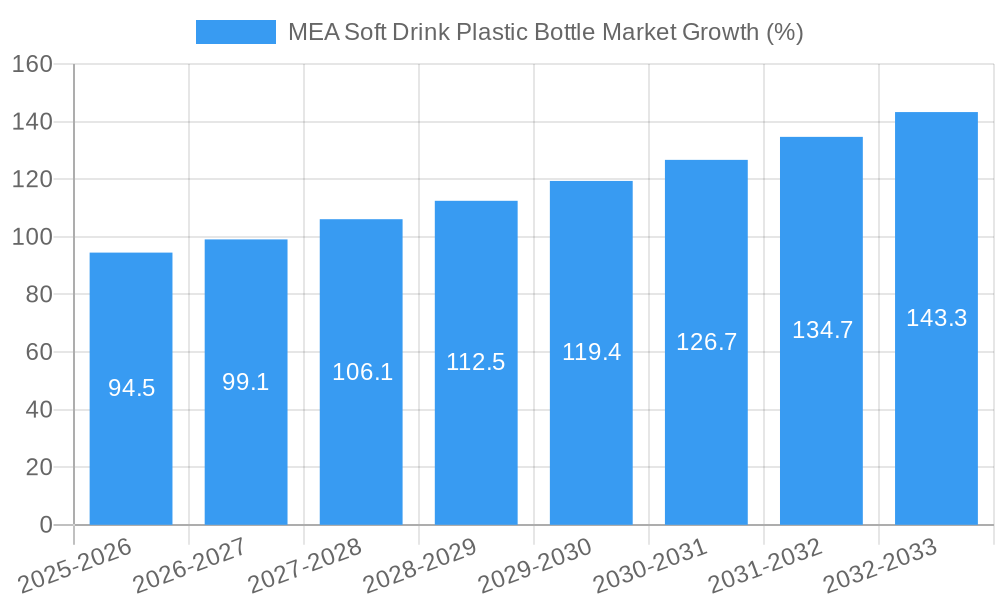
The Middle East and Africa (MEA) soft drink plastic bottle market is experiencing robust growth, driven by increasing consumption of carbonated soft drinks and bottled water, particularly in rapidly urbanizing regions. The market's expansion is fueled by rising disposable incomes, changing lifestyles, and a preference for convenient, on-the-go beverage options. Significant growth is observed across various segments, including PET bottles, which dominate due to their lightweight, cost-effective nature and recyclability. The beverage segment, specifically carbonated soft drinks, holds the largest market share, followed by bottled water. However, growing health concerns and environmental awareness are creating headwinds, prompting a gradual shift towards sustainable packaging options like recycled PET and biodegradable alternatives. Key players in the market are focusing on innovation, expanding production capacities, and strategic partnerships to capitalize on the market's potential. The competitive landscape is characterized by a mix of both multinational corporations and regional players, creating a dynamic market with varied pricing strategies and product offerings. Growth is expected to remain strong throughout the forecast period, with a projected CAGR of 5.70%, driven by ongoing economic development and evolving consumer preferences. However, factors like fluctuating raw material prices and stricter environmental regulations will continue to pose challenges.
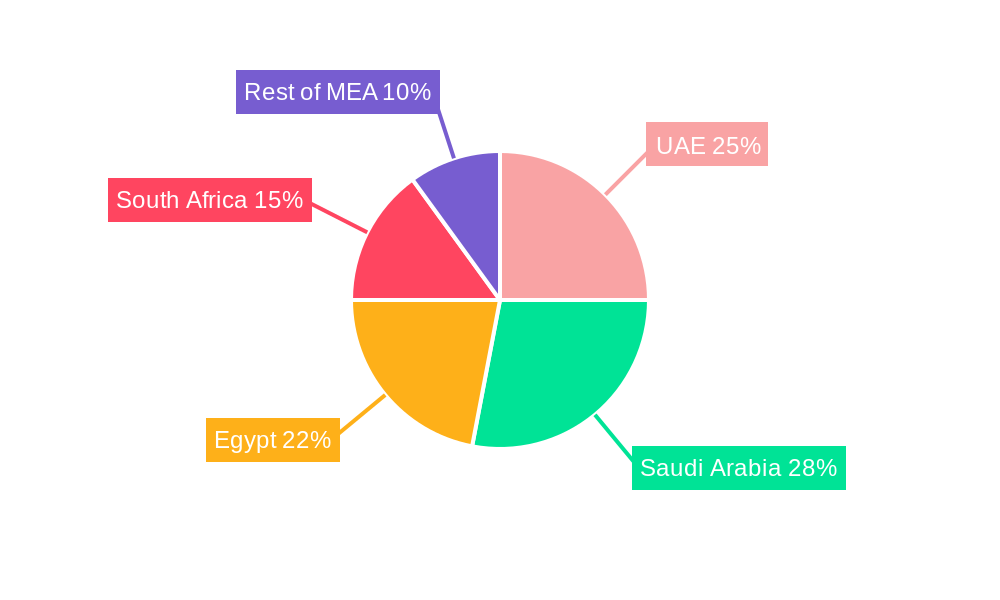
Despite the positive growth outlook, the market faces challenges. Fluctuations in raw material prices, particularly petroleum-based resins, impact production costs and profitability. Increasing environmental regulations regarding plastic waste are driving demand for more sustainable packaging solutions, pushing manufacturers to invest in recycling initiatives and explore eco-friendly alternatives. Furthermore, the market is experiencing intense competition, with established players and new entrants vying for market share. This competitive pressure necessitates continuous innovation in product design, manufacturing processes, and supply chain management. Regional variations exist, with countries like the UAE, Saudi Arabia, and Egypt leading market growth, fuelled by higher per capita consumption and robust infrastructure development. The Rest of MEA region presents significant untapped potential, promising future expansion opportunities as consumer habits evolve and economic activity strengthens.
MEA Soft Drink Plastic Bottle Market: A Comprehensive Market Analysis Report (2019-2033)
This in-depth report provides a comprehensive analysis of the Middle East and Africa (MEA) soft drink plastic bottle market, offering valuable insights for industry stakeholders. Covering the period from 2019 to 2033, with 2025 as the base year, this study examines market size, growth drivers, competitive dynamics, and future trends. The report segments the market by raw materials (PET, PP, LDPE, HDPE, and other raw materials) and end-user verticals (beverages, food, cosmetics, pharmaceuticals, household care, and other end-user verticals). Key players such as Comar LLC, Plastipak Holdings Inc, Al Amana Plastic LLC, Nampak Ltd, Graham Packaging Company, Amcor PLC, Altium Packaging LLC, Takween Advanced Industries, Alpha Packaging, Container Corporation of Canada Ltd, Gerresheimer AG, and ALPLA Group are profiled, along with an analysis of their market share and strategic initiatives. The report projects a xx Million market value by 2033, indicating substantial growth opportunities.
MEA Soft Drink Plastic Bottle Market Market Structure & Competitive Dynamics
The MEA soft drink plastic bottle market exhibits a moderately concentrated structure, with a few dominant players and several smaller regional competitors. Market share is largely determined by production capacity, distribution networks, and brand recognition. Innovation plays a significant role, with companies investing in sustainable packaging solutions like recycled PET and lightweight designs. Regulatory frameworks, particularly concerning plastic waste management and environmental regulations, are increasingly influential. The market also faces competition from alternative packaging materials like glass and aluminum. Recent M&A activities have been focused on expanding geographical reach and enhancing technological capabilities. Deal values have ranged from xx Million to xx Million in recent years, depending on the size and strategic importance of the acquired company.
- Market Concentration: Moderately concentrated, with top 5 players holding approximately xx% market share.
- Innovation Ecosystem: Active, with focus on sustainable materials and lightweighting technologies.
- Regulatory Framework: Increasingly stringent environmental regulations impacting material choices and waste management.
- Product Substitutes: Glass, aluminum, and alternative packaging materials present competitive pressure.
- End-User Trends: Growing demand for sustainable and convenient packaging solutions.
- M&A Activity: Consolidation trend observed, driven by expansion and technological advancements.
MEA Soft Drink Plastic Bottle Market Industry Trends & Insights
The MEA soft drink plastic bottle market is experiencing robust growth, driven by increasing soft drink consumption, expanding populations, and rising disposable incomes across several regions. Technological advancements, such as lightweighting and the adoption of recycled PET, are improving sustainability and efficiency. Consumer preferences are shifting towards more environmentally friendly options, creating opportunities for companies that offer sustainable packaging solutions. The market CAGR during the forecast period (2025-2033) is projected at xx%, driven by factors like improving infrastructure, growing urbanization, and increasing demand from the food and beverage industry. Market penetration of recycled PET is estimated at approximately xx% in 2025, projected to reach xx% by 2033. Intense competition necessitates continuous innovation and efficient supply chain management.
Dominant Markets & Segments in MEA Soft Drink Plastic Bottle Market
The PET segment dominates the MEA soft drink plastic bottle market by raw material, owing to its clarity, recyclability, and cost-effectiveness. Within the end-user vertical, the beverage industry holds the largest market share due to the extensive use of plastic bottles in soft drink packaging. Key growth drivers for the PET segment include its high barrier properties and suitability for high-speed filling processes. The beverage segment's dominance is fuelled by rising consumption of soft drinks and the convenience offered by plastic bottle packaging.
- Leading Region: [Specify the leading region, e.g., North Africa] driven by [Reason, e.g., rising population and disposable incomes]
- Leading Country: [Specify the leading country, e.g., Egypt] driven by [Reason, e.g., strong economic growth and expanding soft drink industry]
- Leading Segment (Raw Material): PET, due to its [Reasons, e.g., recyclability, cost-effectiveness, and barrier properties]
- Leading Segment (End-user): Beverages, due to [Reasons, e.g., high soft drink consumption and convenient packaging]
MEA Soft Drink Plastic Bottle Market Product Innovations
Recent innovations focus on sustainable and lightweight designs, utilizing recycled materials like PCR PET and incorporating features such as improved barrier properties to enhance shelf life. These innovations cater to growing consumer demand for eco-friendly products and offer cost advantages to manufacturers. The development of thinner bottles using advanced manufacturing techniques also plays a crucial role in reducing material consumption and transportation costs, contributing to both sustainability goals and economic efficiency.
Report Segmentation & Scope
This report segments the MEA soft drink plastic bottle market by raw material type (PET, PP, LDPE, HDPE, and Other Raw Materials) and end-user vertical (Beverages, Food, Cosmetics, Pharmaceuticals, Household Care, and Other End-user Verticals). Each segment is analyzed based on its market size, growth projections, and competitive dynamics. Growth projections vary across segments, reflecting the differing growth rates of their respective end-user industries and technological advancements within each material type. The competitive landscape within each segment is also analyzed, highlighting key players, their market strategies, and the level of competition.
Key Drivers of MEA Soft Drink Plastic Bottle Market Growth
Key drivers include rising disposable incomes, increasing urbanization, and growing demand for convenient packaging solutions. Furthermore, technological innovations focused on sustainability, such as the increased adoption of recycled PET, are propelling market growth. Favorable government policies that promote investment in the packaging industry also contribute significantly. The expansion of the food and beverage industry across the region further fuels market expansion.
Challenges in the MEA Soft Drink Plastic Bottle Market Sector
Challenges include the rising costs of raw materials, fluctuating oil prices, and concerns about plastic waste management. Stringent environmental regulations pose a significant hurdle, requiring companies to adopt sustainable practices and invest in recycling infrastructure. Fluctuating oil prices influence the cost of production and can impact market profitability. Competition from alternative packaging materials also poses a significant challenge.
Leading Players in the MEA Soft Drink Plastic Bottle Market Market
- Comar LLC
- Plastipak Holdings Inc
- Al Amana Plastic LLC
- Nampak Ltd
- Graham Packaging Company
- Amcor PLC
- Altium Packaging LLC
- Takween Advanced Industries
- Alpha Packaging
- Container Corporation of Canada Ltd
- Gerresheimer AG
- ALPLA Group
Key Developments in MEA Soft Drink Plastic Bottle Market Sector
- March 2021: Amcor PLC launched its first fresh milk bottle in Argentina, made with 20% PCR PET resin, highlighting the increasing adoption of recycled materials.
- June 2021: Plastipak Packaging partnered with BioteCH4 to power its Clean Tech PET recycling plant using anaerobic digestion, showcasing a commitment to sustainable practices.
Strategic MEA Soft Drink Plastic Bottle Market Market Outlook
The MEA soft drink plastic bottle market holds significant future potential driven by sustained economic growth, expanding populations, and increasing demand for convenient packaging. Strategic opportunities lie in investing in sustainable packaging solutions, expanding into new markets, and developing innovative products that cater to evolving consumer preferences. Companies that can effectively navigate environmental regulations and adopt sustainable manufacturing practices will be well-positioned for long-term success.
MEA Soft Drink Plastic Bottle Market Segmentation
-
1. Raw Materials
- 1.1. PET
- 1.2. PP
- 1.3. LDPE
- 1.4. HDPE
- 1.5. Other Raw Materials
-
2. End-user Vertical
- 2.1. Beverages
- 2.2. Food
- 2.3. Cosmetics
- 2.4. Pharmaceuticals
- 2.5. Household Care
- 2.6. Other End-user Verticals
-
3. Geography
- 3.1. United Arab Emirates
- 3.2. Saudi Arabia
- 3.3. Egypt
- 3.4. South Africa
- 3.5. Rest of Middle East and Africa
MEA Soft Drink Plastic Bottle Market Segmentation By Geography
- 1. United Arab Emirates
- 2. Saudi Arabia
- 3. Egypt
- 4. South Africa
- 5. Rest of Middle East and Africa
MEA Soft Drink Plastic Bottle Market REPORT HIGHLIGHTS
| Aspects | Details |
|---|---|
| Study Period | 2019-2033 |
| Base Year | 2024 |
| Estimated Year | 2025 |
| Forecast Period | 2025-2033 |
| Historical Period | 2019-2024 |
| Growth Rate | CAGR of 5.70% from 2019-2033 |
| Segmentation |
|
Table of Contents
- 1. Introduction
- 1.1. Research Scope
- 1.2. Market Segmentation
- 1.3. Research Methodology
- 1.4. Definitions and Assumptions
- 2. Executive Summary
- 2.1. Introduction
- 3. Market Dynamics
- 3.1. Introduction
- 3.2. Market Drivers
- 3.2.1. Increasing Adoption of Lightweight Packaging Methods
- 3.3. Market Restrains
- 3.3.1. Environmental Concerns Regarding Use of Plastics
- 3.4. Market Trends
- 3.4.1. Food and Beverage Industry is Expected to Witness Significant Growth
- 4. Market Factor Analysis
- 4.1. Porters Five Forces
- 4.2. Supply/Value Chain
- 4.3. PESTEL analysis
- 4.4. Market Entropy
- 4.5. Patent/Trademark Analysis
- 5. Global MEA Soft Drink Plastic Bottle Market Analysis, Insights and Forecast, 2019-2031
- 5.1. Market Analysis, Insights and Forecast - by Raw Materials
- 5.1.1. PET
- 5.1.2. PP
- 5.1.3. LDPE
- 5.1.4. HDPE
- 5.1.5. Other Raw Materials
- 5.2. Market Analysis, Insights and Forecast - by End-user Vertical
- 5.2.1. Beverages
- 5.2.2. Food
- 5.2.3. Cosmetics
- 5.2.4. Pharmaceuticals
- 5.2.5. Household Care
- 5.2.6. Other End-user Verticals
- 5.3. Market Analysis, Insights and Forecast - by Geography
- 5.3.1. United Arab Emirates
- 5.3.2. Saudi Arabia
- 5.3.3. Egypt
- 5.3.4. South Africa
- 5.3.5. Rest of Middle East and Africa
- 5.4. Market Analysis, Insights and Forecast - by Region
- 5.4.1. United Arab Emirates
- 5.4.2. Saudi Arabia
- 5.4.3. Egypt
- 5.4.4. South Africa
- 5.4.5. Rest of Middle East and Africa
- 5.1. Market Analysis, Insights and Forecast - by Raw Materials
- 6. United Arab Emirates MEA Soft Drink Plastic Bottle Market Analysis, Insights and Forecast, 2019-2031
- 6.1. Market Analysis, Insights and Forecast - by Raw Materials
- 6.1.1. PET
- 6.1.2. PP
- 6.1.3. LDPE
- 6.1.4. HDPE
- 6.1.5. Other Raw Materials
- 6.2. Market Analysis, Insights and Forecast - by End-user Vertical
- 6.2.1. Beverages
- 6.2.2. Food
- 6.2.3. Cosmetics
- 6.2.4. Pharmaceuticals
- 6.2.5. Household Care
- 6.2.6. Other End-user Verticals
- 6.3. Market Analysis, Insights and Forecast - by Geography
- 6.3.1. United Arab Emirates
- 6.3.2. Saudi Arabia
- 6.3.3. Egypt
- 6.3.4. South Africa
- 6.3.5. Rest of Middle East and Africa
- 6.1. Market Analysis, Insights and Forecast - by Raw Materials
- 7. Saudi Arabia MEA Soft Drink Plastic Bottle Market Analysis, Insights and Forecast, 2019-2031
- 7.1. Market Analysis, Insights and Forecast - by Raw Materials
- 7.1.1. PET
- 7.1.2. PP
- 7.1.3. LDPE
- 7.1.4. HDPE
- 7.1.5. Other Raw Materials
- 7.2. Market Analysis, Insights and Forecast - by End-user Vertical
- 7.2.1. Beverages
- 7.2.2. Food
- 7.2.3. Cosmetics
- 7.2.4. Pharmaceuticals
- 7.2.5. Household Care
- 7.2.6. Other End-user Verticals
- 7.3. Market Analysis, Insights and Forecast - by Geography
- 7.3.1. United Arab Emirates
- 7.3.2. Saudi Arabia
- 7.3.3. Egypt
- 7.3.4. South Africa
- 7.3.5. Rest of Middle East and Africa
- 7.1. Market Analysis, Insights and Forecast - by Raw Materials
- 8. Egypt MEA Soft Drink Plastic Bottle Market Analysis, Insights and Forecast, 2019-2031
- 8.1. Market Analysis, Insights and Forecast - by Raw Materials
- 8.1.1. PET
- 8.1.2. PP
- 8.1.3. LDPE
- 8.1.4. HDPE
- 8.1.5. Other Raw Materials
- 8.2. Market Analysis, Insights and Forecast - by End-user Vertical
- 8.2.1. Beverages
- 8.2.2. Food
- 8.2.3. Cosmetics
- 8.2.4. Pharmaceuticals
- 8.2.5. Household Care
- 8.2.6. Other End-user Verticals
- 8.3. Market Analysis, Insights and Forecast - by Geography
- 8.3.1. United Arab Emirates
- 8.3.2. Saudi Arabia
- 8.3.3. Egypt
- 8.3.4. South Africa
- 8.3.5. Rest of Middle East and Africa
- 8.1. Market Analysis, Insights and Forecast - by Raw Materials
- 9. South Africa MEA Soft Drink Plastic Bottle Market Analysis, Insights and Forecast, 2019-2031
- 9.1. Market Analysis, Insights and Forecast - by Raw Materials
- 9.1.1. PET
- 9.1.2. PP
- 9.1.3. LDPE
- 9.1.4. HDPE
- 9.1.5. Other Raw Materials
- 9.2. Market Analysis, Insights and Forecast - by End-user Vertical
- 9.2.1. Beverages
- 9.2.2. Food
- 9.2.3. Cosmetics
- 9.2.4. Pharmaceuticals
- 9.2.5. Household Care
- 9.2.6. Other End-user Verticals
- 9.3. Market Analysis, Insights and Forecast - by Geography
- 9.3.1. United Arab Emirates
- 9.3.2. Saudi Arabia
- 9.3.3. Egypt
- 9.3.4. South Africa
- 9.3.5. Rest of Middle East and Africa
- 9.1. Market Analysis, Insights and Forecast - by Raw Materials
- 10. Rest of Middle East and Africa MEA Soft Drink Plastic Bottle Market Analysis, Insights and Forecast, 2019-2031
- 10.1. Market Analysis, Insights and Forecast - by Raw Materials
- 10.1.1. PET
- 10.1.2. PP
- 10.1.3. LDPE
- 10.1.4. HDPE
- 10.1.5. Other Raw Materials
- 10.2. Market Analysis, Insights and Forecast - by End-user Vertical
- 10.2.1. Beverages
- 10.2.2. Food
- 10.2.3. Cosmetics
- 10.2.4. Pharmaceuticals
- 10.2.5. Household Care
- 10.2.6. Other End-user Verticals
- 10.3. Market Analysis, Insights and Forecast - by Geography
- 10.3.1. United Arab Emirates
- 10.3.2. Saudi Arabia
- 10.3.3. Egypt
- 10.3.4. South Africa
- 10.3.5. Rest of Middle East and Africa
- 10.1. Market Analysis, Insights and Forecast - by Raw Materials
- 11. United Arab Emirates MEA Soft Drink Plastic Bottle Market Analysis, Insights and Forecast, 2019-2031
- 11.1. Market Analysis, Insights and Forecast - By Country/Sub-region
- 11.1.1.
- 12. Saudi Arabia MEA Soft Drink Plastic Bottle Market Analysis, Insights and Forecast, 2019-2031
- 12.1. Market Analysis, Insights and Forecast - By Country/Sub-region
- 12.1.1.
- 13. Egypt MEA Soft Drink Plastic Bottle Market Analysis, Insights and Forecast, 2019-2031
- 13.1. Market Analysis, Insights and Forecast - By Country/Sub-region
- 13.1.1.
- 14. South Africa MEA Soft Drink Plastic Bottle Market Analysis, Insights and Forecast, 2019-2031
- 14.1. Market Analysis, Insights and Forecast - By Country/Sub-region
- 14.1.1.
- 15. Rest of Middle East and Africa MEA Soft Drink Plastic Bottle Market Analysis, Insights and Forecast, 2019-2031
- 15.1. Market Analysis, Insights and Forecast - By Country/Sub-region
- 15.1.1.
- 16. Competitive Analysis
- 16.1. Global Market Share Analysis 2024
- 16.2. Company Profiles
- 16.2.1 Comar LLC
- 16.2.1.1. Overview
- 16.2.1.2. Products
- 16.2.1.3. SWOT Analysis
- 16.2.1.4. Recent Developments
- 16.2.1.5. Financials (Based on Availability)
- 16.2.2 Plastipak Holdings Inc
- 16.2.2.1. Overview
- 16.2.2.2. Products
- 16.2.2.3. SWOT Analysis
- 16.2.2.4. Recent Developments
- 16.2.2.5. Financials (Based on Availability)
- 16.2.3 Al Amana Plastic LLC
- 16.2.3.1. Overview
- 16.2.3.2. Products
- 16.2.3.3. SWOT Analysis
- 16.2.3.4. Recent Developments
- 16.2.3.5. Financials (Based on Availability)
- 16.2.4 Nampak Ltd
- 16.2.4.1. Overview
- 16.2.4.2. Products
- 16.2.4.3. SWOT Analysis
- 16.2.4.4. Recent Developments
- 16.2.4.5. Financials (Based on Availability)
- 16.2.5 Graham Packaging Company
- 16.2.5.1. Overview
- 16.2.5.2. Products
- 16.2.5.3. SWOT Analysis
- 16.2.5.4. Recent Developments
- 16.2.5.5. Financials (Based on Availability)
- 16.2.6 Amcor PLC
- 16.2.6.1. Overview
- 16.2.6.2. Products
- 16.2.6.3. SWOT Analysis
- 16.2.6.4. Recent Developments
- 16.2.6.5. Financials (Based on Availability)
- 16.2.7 Altium Packaging LLC
- 16.2.7.1. Overview
- 16.2.7.2. Products
- 16.2.7.3. SWOT Analysis
- 16.2.7.4. Recent Developments
- 16.2.7.5. Financials (Based on Availability)
- 16.2.8 Takween Advanced Industries*List Not Exhaustive
- 16.2.8.1. Overview
- 16.2.8.2. Products
- 16.2.8.3. SWOT Analysis
- 16.2.8.4. Recent Developments
- 16.2.8.5. Financials (Based on Availability)
- 16.2.9 Alpha Packaging
- 16.2.9.1. Overview
- 16.2.9.2. Products
- 16.2.9.3. SWOT Analysis
- 16.2.9.4. Recent Developments
- 16.2.9.5. Financials (Based on Availability)
- 16.2.10 Container Corporation of Canada Ltd
- 16.2.10.1. Overview
- 16.2.10.2. Products
- 16.2.10.3. SWOT Analysis
- 16.2.10.4. Recent Developments
- 16.2.10.5. Financials (Based on Availability)
- 16.2.11 Gerresheimer AG
- 16.2.11.1. Overview
- 16.2.11.2. Products
- 16.2.11.3. SWOT Analysis
- 16.2.11.4. Recent Developments
- 16.2.11.5. Financials (Based on Availability)
- 16.2.12 ALPLA Group
- 16.2.12.1. Overview
- 16.2.12.2. Products
- 16.2.12.3. SWOT Analysis
- 16.2.12.4. Recent Developments
- 16.2.12.5. Financials (Based on Availability)
- 16.2.1 Comar LLC
List of Figures
- Figure 1: Global MEA Soft Drink Plastic Bottle Market Revenue Breakdown (Million, %) by Region 2024 & 2032
- Figure 2: United Arab Emirates MEA Soft Drink Plastic Bottle Market Revenue (Million), by Country 2024 & 2032
- Figure 3: United Arab Emirates MEA Soft Drink Plastic Bottle Market Revenue Share (%), by Country 2024 & 2032
- Figure 4: Saudi Arabia MEA Soft Drink Plastic Bottle Market Revenue (Million), by Country 2024 & 2032
- Figure 5: Saudi Arabia MEA Soft Drink Plastic Bottle Market Revenue Share (%), by Country 2024 & 2032
- Figure 6: Egypt MEA Soft Drink Plastic Bottle Market Revenue (Million), by Country 2024 & 2032
- Figure 7: Egypt MEA Soft Drink Plastic Bottle Market Revenue Share (%), by Country 2024 & 2032
- Figure 8: South Africa MEA Soft Drink Plastic Bottle Market Revenue (Million), by Country 2024 & 2032
- Figure 9: South Africa MEA Soft Drink Plastic Bottle Market Revenue Share (%), by Country 2024 & 2032
- Figure 10: Rest of Middle East and Africa MEA Soft Drink Plastic Bottle Market Revenue (Million), by Country 2024 & 2032
- Figure 11: Rest of Middle East and Africa MEA Soft Drink Plastic Bottle Market Revenue Share (%), by Country 2024 & 2032
- Figure 12: United Arab Emirates MEA Soft Drink Plastic Bottle Market Revenue (Million), by Raw Materials 2024 & 2032
- Figure 13: United Arab Emirates MEA Soft Drink Plastic Bottle Market Revenue Share (%), by Raw Materials 2024 & 2032
- Figure 14: United Arab Emirates MEA Soft Drink Plastic Bottle Market Revenue (Million), by End-user Vertical 2024 & 2032
- Figure 15: United Arab Emirates MEA Soft Drink Plastic Bottle Market Revenue Share (%), by End-user Vertical 2024 & 2032
- Figure 16: United Arab Emirates MEA Soft Drink Plastic Bottle Market Revenue (Million), by Geography 2024 & 2032
- Figure 17: United Arab Emirates MEA Soft Drink Plastic Bottle Market Revenue Share (%), by Geography 2024 & 2032
- Figure 18: United Arab Emirates MEA Soft Drink Plastic Bottle Market Revenue (Million), by Country 2024 & 2032
- Figure 19: United Arab Emirates MEA Soft Drink Plastic Bottle Market Revenue Share (%), by Country 2024 & 2032
- Figure 20: Saudi Arabia MEA Soft Drink Plastic Bottle Market Revenue (Million), by Raw Materials 2024 & 2032
- Figure 21: Saudi Arabia MEA Soft Drink Plastic Bottle Market Revenue Share (%), by Raw Materials 2024 & 2032
- Figure 22: Saudi Arabia MEA Soft Drink Plastic Bottle Market Revenue (Million), by End-user Vertical 2024 & 2032
- Figure 23: Saudi Arabia MEA Soft Drink Plastic Bottle Market Revenue Share (%), by End-user Vertical 2024 & 2032
- Figure 24: Saudi Arabia MEA Soft Drink Plastic Bottle Market Revenue (Million), by Geography 2024 & 2032
- Figure 25: Saudi Arabia MEA Soft Drink Plastic Bottle Market Revenue Share (%), by Geography 2024 & 2032
- Figure 26: Saudi Arabia MEA Soft Drink Plastic Bottle Market Revenue (Million), by Country 2024 & 2032
- Figure 27: Saudi Arabia MEA Soft Drink Plastic Bottle Market Revenue Share (%), by Country 2024 & 2032
- Figure 28: Egypt MEA Soft Drink Plastic Bottle Market Revenue (Million), by Raw Materials 2024 & 2032
- Figure 29: Egypt MEA Soft Drink Plastic Bottle Market Revenue Share (%), by Raw Materials 2024 & 2032
- Figure 30: Egypt MEA Soft Drink Plastic Bottle Market Revenue (Million), by End-user Vertical 2024 & 2032
- Figure 31: Egypt MEA Soft Drink Plastic Bottle Market Revenue Share (%), by End-user Vertical 2024 & 2032
- Figure 32: Egypt MEA Soft Drink Plastic Bottle Market Revenue (Million), by Geography 2024 & 2032
- Figure 33: Egypt MEA Soft Drink Plastic Bottle Market Revenue Share (%), by Geography 2024 & 2032
- Figure 34: Egypt MEA Soft Drink Plastic Bottle Market Revenue (Million), by Country 2024 & 2032
- Figure 35: Egypt MEA Soft Drink Plastic Bottle Market Revenue Share (%), by Country 2024 & 2032
- Figure 36: South Africa MEA Soft Drink Plastic Bottle Market Revenue (Million), by Raw Materials 2024 & 2032
- Figure 37: South Africa MEA Soft Drink Plastic Bottle Market Revenue Share (%), by Raw Materials 2024 & 2032
- Figure 38: South Africa MEA Soft Drink Plastic Bottle Market Revenue (Million), by End-user Vertical 2024 & 2032
- Figure 39: South Africa MEA Soft Drink Plastic Bottle Market Revenue Share (%), by End-user Vertical 2024 & 2032
- Figure 40: South Africa MEA Soft Drink Plastic Bottle Market Revenue (Million), by Geography 2024 & 2032
- Figure 41: South Africa MEA Soft Drink Plastic Bottle Market Revenue Share (%), by Geography 2024 & 2032
- Figure 42: South Africa MEA Soft Drink Plastic Bottle Market Revenue (Million), by Country 2024 & 2032
- Figure 43: South Africa MEA Soft Drink Plastic Bottle Market Revenue Share (%), by Country 2024 & 2032
- Figure 44: Rest of Middle East and Africa MEA Soft Drink Plastic Bottle Market Revenue (Million), by Raw Materials 2024 & 2032
- Figure 45: Rest of Middle East and Africa MEA Soft Drink Plastic Bottle Market Revenue Share (%), by Raw Materials 2024 & 2032
- Figure 46: Rest of Middle East and Africa MEA Soft Drink Plastic Bottle Market Revenue (Million), by End-user Vertical 2024 & 2032
- Figure 47: Rest of Middle East and Africa MEA Soft Drink Plastic Bottle Market Revenue Share (%), by End-user Vertical 2024 & 2032
- Figure 48: Rest of Middle East and Africa MEA Soft Drink Plastic Bottle Market Revenue (Million), by Geography 2024 & 2032
- Figure 49: Rest of Middle East and Africa MEA Soft Drink Plastic Bottle Market Revenue Share (%), by Geography 2024 & 2032
- Figure 50: Rest of Middle East and Africa MEA Soft Drink Plastic Bottle Market Revenue (Million), by Country 2024 & 2032
- Figure 51: Rest of Middle East and Africa MEA Soft Drink Plastic Bottle Market Revenue Share (%), by Country 2024 & 2032
List of Tables
- Table 1: Global MEA Soft Drink Plastic Bottle Market Revenue Million Forecast, by Region 2019 & 2032
- Table 2: Global MEA Soft Drink Plastic Bottle Market Revenue Million Forecast, by Raw Materials 2019 & 2032
- Table 3: Global MEA Soft Drink Plastic Bottle Market Revenue Million Forecast, by End-user Vertical 2019 & 2032
- Table 4: Global MEA Soft Drink Plastic Bottle Market Revenue Million Forecast, by Geography 2019 & 2032
- Table 5: Global MEA Soft Drink Plastic Bottle Market Revenue Million Forecast, by Region 2019 & 2032
- Table 6: Global MEA Soft Drink Plastic Bottle Market Revenue Million Forecast, by Country 2019 & 2032
- Table 7: MEA Soft Drink Plastic Bottle Market Revenue (Million) Forecast, by Application 2019 & 2032
- Table 8: Global MEA Soft Drink Plastic Bottle Market Revenue Million Forecast, by Country 2019 & 2032
- Table 9: MEA Soft Drink Plastic Bottle Market Revenue (Million) Forecast, by Application 2019 & 2032
- Table 10: Global MEA Soft Drink Plastic Bottle Market Revenue Million Forecast, by Country 2019 & 2032
- Table 11: MEA Soft Drink Plastic Bottle Market Revenue (Million) Forecast, by Application 2019 & 2032
- Table 12: Global MEA Soft Drink Plastic Bottle Market Revenue Million Forecast, by Country 2019 & 2032
- Table 13: MEA Soft Drink Plastic Bottle Market Revenue (Million) Forecast, by Application 2019 & 2032
- Table 14: Global MEA Soft Drink Plastic Bottle Market Revenue Million Forecast, by Country 2019 & 2032
- Table 15: MEA Soft Drink Plastic Bottle Market Revenue (Million) Forecast, by Application 2019 & 2032
- Table 16: Global MEA Soft Drink Plastic Bottle Market Revenue Million Forecast, by Raw Materials 2019 & 2032
- Table 17: Global MEA Soft Drink Plastic Bottle Market Revenue Million Forecast, by End-user Vertical 2019 & 2032
- Table 18: Global MEA Soft Drink Plastic Bottle Market Revenue Million Forecast, by Geography 2019 & 2032
- Table 19: Global MEA Soft Drink Plastic Bottle Market Revenue Million Forecast, by Country 2019 & 2032
- Table 20: Global MEA Soft Drink Plastic Bottle Market Revenue Million Forecast, by Raw Materials 2019 & 2032
- Table 21: Global MEA Soft Drink Plastic Bottle Market Revenue Million Forecast, by End-user Vertical 2019 & 2032
- Table 22: Global MEA Soft Drink Plastic Bottle Market Revenue Million Forecast, by Geography 2019 & 2032
- Table 23: Global MEA Soft Drink Plastic Bottle Market Revenue Million Forecast, by Country 2019 & 2032
- Table 24: Global MEA Soft Drink Plastic Bottle Market Revenue Million Forecast, by Raw Materials 2019 & 2032
- Table 25: Global MEA Soft Drink Plastic Bottle Market Revenue Million Forecast, by End-user Vertical 2019 & 2032
- Table 26: Global MEA Soft Drink Plastic Bottle Market Revenue Million Forecast, by Geography 2019 & 2032
- Table 27: Global MEA Soft Drink Plastic Bottle Market Revenue Million Forecast, by Country 2019 & 2032
- Table 28: Global MEA Soft Drink Plastic Bottle Market Revenue Million Forecast, by Raw Materials 2019 & 2032
- Table 29: Global MEA Soft Drink Plastic Bottle Market Revenue Million Forecast, by End-user Vertical 2019 & 2032
- Table 30: Global MEA Soft Drink Plastic Bottle Market Revenue Million Forecast, by Geography 2019 & 2032
- Table 31: Global MEA Soft Drink Plastic Bottle Market Revenue Million Forecast, by Country 2019 & 2032
- Table 32: Global MEA Soft Drink Plastic Bottle Market Revenue Million Forecast, by Raw Materials 2019 & 2032
- Table 33: Global MEA Soft Drink Plastic Bottle Market Revenue Million Forecast, by End-user Vertical 2019 & 2032
- Table 34: Global MEA Soft Drink Plastic Bottle Market Revenue Million Forecast, by Geography 2019 & 2032
- Table 35: Global MEA Soft Drink Plastic Bottle Market Revenue Million Forecast, by Country 2019 & 2032
Frequently Asked Questions
1. What is the projected Compound Annual Growth Rate (CAGR) of the MEA Soft Drink Plastic Bottle Market?
The projected CAGR is approximately 5.70%.
2. Which companies are prominent players in the MEA Soft Drink Plastic Bottle Market?
Key companies in the market include Comar LLC, Plastipak Holdings Inc, Al Amana Plastic LLC, Nampak Ltd, Graham Packaging Company, Amcor PLC, Altium Packaging LLC, Takween Advanced Industries*List Not Exhaustive, Alpha Packaging, Container Corporation of Canada Ltd, Gerresheimer AG, ALPLA Group.
3. What are the main segments of the MEA Soft Drink Plastic Bottle Market?
The market segments include Raw Materials, End-user Vertical, Geography.
4. Can you provide details about the market size?
The market size is estimated to be USD XX Million as of 2022.
5. What are some drivers contributing to market growth?
Increasing Adoption of Lightweight Packaging Methods.
6. What are the notable trends driving market growth?
Food and Beverage Industry is Expected to Witness Significant Growth.
7. Are there any restraints impacting market growth?
Environmental Concerns Regarding Use of Plastics.
8. Can you provide examples of recent developments in the market?
June 2021 - Plastipak Packaging has teamed up with anaerobic digestion (AD) operator BioteCH4 to deliver a low carbon solution to power its Clean Tech PET recycling plant. Based in Hemswell, Lincolnshire, BioteCH4 operates an anaerobic digestion plant, recycling over 90,000 tonnes of food waste per year.
9. What pricing options are available for accessing the report?
Pricing options include single-user, multi-user, and enterprise licenses priced at USD 4750, USD 5250, and USD 8750 respectively.
10. Is the market size provided in terms of value or volume?
The market size is provided in terms of value, measured in Million.
11. Are there any specific market keywords associated with the report?
Yes, the market keyword associated with the report is "MEA Soft Drink Plastic Bottle Market," which aids in identifying and referencing the specific market segment covered.
12. How do I determine which pricing option suits my needs best?
The pricing options vary based on user requirements and access needs. Individual users may opt for single-user licenses, while businesses requiring broader access may choose multi-user or enterprise licenses for cost-effective access to the report.
13. Are there any additional resources or data provided in the MEA Soft Drink Plastic Bottle Market report?
While the report offers comprehensive insights, it's advisable to review the specific contents or supplementary materials provided to ascertain if additional resources or data are available.
14. How can I stay updated on further developments or reports in the MEA Soft Drink Plastic Bottle Market?
To stay informed about further developments, trends, and reports in the MEA Soft Drink Plastic Bottle Market, consider subscribing to industry newsletters, following relevant companies and organizations, or regularly checking reputable industry news sources and publications.
Methodology
Step 1 - Identification of Relevant Samples Size from Population Database


Step 2 - Approaches for Defining Global Market Size (Value, Volume* & Price*)

Note*: In applicable scenarios
Step 3 - Data Sources
Primary Research
- Web Analytics
- Survey Reports
- Research Institute
- Latest Research Reports
- Opinion Leaders
Secondary Research
- Annual Reports
- White Paper
- Latest Press Release
- Industry Association
- Paid Database
- Investor Presentations

Step 4 - Data Triangulation
Involves using different sources of information in order to increase the validity of a study
These sources are likely to be stakeholders in a program - participants, other researchers, program staff, other community members, and so on.
Then we put all data in single framework & apply various statistical tools to find out the dynamic on the market.
During the analysis stage, feedback from the stakeholder groups would be compared to determine areas of agreement as well as areas of divergence


