
Key Insights
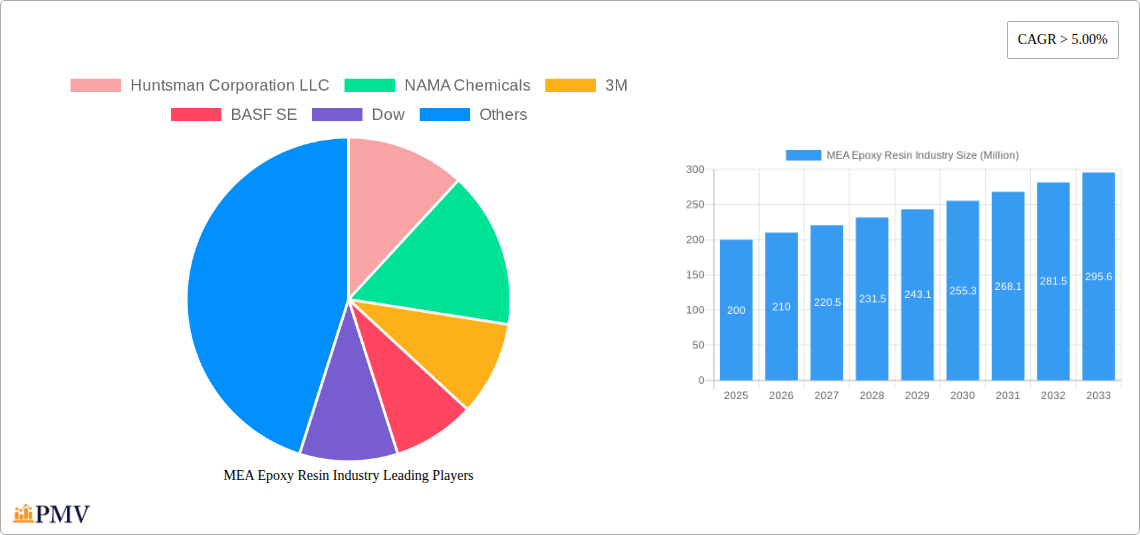
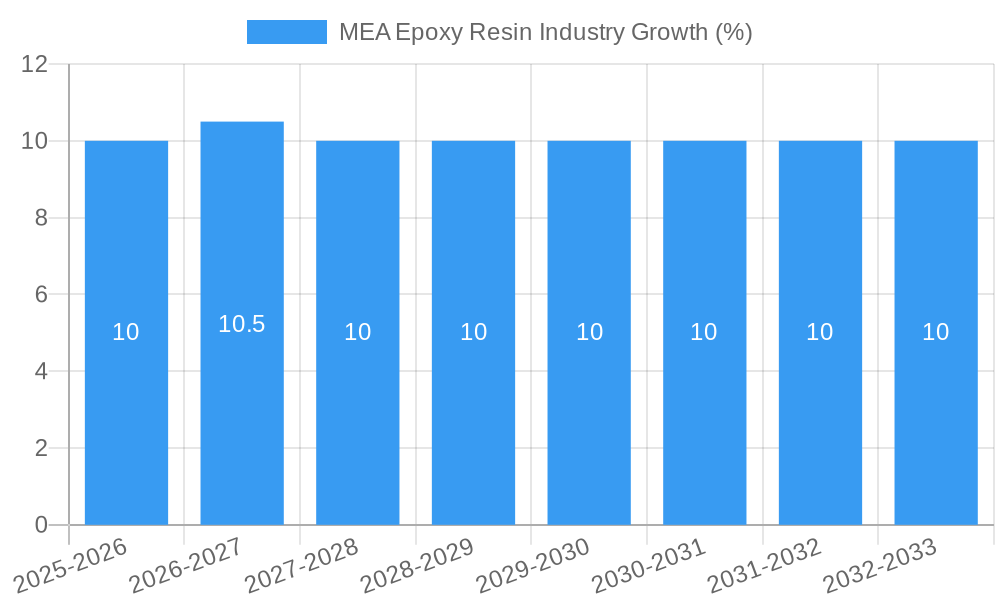
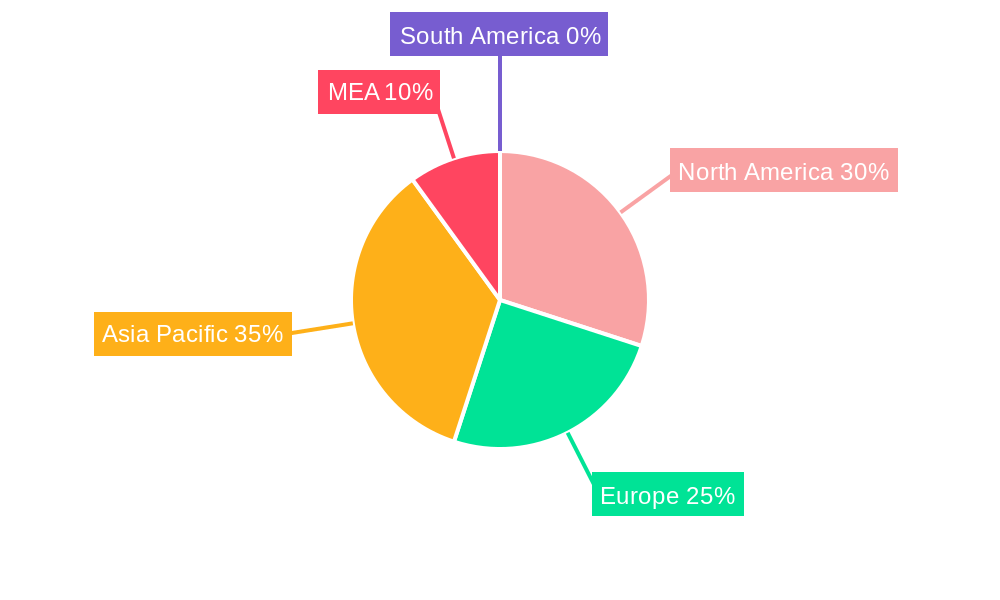
The MEA Epoxy Resin market, while smaller than its counterparts in North America or Asia-Pacific, presents a compelling growth opportunity. Driven by expanding construction and infrastructure projects, particularly in Saudi Arabia and the UAE, the demand for epoxy resins used in paints and coatings, adhesives, and composites is steadily increasing. The region's burgeoning renewable energy sector, including wind turbine manufacturing, further fuels market expansion. While a precise market size for MEA in 2025 is unavailable, considering the global CAGR of over 5% and the regional economic growth projections, a conservative estimate places the MEA epoxy resin market value at approximately $200 million in 2025. This figure is likely influenced by the relatively smaller manufacturing base in the region compared to other established markets; however, strategic investments in infrastructure and industrial development across several MEA nations indicate substantial future growth potential. The market is segmented by resin type (with Bisphenol A and F based resins dominating) and application, mirroring global trends. Challenges include volatile raw material prices, particularly for imported materials, and potential supply chain disruptions. However, opportunities lie in increased localization of manufacturing, fostering stronger partnerships with global players, and tapping into the rising demand for high-performance materials in various sectors.
The forecast period of 2025-2033 suggests continued growth, largely fueled by government initiatives promoting industrial diversification and infrastructure development. Growth will be particularly pronounced in the adhesives and composites segment, due to increased activity in the construction and automotive sectors. The penetration of epoxy resins in the wind energy sector will be a key driver, especially as more countries invest in renewable energy capacity. While competition remains concentrated among established global players, regional players could gain market share by focusing on niche applications and catering to localized demand, particularly in areas with robust infrastructure projects. Continued investment in research and development, aimed at developing sustainable and cost-effective epoxy resin formulations, is crucial for market growth and improved competitiveness.
MEA Epoxy Resin Industry: A Comprehensive Market Report (2019-2033)
This in-depth report provides a comprehensive analysis of the Middle East and Africa (MEA) epoxy resin industry, offering invaluable insights for stakeholders seeking to navigate this dynamic market. The report covers the period from 2019 to 2033, with 2025 serving as both the base and estimated year. The forecast period spans from 2025 to 2033, while the historical period encompasses 2019-2024. The MEA epoxy resin market is projected to reach xx Million by 2033, exhibiting a CAGR of xx% during the forecast period.
MEA Epoxy Resin Industry Market Structure & Competitive Dynamics
This section delves into the competitive landscape of the MEA epoxy resin market, analyzing market concentration, innovation ecosystems, regulatory frameworks, product substitutes, end-user trends, and merger & acquisition (M&A) activities. The market is moderately concentrated, with key players such as Huntsman Corporation LLC, Huntsman Corporation LLC, NAMA Chemicals, 3M, BASF SE, BASF SE, Dow, Dow, Aditya Birla Chemicals, Daicel Corporation, Hexion, Olin Corporation, and NAN YA PLASTICS CORPORATION holding significant market share. However, several smaller regional players also contribute to the market's vibrancy.
Market share dynamics are influenced by factors such as technological advancements, pricing strategies, and distribution networks. M&A activity has been moderate in recent years, with deal values averaging approximately xx Million annually. The regulatory landscape is evolving, with increasing emphasis on environmental regulations and safety standards impacting production processes and product formulations. Innovation in epoxy resin technology, driven by the need for high-performance materials in various applications, is fostering competition and market expansion. End-user trends, particularly in the construction, automotive, and renewable energy sectors, significantly influence demand for specific types of epoxy resins. The substitution of epoxy resins by alternative materials is limited due to their unique properties, but the development of bio-based epoxy resins presents a potential long-term challenge.
MEA Epoxy Resin Industry Industry Trends & Insights
This section analyzes the key trends shaping the MEA epoxy resin market. The market's growth is primarily driven by robust infrastructure development across the region, particularly in the construction and transportation sectors, along with the expansion of renewable energy initiatives (especially wind turbines). Technological advancements in epoxy resin formulations, leading to improved performance characteristics and sustainability, are also fueling market growth. Consumer preferences are shifting towards high-performance, eco-friendly epoxy resins, creating opportunities for manufacturers offering sustainable solutions. However, fluctuating raw material prices and economic uncertainties pose challenges to the market’s growth trajectory. The increasing demand for lightweight and high-strength materials in various industries is a significant factor driving market expansion, with a projected growth rate exceeding the global average. The market penetration of advanced epoxy resin types like DGBEF and Novolac is expected to increase significantly over the forecast period, fueled by advancements in applications such as wind turbine blades and high-performance composites.
Dominant Markets & Segments in MEA Epoxy Resin Industry
This section highlights the dominant segments and regions within the MEA epoxy resin market.
Dominant Regions: The largest markets are concentrated in the GCC countries (e.g., Saudi Arabia, UAE) and North Africa (e.g., Egypt, Morocco), driven by significant investments in infrastructure projects.
Dominant Raw Material Types: DGBEA (Bisphenol A and ECH) currently holds the largest market share due to its cost-effectiveness and widespread applicability. However, the demand for DGBEF and Novolac epoxy resins is growing rapidly, driven by their superior performance characteristics in specialized applications.
Dominant Applications: Paints and coatings currently dominate the application segment, owing to the extensive use of epoxy resins in protective coatings for infrastructure and industrial equipment. However, the adhesives and composites segments are witnessing significant growth due to the expanding construction and automotive sectors.
Key Drivers:
- Infrastructure Development: Significant government investments in infrastructure projects across the MEA region are a primary driver of market growth.
- Renewable Energy Expansion: The increasing adoption of renewable energy technologies, such as wind turbines and solar panels, is boosting demand for high-performance epoxy resins.
- Economic Growth: Steady economic growth in several MEA countries is driving demand across various end-use sectors.
MEA Epoxy Resin Industry Product Innovations
Recent years have witnessed significant product innovations in the MEA epoxy resin industry, focusing on improving performance characteristics, enhancing sustainability, and expanding applications. New formulations offer improved thermal stability, chemical resistance, and mechanical strength, catering to the demands of diverse industries. The development of bio-based epoxy resins, incorporating renewable resources, addresses sustainability concerns and opens up new market opportunities. These innovations enhance the competitiveness of MEA-based epoxy resin manufacturers in both regional and global markets.
Report Segmentation & Scope
This report comprehensively segments the MEA epoxy resin market by raw material type and application.
Raw Material Type: DGBEA (Bisphenol A and ECH), DGBEF (Bisphenol F and ECH), Novolac Epoxy (Formaldehyde and Phenols), Aliphatic Epoxy Resins (Aliphatic Alcohols), Glycidylamine Epoxy Resins (Aromatic Amines and ECH), Other Raw Material Types. Each segment's market size, growth projection, and competitive dynamics are analyzed.
Application: Paints and Coatings, Adhesives, Composites, Electrical and Electronics, Wind Turbines, Other Applications. Similar detailed analysis is provided for each application segment.
Key Drivers of MEA Epoxy Resin Industry Growth
The MEA epoxy resin industry's growth is driven by several factors: robust infrastructure development across the region, expanding industrialization, increasing demand for high-performance materials in various sectors (e.g., automotive, aerospace, construction), and government initiatives supporting renewable energy adoption. Technological advancements resulting in improved epoxy resin properties, such as enhanced durability and sustainability, further contribute to market expansion.
Challenges in the MEA Epoxy Resin Industry Sector
The MEA epoxy resin industry faces several challenges, including volatile raw material prices, potential supply chain disruptions, and intense competition from both regional and international players. Stringent environmental regulations and safety standards also present hurdles for manufacturers. Furthermore, fluctuations in regional economies can impact demand, creating uncertainties for market growth.
Leading Players in the MEA Epoxy Resin Industry Market
- Huntsman Corporation LLC
- NAMA Chemicals
- 3M
- BASF SE
- Dow
- Aditya Birla Chemicals
- Daicel Corporation
- Hexion
- Olin Corporation
- NAN YA PLASTICS CORPORATION
Key Developments in MEA Epoxy Resin Industry Sector
- 2022 Q4: BASF SE announced a new epoxy resin production facility in the UAE, expanding its regional presence.
- 2023 Q1: Huntsman Corporation LLC launched a new line of high-performance epoxy resins targeting the wind energy sector. (Further developments to be added as available)
Strategic MEA Epoxy Resin Industry Market Outlook
The MEA epoxy resin market holds significant future potential, driven by sustained infrastructure development, industrial expansion, and growing demand for advanced materials across various sectors. Strategic opportunities exist for companies focusing on sustainable and high-performance epoxy resin solutions. Capitalizing on regional growth and technological advancements will be crucial for success in this competitive market.
MEA Epoxy Resin Industry Segmentation
-
1. Raw Material Type
- 1.1. DGBEA (Bisphenol A and ECH)
- 1.2. DGBEF (Bisphenol F and ECH)
- 1.3. Novolac Epoxy (Formaldehyde and Phenols)
- 1.4. Aliphatic Epoxy Resins (Aliphatic Alcohols)
- 1.5. Glycidyl
- 1.6. Other Raw Material Types
-
2. Application
- 2.1. Paints and Coatings
- 2.2. Adhesives
- 2.3. Composites
- 2.4. Electrical and Electronics
- 2.5. Wind Turbines
- 2.6. Other Applications
-
3. Geography
- 3.1. Saudi Arabia
- 3.2. South Africa
- 3.3. Nigeria
- 3.4. Kuwait
- 3.5. United Arab Emirates
- 3.6. Rest of Middle-East and Africa
MEA Epoxy Resin Industry Segmentation By Geography
- 1. Saudi Arabia
- 2. South Africa
- 3. Nigeria
- 4. Kuwait
- 5. United Arab Emirates
- 6. Rest of Middle East and Africa
MEA Epoxy Resin Industry REPORT HIGHLIGHTS
| Aspects | Details |
|---|---|
| Study Period | 2019-2033 |
| Base Year | 2024 |
| Estimated Year | 2025 |
| Forecast Period | 2025-2033 |
| Historical Period | 2019-2024 |
| Growth Rate | CAGR of > 5.00% from 2019-2033 |
| Segmentation |
|
Table of Contents
- 1. Introduction
- 1.1. Research Scope
- 1.2. Market Segmentation
- 1.3. Research Methodology
- 1.4. Definitions and Assumptions
- 2. Executive Summary
- 2.1. Introduction
- 3. Market Dynamics
- 3.1. Introduction
- 3.2. Market Drivers
- 3.2.1. ; Strong Growth of Construction Industry in Middle East & Africa; Rising Demand for Electrical and Electronic Devices
- 3.3. Market Restrains
- 3.3.1. ; Hazardous Impact of Epoxy on Health
- 3.4. Market Trends
- 3.4.1. Increasing Demand from Composites
- 4. Market Factor Analysis
- 4.1. Porters Five Forces
- 4.2. Supply/Value Chain
- 4.3. PESTEL analysis
- 4.4. Market Entropy
- 4.5. Patent/Trademark Analysis
- 5. Global MEA Epoxy Resin Industry Analysis, Insights and Forecast, 2019-2031
- 5.1. Market Analysis, Insights and Forecast - by Raw Material Type
- 5.1.1. DGBEA (Bisphenol A and ECH)
- 5.1.2. DGBEF (Bisphenol F and ECH)
- 5.1.3. Novolac Epoxy (Formaldehyde and Phenols)
- 5.1.4. Aliphatic Epoxy Resins (Aliphatic Alcohols)
- 5.1.5. Glycidyl
- 5.1.6. Other Raw Material Types
- 5.2. Market Analysis, Insights and Forecast - by Application
- 5.2.1. Paints and Coatings
- 5.2.2. Adhesives
- 5.2.3. Composites
- 5.2.4. Electrical and Electronics
- 5.2.5. Wind Turbines
- 5.2.6. Other Applications
- 5.3. Market Analysis, Insights and Forecast - by Geography
- 5.3.1. Saudi Arabia
- 5.3.2. South Africa
- 5.3.3. Nigeria
- 5.3.4. Kuwait
- 5.3.5. United Arab Emirates
- 5.3.6. Rest of Middle-East and Africa
- 5.4. Market Analysis, Insights and Forecast - by Region
- 5.4.1. Saudi Arabia
- 5.4.2. South Africa
- 5.4.3. Nigeria
- 5.4.4. Kuwait
- 5.4.5. United Arab Emirates
- 5.4.6. Rest of Middle East and Africa
- 5.1. Market Analysis, Insights and Forecast - by Raw Material Type
- 6. Saudi Arabia MEA Epoxy Resin Industry Analysis, Insights and Forecast, 2019-2031
- 6.1. Market Analysis, Insights and Forecast - by Raw Material Type
- 6.1.1. DGBEA (Bisphenol A and ECH)
- 6.1.2. DGBEF (Bisphenol F and ECH)
- 6.1.3. Novolac Epoxy (Formaldehyde and Phenols)
- 6.1.4. Aliphatic Epoxy Resins (Aliphatic Alcohols)
- 6.1.5. Glycidyl
- 6.1.6. Other Raw Material Types
- 6.2. Market Analysis, Insights and Forecast - by Application
- 6.2.1. Paints and Coatings
- 6.2.2. Adhesives
- 6.2.3. Composites
- 6.2.4. Electrical and Electronics
- 6.2.5. Wind Turbines
- 6.2.6. Other Applications
- 6.3. Market Analysis, Insights and Forecast - by Geography
- 6.3.1. Saudi Arabia
- 6.3.2. South Africa
- 6.3.3. Nigeria
- 6.3.4. Kuwait
- 6.3.5. United Arab Emirates
- 6.3.6. Rest of Middle-East and Africa
- 6.1. Market Analysis, Insights and Forecast - by Raw Material Type
- 7. South Africa MEA Epoxy Resin Industry Analysis, Insights and Forecast, 2019-2031
- 7.1. Market Analysis, Insights and Forecast - by Raw Material Type
- 7.1.1. DGBEA (Bisphenol A and ECH)
- 7.1.2. DGBEF (Bisphenol F and ECH)
- 7.1.3. Novolac Epoxy (Formaldehyde and Phenols)
- 7.1.4. Aliphatic Epoxy Resins (Aliphatic Alcohols)
- 7.1.5. Glycidyl
- 7.1.6. Other Raw Material Types
- 7.2. Market Analysis, Insights and Forecast - by Application
- 7.2.1. Paints and Coatings
- 7.2.2. Adhesives
- 7.2.3. Composites
- 7.2.4. Electrical and Electronics
- 7.2.5. Wind Turbines
- 7.2.6. Other Applications
- 7.3. Market Analysis, Insights and Forecast - by Geography
- 7.3.1. Saudi Arabia
- 7.3.2. South Africa
- 7.3.3. Nigeria
- 7.3.4. Kuwait
- 7.3.5. United Arab Emirates
- 7.3.6. Rest of Middle-East and Africa
- 7.1. Market Analysis, Insights and Forecast - by Raw Material Type
- 8. Nigeria MEA Epoxy Resin Industry Analysis, Insights and Forecast, 2019-2031
- 8.1. Market Analysis, Insights and Forecast - by Raw Material Type
- 8.1.1. DGBEA (Bisphenol A and ECH)
- 8.1.2. DGBEF (Bisphenol F and ECH)
- 8.1.3. Novolac Epoxy (Formaldehyde and Phenols)
- 8.1.4. Aliphatic Epoxy Resins (Aliphatic Alcohols)
- 8.1.5. Glycidyl
- 8.1.6. Other Raw Material Types
- 8.2. Market Analysis, Insights and Forecast - by Application
- 8.2.1. Paints and Coatings
- 8.2.2. Adhesives
- 8.2.3. Composites
- 8.2.4. Electrical and Electronics
- 8.2.5. Wind Turbines
- 8.2.6. Other Applications
- 8.3. Market Analysis, Insights and Forecast - by Geography
- 8.3.1. Saudi Arabia
- 8.3.2. South Africa
- 8.3.3. Nigeria
- 8.3.4. Kuwait
- 8.3.5. United Arab Emirates
- 8.3.6. Rest of Middle-East and Africa
- 8.1. Market Analysis, Insights and Forecast - by Raw Material Type
- 9. Kuwait MEA Epoxy Resin Industry Analysis, Insights and Forecast, 2019-2031
- 9.1. Market Analysis, Insights and Forecast - by Raw Material Type
- 9.1.1. DGBEA (Bisphenol A and ECH)
- 9.1.2. DGBEF (Bisphenol F and ECH)
- 9.1.3. Novolac Epoxy (Formaldehyde and Phenols)
- 9.1.4. Aliphatic Epoxy Resins (Aliphatic Alcohols)
- 9.1.5. Glycidyl
- 9.1.6. Other Raw Material Types
- 9.2. Market Analysis, Insights and Forecast - by Application
- 9.2.1. Paints and Coatings
- 9.2.2. Adhesives
- 9.2.3. Composites
- 9.2.4. Electrical and Electronics
- 9.2.5. Wind Turbines
- 9.2.6. Other Applications
- 9.3. Market Analysis, Insights and Forecast - by Geography
- 9.3.1. Saudi Arabia
- 9.3.2. South Africa
- 9.3.3. Nigeria
- 9.3.4. Kuwait
- 9.3.5. United Arab Emirates
- 9.3.6. Rest of Middle-East and Africa
- 9.1. Market Analysis, Insights and Forecast - by Raw Material Type
- 10. United Arab Emirates MEA Epoxy Resin Industry Analysis, Insights and Forecast, 2019-2031
- 10.1. Market Analysis, Insights and Forecast - by Raw Material Type
- 10.1.1. DGBEA (Bisphenol A and ECH)
- 10.1.2. DGBEF (Bisphenol F and ECH)
- 10.1.3. Novolac Epoxy (Formaldehyde and Phenols)
- 10.1.4. Aliphatic Epoxy Resins (Aliphatic Alcohols)
- 10.1.5. Glycidyl
- 10.1.6. Other Raw Material Types
- 10.2. Market Analysis, Insights and Forecast - by Application
- 10.2.1. Paints and Coatings
- 10.2.2. Adhesives
- 10.2.3. Composites
- 10.2.4. Electrical and Electronics
- 10.2.5. Wind Turbines
- 10.2.6. Other Applications
- 10.3. Market Analysis, Insights and Forecast - by Geography
- 10.3.1. Saudi Arabia
- 10.3.2. South Africa
- 10.3.3. Nigeria
- 10.3.4. Kuwait
- 10.3.5. United Arab Emirates
- 10.3.6. Rest of Middle-East and Africa
- 10.1. Market Analysis, Insights and Forecast - by Raw Material Type
- 11. Rest of Middle East and Africa MEA Epoxy Resin Industry Analysis, Insights and Forecast, 2019-2031
- 11.1. Market Analysis, Insights and Forecast - by Raw Material Type
- 11.1.1. DGBEA (Bisphenol A and ECH)
- 11.1.2. DGBEF (Bisphenol F and ECH)
- 11.1.3. Novolac Epoxy (Formaldehyde and Phenols)
- 11.1.4. Aliphatic Epoxy Resins (Aliphatic Alcohols)
- 11.1.5. Glycidyl
- 11.1.6. Other Raw Material Types
- 11.2. Market Analysis, Insights and Forecast - by Application
- 11.2.1. Paints and Coatings
- 11.2.2. Adhesives
- 11.2.3. Composites
- 11.2.4. Electrical and Electronics
- 11.2.5. Wind Turbines
- 11.2.6. Other Applications
- 11.3. Market Analysis, Insights and Forecast - by Geography
- 11.3.1. Saudi Arabia
- 11.3.2. South Africa
- 11.3.3. Nigeria
- 11.3.4. Kuwait
- 11.3.5. United Arab Emirates
- 11.3.6. Rest of Middle-East and Africa
- 11.1. Market Analysis, Insights and Forecast - by Raw Material Type
- 12. North America MEA Epoxy Resin Industry Analysis, Insights and Forecast, 2019-2031
- 12.1. Market Analysis, Insights and Forecast - By Country/Sub-region
- 12.1.1 United States
- 12.1.2 Canada
- 12.1.3 Mexico
- 13. Europe MEA Epoxy Resin Industry Analysis, Insights and Forecast, 2019-2031
- 13.1. Market Analysis, Insights and Forecast - By Country/Sub-region
- 13.1.1 Germany
- 13.1.2 United Kingdom
- 13.1.3 France
- 13.1.4 Spain
- 13.1.5 Italy
- 13.1.6 Spain
- 13.1.7 Belgium
- 13.1.8 Netherland
- 13.1.9 Nordics
- 13.1.10 Rest of Europe
- 14. Asia Pacific MEA Epoxy Resin Industry Analysis, Insights and Forecast, 2019-2031
- 14.1. Market Analysis, Insights and Forecast - By Country/Sub-region
- 14.1.1 China
- 14.1.2 Japan
- 14.1.3 India
- 14.1.4 South Korea
- 14.1.5 Southeast Asia
- 14.1.6 Australia
- 14.1.7 Indonesia
- 14.1.8 Phillipes
- 14.1.9 Singapore
- 14.1.10 Thailandc
- 14.1.11 Rest of Asia Pacific
- 15. South America MEA Epoxy Resin Industry Analysis, Insights and Forecast, 2019-2031
- 15.1. Market Analysis, Insights and Forecast - By Country/Sub-region
- 15.1.1 Brazil
- 15.1.2 Argentina
- 15.1.3 Peru
- 15.1.4 Chile
- 15.1.5 Colombia
- 15.1.6 Ecuador
- 15.1.7 Venezuela
- 15.1.8 Rest of South America
- 16. North America MEA Epoxy Resin Industry Analysis, Insights and Forecast, 2019-2031
- 16.1. Market Analysis, Insights and Forecast - By Country/Sub-region
- 16.1.1 United States
- 16.1.2 Canada
- 16.1.3 Mexico
- 17. MEA MEA Epoxy Resin Industry Analysis, Insights and Forecast, 2019-2031
- 17.1. Market Analysis, Insights and Forecast - By Country/Sub-region
- 17.1.1 United Arab Emirates
- 17.1.2 Saudi Arabia
- 17.1.3 South Africa
- 17.1.4 Rest of Middle East and Africa
- 18. Competitive Analysis
- 18.1. Global Market Share Analysis 2024
- 18.2. Company Profiles
- 18.2.1 Huntsman Corporation LLC
- 18.2.1.1. Overview
- 18.2.1.2. Products
- 18.2.1.3. SWOT Analysis
- 18.2.1.4. Recent Developments
- 18.2.1.5. Financials (Based on Availability)
- 18.2.2 NAMA Chemicals
- 18.2.2.1. Overview
- 18.2.2.2. Products
- 18.2.2.3. SWOT Analysis
- 18.2.2.4. Recent Developments
- 18.2.2.5. Financials (Based on Availability)
- 18.2.3 3M
- 18.2.3.1. Overview
- 18.2.3.2. Products
- 18.2.3.3. SWOT Analysis
- 18.2.3.4. Recent Developments
- 18.2.3.5. Financials (Based on Availability)
- 18.2.4 BASF SE
- 18.2.4.1. Overview
- 18.2.4.2. Products
- 18.2.4.3. SWOT Analysis
- 18.2.4.4. Recent Developments
- 18.2.4.5. Financials (Based on Availability)
- 18.2.5 Dow
- 18.2.5.1. Overview
- 18.2.5.2. Products
- 18.2.5.3. SWOT Analysis
- 18.2.5.4. Recent Developments
- 18.2.5.5. Financials (Based on Availability)
- 18.2.6 Aditya Birla Chemicals
- 18.2.6.1. Overview
- 18.2.6.2. Products
- 18.2.6.3. SWOT Analysis
- 18.2.6.4. Recent Developments
- 18.2.6.5. Financials (Based on Availability)
- 18.2.7 Daicel Corporation
- 18.2.7.1. Overview
- 18.2.7.2. Products
- 18.2.7.3. SWOT Analysis
- 18.2.7.4. Recent Developments
- 18.2.7.5. Financials (Based on Availability)
- 18.2.8 Hexion
- 18.2.8.1. Overview
- 18.2.8.2. Products
- 18.2.8.3. SWOT Analysis
- 18.2.8.4. Recent Developments
- 18.2.8.5. Financials (Based on Availability)
- 18.2.9 Olin Corporation*List Not Exhaustive
- 18.2.9.1. Overview
- 18.2.9.2. Products
- 18.2.9.3. SWOT Analysis
- 18.2.9.4. Recent Developments
- 18.2.9.5. Financials (Based on Availability)
- 18.2.10 NAN YA PLASTICS CORPORATION
- 18.2.10.1. Overview
- 18.2.10.2. Products
- 18.2.10.3. SWOT Analysis
- 18.2.10.4. Recent Developments
- 18.2.10.5. Financials (Based on Availability)
- 18.2.1 Huntsman Corporation LLC
List of Figures
- Figure 1: Global MEA Epoxy Resin Industry Revenue Breakdown (Million, %) by Region 2024 & 2032
- Figure 2: North America MEA Epoxy Resin Industry Revenue (Million), by Country 2024 & 2032
- Figure 3: North America MEA Epoxy Resin Industry Revenue Share (%), by Country 2024 & 2032
- Figure 4: Europe MEA Epoxy Resin Industry Revenue (Million), by Country 2024 & 2032
- Figure 5: Europe MEA Epoxy Resin Industry Revenue Share (%), by Country 2024 & 2032
- Figure 6: Asia Pacific MEA Epoxy Resin Industry Revenue (Million), by Country 2024 & 2032
- Figure 7: Asia Pacific MEA Epoxy Resin Industry Revenue Share (%), by Country 2024 & 2032
- Figure 8: South America MEA Epoxy Resin Industry Revenue (Million), by Country 2024 & 2032
- Figure 9: South America MEA Epoxy Resin Industry Revenue Share (%), by Country 2024 & 2032
- Figure 10: North America MEA Epoxy Resin Industry Revenue (Million), by Country 2024 & 2032
- Figure 11: North America MEA Epoxy Resin Industry Revenue Share (%), by Country 2024 & 2032
- Figure 12: MEA MEA Epoxy Resin Industry Revenue (Million), by Country 2024 & 2032
- Figure 13: MEA MEA Epoxy Resin Industry Revenue Share (%), by Country 2024 & 2032
- Figure 14: Saudi Arabia MEA Epoxy Resin Industry Revenue (Million), by Raw Material Type 2024 & 2032
- Figure 15: Saudi Arabia MEA Epoxy Resin Industry Revenue Share (%), by Raw Material Type 2024 & 2032
- Figure 16: Saudi Arabia MEA Epoxy Resin Industry Revenue (Million), by Application 2024 & 2032
- Figure 17: Saudi Arabia MEA Epoxy Resin Industry Revenue Share (%), by Application 2024 & 2032
- Figure 18: Saudi Arabia MEA Epoxy Resin Industry Revenue (Million), by Geography 2024 & 2032
- Figure 19: Saudi Arabia MEA Epoxy Resin Industry Revenue Share (%), by Geography 2024 & 2032
- Figure 20: Saudi Arabia MEA Epoxy Resin Industry Revenue (Million), by Country 2024 & 2032
- Figure 21: Saudi Arabia MEA Epoxy Resin Industry Revenue Share (%), by Country 2024 & 2032
- Figure 22: South Africa MEA Epoxy Resin Industry Revenue (Million), by Raw Material Type 2024 & 2032
- Figure 23: South Africa MEA Epoxy Resin Industry Revenue Share (%), by Raw Material Type 2024 & 2032
- Figure 24: South Africa MEA Epoxy Resin Industry Revenue (Million), by Application 2024 & 2032
- Figure 25: South Africa MEA Epoxy Resin Industry Revenue Share (%), by Application 2024 & 2032
- Figure 26: South Africa MEA Epoxy Resin Industry Revenue (Million), by Geography 2024 & 2032
- Figure 27: South Africa MEA Epoxy Resin Industry Revenue Share (%), by Geography 2024 & 2032
- Figure 28: South Africa MEA Epoxy Resin Industry Revenue (Million), by Country 2024 & 2032
- Figure 29: South Africa MEA Epoxy Resin Industry Revenue Share (%), by Country 2024 & 2032
- Figure 30: Nigeria MEA Epoxy Resin Industry Revenue (Million), by Raw Material Type 2024 & 2032
- Figure 31: Nigeria MEA Epoxy Resin Industry Revenue Share (%), by Raw Material Type 2024 & 2032
- Figure 32: Nigeria MEA Epoxy Resin Industry Revenue (Million), by Application 2024 & 2032
- Figure 33: Nigeria MEA Epoxy Resin Industry Revenue Share (%), by Application 2024 & 2032
- Figure 34: Nigeria MEA Epoxy Resin Industry Revenue (Million), by Geography 2024 & 2032
- Figure 35: Nigeria MEA Epoxy Resin Industry Revenue Share (%), by Geography 2024 & 2032
- Figure 36: Nigeria MEA Epoxy Resin Industry Revenue (Million), by Country 2024 & 2032
- Figure 37: Nigeria MEA Epoxy Resin Industry Revenue Share (%), by Country 2024 & 2032
- Figure 38: Kuwait MEA Epoxy Resin Industry Revenue (Million), by Raw Material Type 2024 & 2032
- Figure 39: Kuwait MEA Epoxy Resin Industry Revenue Share (%), by Raw Material Type 2024 & 2032
- Figure 40: Kuwait MEA Epoxy Resin Industry Revenue (Million), by Application 2024 & 2032
- Figure 41: Kuwait MEA Epoxy Resin Industry Revenue Share (%), by Application 2024 & 2032
- Figure 42: Kuwait MEA Epoxy Resin Industry Revenue (Million), by Geography 2024 & 2032
- Figure 43: Kuwait MEA Epoxy Resin Industry Revenue Share (%), by Geography 2024 & 2032
- Figure 44: Kuwait MEA Epoxy Resin Industry Revenue (Million), by Country 2024 & 2032
- Figure 45: Kuwait MEA Epoxy Resin Industry Revenue Share (%), by Country 2024 & 2032
- Figure 46: United Arab Emirates MEA Epoxy Resin Industry Revenue (Million), by Raw Material Type 2024 & 2032
- Figure 47: United Arab Emirates MEA Epoxy Resin Industry Revenue Share (%), by Raw Material Type 2024 & 2032
- Figure 48: United Arab Emirates MEA Epoxy Resin Industry Revenue (Million), by Application 2024 & 2032
- Figure 49: United Arab Emirates MEA Epoxy Resin Industry Revenue Share (%), by Application 2024 & 2032
- Figure 50: United Arab Emirates MEA Epoxy Resin Industry Revenue (Million), by Geography 2024 & 2032
- Figure 51: United Arab Emirates MEA Epoxy Resin Industry Revenue Share (%), by Geography 2024 & 2032
- Figure 52: United Arab Emirates MEA Epoxy Resin Industry Revenue (Million), by Country 2024 & 2032
- Figure 53: United Arab Emirates MEA Epoxy Resin Industry Revenue Share (%), by Country 2024 & 2032
- Figure 54: Rest of Middle East and Africa MEA Epoxy Resin Industry Revenue (Million), by Raw Material Type 2024 & 2032
- Figure 55: Rest of Middle East and Africa MEA Epoxy Resin Industry Revenue Share (%), by Raw Material Type 2024 & 2032
- Figure 56: Rest of Middle East and Africa MEA Epoxy Resin Industry Revenue (Million), by Application 2024 & 2032
- Figure 57: Rest of Middle East and Africa MEA Epoxy Resin Industry Revenue Share (%), by Application 2024 & 2032
- Figure 58: Rest of Middle East and Africa MEA Epoxy Resin Industry Revenue (Million), by Geography 2024 & 2032
- Figure 59: Rest of Middle East and Africa MEA Epoxy Resin Industry Revenue Share (%), by Geography 2024 & 2032
- Figure 60: Rest of Middle East and Africa MEA Epoxy Resin Industry Revenue (Million), by Country 2024 & 2032
- Figure 61: Rest of Middle East and Africa MEA Epoxy Resin Industry Revenue Share (%), by Country 2024 & 2032
List of Tables
- Table 1: Global MEA Epoxy Resin Industry Revenue Million Forecast, by Region 2019 & 2032
- Table 2: Global MEA Epoxy Resin Industry Revenue Million Forecast, by Raw Material Type 2019 & 2032
- Table 3: Global MEA Epoxy Resin Industry Revenue Million Forecast, by Application 2019 & 2032
- Table 4: Global MEA Epoxy Resin Industry Revenue Million Forecast, by Geography 2019 & 2032
- Table 5: Global MEA Epoxy Resin Industry Revenue Million Forecast, by Region 2019 & 2032
- Table 6: Global MEA Epoxy Resin Industry Revenue Million Forecast, by Country 2019 & 2032
- Table 7: United States MEA Epoxy Resin Industry Revenue (Million) Forecast, by Application 2019 & 2032
- Table 8: Canada MEA Epoxy Resin Industry Revenue (Million) Forecast, by Application 2019 & 2032
- Table 9: Mexico MEA Epoxy Resin Industry Revenue (Million) Forecast, by Application 2019 & 2032
- Table 10: Global MEA Epoxy Resin Industry Revenue Million Forecast, by Country 2019 & 2032
- Table 11: Germany MEA Epoxy Resin Industry Revenue (Million) Forecast, by Application 2019 & 2032
- Table 12: United Kingdom MEA Epoxy Resin Industry Revenue (Million) Forecast, by Application 2019 & 2032
- Table 13: France MEA Epoxy Resin Industry Revenue (Million) Forecast, by Application 2019 & 2032
- Table 14: Spain MEA Epoxy Resin Industry Revenue (Million) Forecast, by Application 2019 & 2032
- Table 15: Italy MEA Epoxy Resin Industry Revenue (Million) Forecast, by Application 2019 & 2032
- Table 16: Spain MEA Epoxy Resin Industry Revenue (Million) Forecast, by Application 2019 & 2032
- Table 17: Belgium MEA Epoxy Resin Industry Revenue (Million) Forecast, by Application 2019 & 2032
- Table 18: Netherland MEA Epoxy Resin Industry Revenue (Million) Forecast, by Application 2019 & 2032
- Table 19: Nordics MEA Epoxy Resin Industry Revenue (Million) Forecast, by Application 2019 & 2032
- Table 20: Rest of Europe MEA Epoxy Resin Industry Revenue (Million) Forecast, by Application 2019 & 2032
- Table 21: Global MEA Epoxy Resin Industry Revenue Million Forecast, by Country 2019 & 2032
- Table 22: China MEA Epoxy Resin Industry Revenue (Million) Forecast, by Application 2019 & 2032
- Table 23: Japan MEA Epoxy Resin Industry Revenue (Million) Forecast, by Application 2019 & 2032
- Table 24: India MEA Epoxy Resin Industry Revenue (Million) Forecast, by Application 2019 & 2032
- Table 25: South Korea MEA Epoxy Resin Industry Revenue (Million) Forecast, by Application 2019 & 2032
- Table 26: Southeast Asia MEA Epoxy Resin Industry Revenue (Million) Forecast, by Application 2019 & 2032
- Table 27: Australia MEA Epoxy Resin Industry Revenue (Million) Forecast, by Application 2019 & 2032
- Table 28: Indonesia MEA Epoxy Resin Industry Revenue (Million) Forecast, by Application 2019 & 2032
- Table 29: Phillipes MEA Epoxy Resin Industry Revenue (Million) Forecast, by Application 2019 & 2032
- Table 30: Singapore MEA Epoxy Resin Industry Revenue (Million) Forecast, by Application 2019 & 2032
- Table 31: Thailandc MEA Epoxy Resin Industry Revenue (Million) Forecast, by Application 2019 & 2032
- Table 32: Rest of Asia Pacific MEA Epoxy Resin Industry Revenue (Million) Forecast, by Application 2019 & 2032
- Table 33: Global MEA Epoxy Resin Industry Revenue Million Forecast, by Country 2019 & 2032
- Table 34: Brazil MEA Epoxy Resin Industry Revenue (Million) Forecast, by Application 2019 & 2032
- Table 35: Argentina MEA Epoxy Resin Industry Revenue (Million) Forecast, by Application 2019 & 2032
- Table 36: Peru MEA Epoxy Resin Industry Revenue (Million) Forecast, by Application 2019 & 2032
- Table 37: Chile MEA Epoxy Resin Industry Revenue (Million) Forecast, by Application 2019 & 2032
- Table 38: Colombia MEA Epoxy Resin Industry Revenue (Million) Forecast, by Application 2019 & 2032
- Table 39: Ecuador MEA Epoxy Resin Industry Revenue (Million) Forecast, by Application 2019 & 2032
- Table 40: Venezuela MEA Epoxy Resin Industry Revenue (Million) Forecast, by Application 2019 & 2032
- Table 41: Rest of South America MEA Epoxy Resin Industry Revenue (Million) Forecast, by Application 2019 & 2032
- Table 42: Global MEA Epoxy Resin Industry Revenue Million Forecast, by Country 2019 & 2032
- Table 43: United States MEA Epoxy Resin Industry Revenue (Million) Forecast, by Application 2019 & 2032
- Table 44: Canada MEA Epoxy Resin Industry Revenue (Million) Forecast, by Application 2019 & 2032
- Table 45: Mexico MEA Epoxy Resin Industry Revenue (Million) Forecast, by Application 2019 & 2032
- Table 46: Global MEA Epoxy Resin Industry Revenue Million Forecast, by Country 2019 & 2032
- Table 47: United Arab Emirates MEA Epoxy Resin Industry Revenue (Million) Forecast, by Application 2019 & 2032
- Table 48: Saudi Arabia MEA Epoxy Resin Industry Revenue (Million) Forecast, by Application 2019 & 2032
- Table 49: South Africa MEA Epoxy Resin Industry Revenue (Million) Forecast, by Application 2019 & 2032
- Table 50: Rest of Middle East and Africa MEA Epoxy Resin Industry Revenue (Million) Forecast, by Application 2019 & 2032
- Table 51: Global MEA Epoxy Resin Industry Revenue Million Forecast, by Raw Material Type 2019 & 2032
- Table 52: Global MEA Epoxy Resin Industry Revenue Million Forecast, by Application 2019 & 2032
- Table 53: Global MEA Epoxy Resin Industry Revenue Million Forecast, by Geography 2019 & 2032
- Table 54: Global MEA Epoxy Resin Industry Revenue Million Forecast, by Country 2019 & 2032
- Table 55: Global MEA Epoxy Resin Industry Revenue Million Forecast, by Raw Material Type 2019 & 2032
- Table 56: Global MEA Epoxy Resin Industry Revenue Million Forecast, by Application 2019 & 2032
- Table 57: Global MEA Epoxy Resin Industry Revenue Million Forecast, by Geography 2019 & 2032
- Table 58: Global MEA Epoxy Resin Industry Revenue Million Forecast, by Country 2019 & 2032
- Table 59: Global MEA Epoxy Resin Industry Revenue Million Forecast, by Raw Material Type 2019 & 2032
- Table 60: Global MEA Epoxy Resin Industry Revenue Million Forecast, by Application 2019 & 2032
- Table 61: Global MEA Epoxy Resin Industry Revenue Million Forecast, by Geography 2019 & 2032
- Table 62: Global MEA Epoxy Resin Industry Revenue Million Forecast, by Country 2019 & 2032
- Table 63: Global MEA Epoxy Resin Industry Revenue Million Forecast, by Raw Material Type 2019 & 2032
- Table 64: Global MEA Epoxy Resin Industry Revenue Million Forecast, by Application 2019 & 2032
- Table 65: Global MEA Epoxy Resin Industry Revenue Million Forecast, by Geography 2019 & 2032
- Table 66: Global MEA Epoxy Resin Industry Revenue Million Forecast, by Country 2019 & 2032
- Table 67: Global MEA Epoxy Resin Industry Revenue Million Forecast, by Raw Material Type 2019 & 2032
- Table 68: Global MEA Epoxy Resin Industry Revenue Million Forecast, by Application 2019 & 2032
- Table 69: Global MEA Epoxy Resin Industry Revenue Million Forecast, by Geography 2019 & 2032
- Table 70: Global MEA Epoxy Resin Industry Revenue Million Forecast, by Country 2019 & 2032
- Table 71: Global MEA Epoxy Resin Industry Revenue Million Forecast, by Raw Material Type 2019 & 2032
- Table 72: Global MEA Epoxy Resin Industry Revenue Million Forecast, by Application 2019 & 2032
- Table 73: Global MEA Epoxy Resin Industry Revenue Million Forecast, by Geography 2019 & 2032
- Table 74: Global MEA Epoxy Resin Industry Revenue Million Forecast, by Country 2019 & 2032
Frequently Asked Questions
1. What is the projected Compound Annual Growth Rate (CAGR) of the MEA Epoxy Resin Industry?
The projected CAGR is approximately > 5.00%.
2. Which companies are prominent players in the MEA Epoxy Resin Industry?
Key companies in the market include Huntsman Corporation LLC, NAMA Chemicals, 3M, BASF SE, Dow, Aditya Birla Chemicals, Daicel Corporation, Hexion, Olin Corporation*List Not Exhaustive, NAN YA PLASTICS CORPORATION.
3. What are the main segments of the MEA Epoxy Resin Industry?
The market segments include Raw Material Type, Application, Geography.
4. Can you provide details about the market size?
The market size is estimated to be USD XX Million as of 2022.
5. What are some drivers contributing to market growth?
; Strong Growth of Construction Industry in Middle East & Africa; Rising Demand for Electrical and Electronic Devices.
6. What are the notable trends driving market growth?
Increasing Demand from Composites.
7. Are there any restraints impacting market growth?
; Hazardous Impact of Epoxy on Health.
8. Can you provide examples of recent developments in the market?
N/A
9. What pricing options are available for accessing the report?
Pricing options include single-user, multi-user, and enterprise licenses priced at USD 4750, USD 5250, and USD 8750 respectively.
10. Is the market size provided in terms of value or volume?
The market size is provided in terms of value, measured in Million.
11. Are there any specific market keywords associated with the report?
Yes, the market keyword associated with the report is "MEA Epoxy Resin Industry," which aids in identifying and referencing the specific market segment covered.
12. How do I determine which pricing option suits my needs best?
The pricing options vary based on user requirements and access needs. Individual users may opt for single-user licenses, while businesses requiring broader access may choose multi-user or enterprise licenses for cost-effective access to the report.
13. Are there any additional resources or data provided in the MEA Epoxy Resin Industry report?
While the report offers comprehensive insights, it's advisable to review the specific contents or supplementary materials provided to ascertain if additional resources or data are available.
14. How can I stay updated on further developments or reports in the MEA Epoxy Resin Industry?
To stay informed about further developments, trends, and reports in the MEA Epoxy Resin Industry, consider subscribing to industry newsletters, following relevant companies and organizations, or regularly checking reputable industry news sources and publications.
Methodology
Step 1 - Identification of Relevant Samples Size from Population Database


Step 2 - Approaches for Defining Global Market Size (Value, Volume* & Price*)

Note*: In applicable scenarios
Step 3 - Data Sources
Primary Research
- Web Analytics
- Survey Reports
- Research Institute
- Latest Research Reports
- Opinion Leaders
Secondary Research
- Annual Reports
- White Paper
- Latest Press Release
- Industry Association
- Paid Database
- Investor Presentations

Step 4 - Data Triangulation
Involves using different sources of information in order to increase the validity of a study
These sources are likely to be stakeholders in a program - participants, other researchers, program staff, other community members, and so on.
Then we put all data in single framework & apply various statistical tools to find out the dynamic on the market.
During the analysis stage, feedback from the stakeholder groups would be compared to determine areas of agreement as well as areas of divergence


