
Key Insights
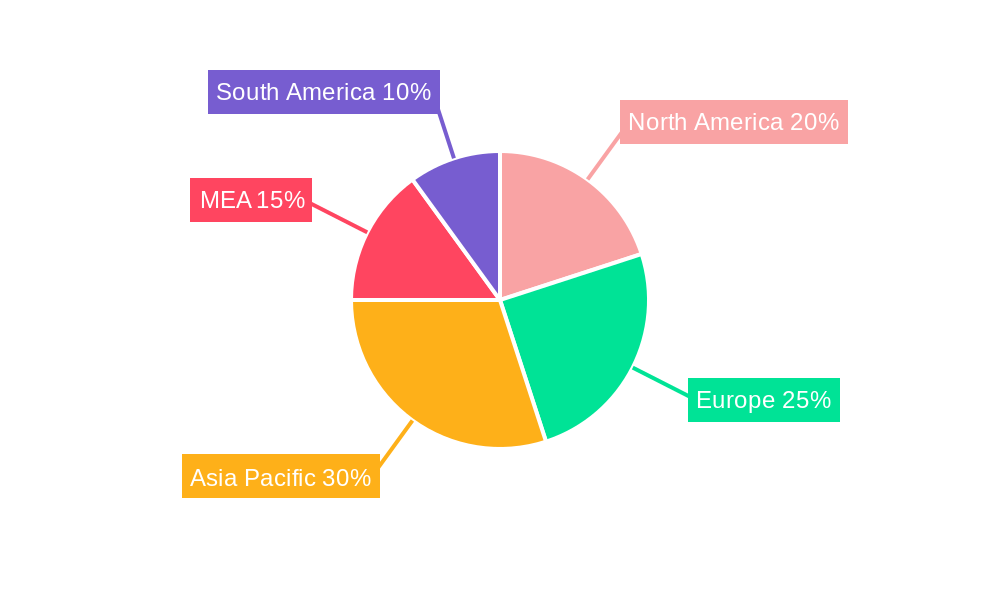
The MEA Construction Adhesives market, while smaller than mature markets in North America or Europe, exhibits significant growth potential, driven by robust infrastructure development and burgeoning construction activity across the region. A projected CAGR exceeding 4% through 2033 indicates a healthy expansion, fueled by rising urbanization, government investments in housing and infrastructure projects, and increasing adoption of modern construction techniques that rely heavily on high-performance adhesives. Key segments within the MEA market are expected to mirror global trends, with a strong preference for water-borne and reactive technologies due to their environmental benefits and superior performance characteristics. The residential sector is likely to be a major driver, supported by a growing middle class and increased disposable income leading to higher housing demand. However, challenges remain, including economic volatility in some MEA nations, potential supply chain disruptions, and a need to educate contractors and consumers on the benefits of advanced adhesive technologies. The market's growth will likely be concentrated in countries experiencing rapid economic expansion and urbanization, such as the UAE and Saudi Arabia, while other nations in the region may experience more moderate growth due to varied economic landscapes and infrastructure priorities. Competitive dynamics will see established international players vying for market share alongside regional manufacturers, leading to pricing pressures and innovation in product offerings.
The dominance of specific resin types will vary across the MEA region. While acrylics and polyurethanes are likely to maintain significant market share due to their versatility and cost-effectiveness in various applications, the demand for higher-performance, specialized adhesives (such as epoxy and silicones) in infrastructure and industrial projects is expected to contribute to overall market growth. This segment growth will further be driven by government initiatives promoting sustainable construction practices, pushing the adoption of environmentally friendly adhesives. The focus on infrastructure development across the MEA region will significantly influence the demand for high-strength, durable adhesives suitable for demanding applications such as bridge construction and high-rise buildings. Successful players in this market will need to effectively navigate the diverse regulatory environments, understand varying construction practices across countries, and build strong distribution networks to reach end-users effectively.
MEA Construction Adhesives Industry: Market Analysis & Forecast 2019-2033
This comprehensive report provides a detailed analysis of the Middle East and Africa (MEA) construction adhesives industry, offering valuable insights for businesses, investors, and stakeholders. Covering the period 2019-2033, with a focus on 2025, this study unveils market dynamics, growth drivers, and future trends. The report leverages extensive primary and secondary research to deliver actionable intelligence.
MEA Construction Adhesives Industry Market Structure & Competitive Dynamics
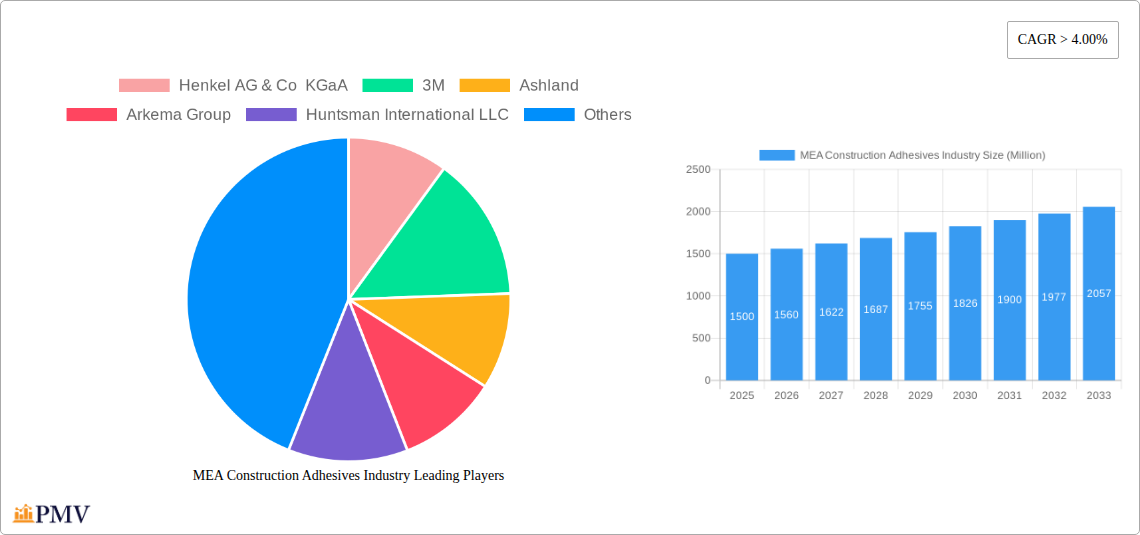
The MEA construction adhesives market is characterized by a moderately concentrated landscape, with key players like Henkel AG & Co KGaA, 3M, Ashland, Arkema Group, Huntsman International LLC, Dow, H.B. Fuller Company, Sika AG, AVERY DENNISON CORPORATION, and Wacker Chemie AG holding significant market share. However, several smaller regional players also contribute to the overall market dynamism.
Market concentration is influenced by factors such as economies of scale, technological capabilities, and brand recognition. The industry witnesses continuous innovation in resin types, application technologies, and product formulations, driving competitive differentiation. Stringent regulatory frameworks concerning environmental sustainability and product safety further shape the competitive landscape. Product substitution, particularly with eco-friendly alternatives, presents a notable challenge. End-user trends, such as the preference for faster curing times and improved adhesive performance, are also key drivers of competition.
The MEA region has seen several M&A activities in recent years, with deal values estimated at approximately xx Million USD in the period 2019-2024. These activities have primarily focused on expanding market reach, acquiring specialized technologies, and consolidating market share. The projected value of M&A deals in the forecast period (2025-2033) is estimated at xx Million USD, indicating continued consolidation within the industry.
- Market Share: The top five players collectively hold an estimated xx% of the market share in 2025.
- M&A Deal Values (2019-2024): Approximately xx Million USD.
- Projected M&A Deal Values (2025-2033): Approximately xx Million USD.
MEA Construction Adhesives Industry Industry Trends & Insights
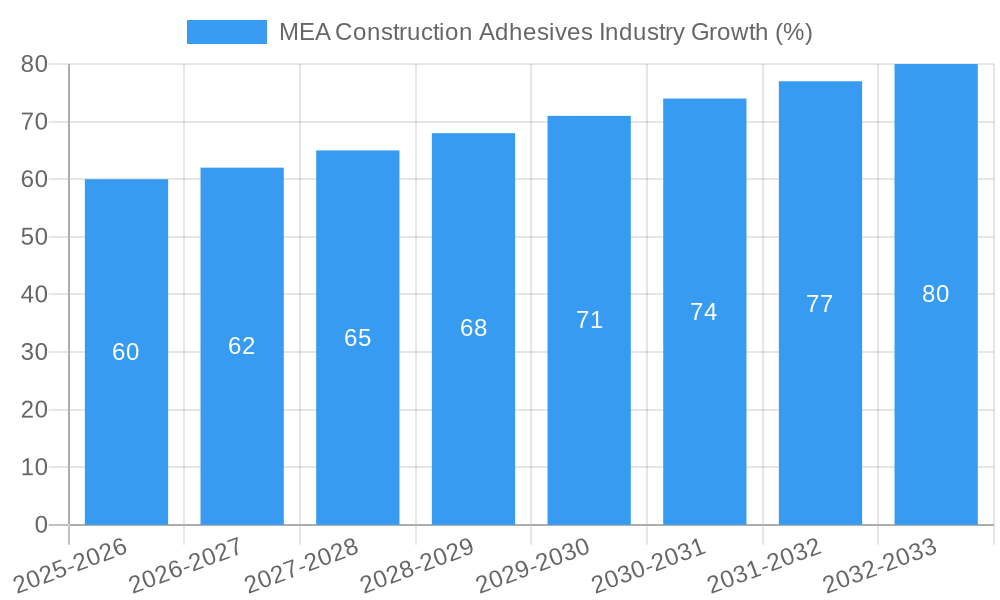
The MEA construction adhesives market exhibits robust growth potential, driven by factors such as rising infrastructure development across the region, rapid urbanization, and increasing government investments in construction projects. The market's Compound Annual Growth Rate (CAGR) during the historical period (2019-2024) was approximately xx%, and this is projected to reach xx% during the forecast period (2025-2033). The market penetration of advanced adhesive technologies, such as water-borne and reactive systems, is gradually increasing, fueled by the growing awareness of environmental concerns and the demand for high-performance materials.
Consumer preferences are shifting towards environmentally friendly and sustainable adhesives, leading to increased demand for products with reduced Volatile Organic Compound (VOC) emissions. This preference is further propelled by stringent environmental regulations being implemented across several MEA countries. The competitive dynamics within the industry are intensely competitive, with companies focusing on product innovation, strategic partnerships, and geographic expansion to maintain market leadership. The market also witnesses the emergence of new technologies, such as smart adhesives and self-healing materials, presenting both opportunities and challenges for established players. Market penetration of waterborne adhesives is anticipated to reach xx% by 2033, driven by their environmental benefits and regulatory compliance needs.
Dominant Markets & Segments in MEA Construction Adhesives Industry
The MEA construction adhesives market is characterized by significant regional variations in growth and adoption of different adhesive types and technologies. While precise market dominance data varies by year, currently, the infrastructure sector holds the largest market share, driven by large-scale infrastructure projects across several countries in the MEA region. Within the resin type segment, acrylics currently dominate owing to their versatility and cost-effectiveness. The water-borne technology segment is experiencing significant growth, mirroring global trends towards sustainability.
- Key Drivers for Infrastructure Sector Dominance:
- Government Investments in Infrastructure Projects
- Rapid Urbanization and Population Growth
- Expansion of Transportation Networks
- Construction of Commercial and Residential Buildings
- Key Drivers for Acrylics Resin Type Dominance:
- Cost-effectiveness
- Versatility in Applications
- Ease of Use
- Key Drivers for Water-borne Technology Dominance:
- Environmental Regulations
- Demand for Sustainable Products
- Reduced VOC Emissions
MEA Construction Adhesives Industry Product Innovations
Recent product innovations in the MEA construction adhesives market include the development of high-performance, fast-curing adhesives catering to the need for shorter construction timelines. There’s a noticeable emphasis on creating adhesives with enhanced durability and resistance to harsh environmental conditions prevalent in parts of the MEA region. Companies are also focusing on developing sustainable and environmentally friendly adhesives to comply with evolving regulations. These innovations aim to provide enhanced performance, reduce application time, and improve environmental profiles, thereby addressing key market needs and demands.
Report Segmentation & Scope
This report segments the MEA construction adhesives market based on resin type (Acrylics, Epoxy, Polyurethanes, Polyvinyl Acetate (PVA), Silicones, Other Resin Types), technology (Water-borne, Reactive, Hot-melt, Other Technologies), and end-use sector (Residential, Commercial, Infrastructure, Industrial). Each segment's growth projections, market size, and competitive dynamics are analyzed, providing a granular understanding of the market landscape. Growth projections for individual segments vary, but the overall market demonstrates consistent growth across all segments, albeit at differing rates. Competitive dynamics reflect the presence of both large multinational corporations and regional players, leading to diverse competitive strategies.
Key Drivers of MEA Construction Adhesives Industry Growth
The growth of the MEA construction adhesives industry is propelled by several factors. Rapid urbanization and population growth across the region drive increased construction activities, fueling the demand for construction adhesives. Significant government investments in infrastructure projects, including roads, bridges, and buildings, create a substantial market for these products. Furthermore, technological advancements leading to improved adhesive performance, sustainability, and ease of application further stimulate market growth.
Challenges in the MEA Construction Adhesives Industry Sector
The MEA construction adhesives industry faces several challenges, including volatile raw material prices which affect profitability. Supply chain disruptions and logistical complexities in certain regions can hinder timely product delivery. Furthermore, intense competition from both established players and new entrants exerts pressure on profit margins. Stringent environmental regulations and the need for compliance add to operational complexity and costs. These challenges require careful strategic management to ensure sustained growth and profitability.
Leading Players in the MEA Construction Adhesives Industry Market
- Henkel AG & Co KGaA
- 3M
- Ashland
- Arkema Group
- Huntsman International LLC
- Dow
- H.B. Fuller Company
- Sika AG
- AVERY DENNISON CORPORATION
- Wacker Chemie AG
- *List Not Exhaustive
Key Developments in MEA Construction Adhesives Industry Sector
- 2022 Q4: Henkel launched a new range of sustainable adhesives for the construction industry.
- 2023 Q1: Sika acquired a regional adhesive manufacturer, expanding its market presence.
- 2023 Q2: New regulations on VOC emissions came into effect in several MEA countries.
- Further developments to be added based on data collected during report compilation.
Strategic MEA Construction Adhesives Industry Market Outlook
The MEA construction adhesives market holds significant future potential, fueled by ongoing urbanization, infrastructure development, and government initiatives. Strategic opportunities exist for companies focusing on innovation, sustainability, and localization. Developing high-performance, eco-friendly adhesives tailored to the specific needs of the region's diverse climates and construction practices can unlock substantial market share. Companies focusing on building strong distribution networks and forging strategic partnerships will be best positioned for success in this dynamic market.
MEA Construction Adhesives Industry Segmentation
-
1. Resin Type
- 1.1. Acrylics
- 1.2. Epoxy
- 1.3. Polyurethanes
- 1.4. Polyvinyl Acetate (PVA)
- 1.5. Silicones
- 1.6. Other Resin Types
-
2. Technology
- 2.1. Water-borne
- 2.2. Reactive
- 2.3. Hot-melt
- 2.4. Other Technologies
-
3. End-use Sector
- 3.1. Residential
- 3.2. Commercial
- 3.3. Infrastructure
- 3.4. Industrial
-
4. Geography
- 4.1. Saudi Arabia
- 4.2. South Africa
- 4.3. Rest of Middle-East and Africa
MEA Construction Adhesives Industry Segmentation By Geography
- 1. Saudi Arabia
- 2. South Africa
- 3. Rest of Middle East and Africa
MEA Construction Adhesives Industry REPORT HIGHLIGHTS
| Aspects | Details |
|---|---|
| Study Period | 2019-2033 |
| Base Year | 2024 |
| Estimated Year | 2025 |
| Forecast Period | 2025-2033 |
| Historical Period | 2019-2024 |
| Growth Rate | CAGR of > 4.00% from 2019-2033 |
| Segmentation |
|
Table of Contents
- 1. Introduction
- 1.1. Research Scope
- 1.2. Market Segmentation
- 1.3. Research Methodology
- 1.4. Definitions and Assumptions
- 2. Executive Summary
- 2.1. Introduction
- 3. Market Dynamics
- 3.1. Introduction
- 3.2. Market Drivers
- 3.2.1. ; Rapidly Growing Construction Industry
- 3.3. Market Restrains
- 3.3.1. ; Limited Usage in High End Applications; Other Restraints
- 3.4. Market Trends
- 3.4.1. Waterborne Technology to Dominate the Market
- 4. Market Factor Analysis
- 4.1. Porters Five Forces
- 4.2. Supply/Value Chain
- 4.3. PESTEL analysis
- 4.4. Market Entropy
- 4.5. Patent/Trademark Analysis
- 5. Global MEA Construction Adhesives Industry Analysis, Insights and Forecast, 2019-2031
- 5.1. Market Analysis, Insights and Forecast - by Resin Type
- 5.1.1. Acrylics
- 5.1.2. Epoxy
- 5.1.3. Polyurethanes
- 5.1.4. Polyvinyl Acetate (PVA)
- 5.1.5. Silicones
- 5.1.6. Other Resin Types
- 5.2. Market Analysis, Insights and Forecast - by Technology
- 5.2.1. Water-borne
- 5.2.2. Reactive
- 5.2.3. Hot-melt
- 5.2.4. Other Technologies
- 5.3. Market Analysis, Insights and Forecast - by End-use Sector
- 5.3.1. Residential
- 5.3.2. Commercial
- 5.3.3. Infrastructure
- 5.3.4. Industrial
- 5.4. Market Analysis, Insights and Forecast - by Geography
- 5.4.1. Saudi Arabia
- 5.4.2. South Africa
- 5.4.3. Rest of Middle-East and Africa
- 5.5. Market Analysis, Insights and Forecast - by Region
- 5.5.1. Saudi Arabia
- 5.5.2. South Africa
- 5.5.3. Rest of Middle East and Africa
- 5.1. Market Analysis, Insights and Forecast - by Resin Type
- 6. Saudi Arabia MEA Construction Adhesives Industry Analysis, Insights and Forecast, 2019-2031
- 6.1. Market Analysis, Insights and Forecast - by Resin Type
- 6.1.1. Acrylics
- 6.1.2. Epoxy
- 6.1.3. Polyurethanes
- 6.1.4. Polyvinyl Acetate (PVA)
- 6.1.5. Silicones
- 6.1.6. Other Resin Types
- 6.2. Market Analysis, Insights and Forecast - by Technology
- 6.2.1. Water-borne
- 6.2.2. Reactive
- 6.2.3. Hot-melt
- 6.2.4. Other Technologies
- 6.3. Market Analysis, Insights and Forecast - by End-use Sector
- 6.3.1. Residential
- 6.3.2. Commercial
- 6.3.3. Infrastructure
- 6.3.4. Industrial
- 6.4. Market Analysis, Insights and Forecast - by Geography
- 6.4.1. Saudi Arabia
- 6.4.2. South Africa
- 6.4.3. Rest of Middle-East and Africa
- 6.1. Market Analysis, Insights and Forecast - by Resin Type
- 7. South Africa MEA Construction Adhesives Industry Analysis, Insights and Forecast, 2019-2031
- 7.1. Market Analysis, Insights and Forecast - by Resin Type
- 7.1.1. Acrylics
- 7.1.2. Epoxy
- 7.1.3. Polyurethanes
- 7.1.4. Polyvinyl Acetate (PVA)
- 7.1.5. Silicones
- 7.1.6. Other Resin Types
- 7.2. Market Analysis, Insights and Forecast - by Technology
- 7.2.1. Water-borne
- 7.2.2. Reactive
- 7.2.3. Hot-melt
- 7.2.4. Other Technologies
- 7.3. Market Analysis, Insights and Forecast - by End-use Sector
- 7.3.1. Residential
- 7.3.2. Commercial
- 7.3.3. Infrastructure
- 7.3.4. Industrial
- 7.4. Market Analysis, Insights and Forecast - by Geography
- 7.4.1. Saudi Arabia
- 7.4.2. South Africa
- 7.4.3. Rest of Middle-East and Africa
- 7.1. Market Analysis, Insights and Forecast - by Resin Type
- 8. Rest of Middle East and Africa MEA Construction Adhesives Industry Analysis, Insights and Forecast, 2019-2031
- 8.1. Market Analysis, Insights and Forecast - by Resin Type
- 8.1.1. Acrylics
- 8.1.2. Epoxy
- 8.1.3. Polyurethanes
- 8.1.4. Polyvinyl Acetate (PVA)
- 8.1.5. Silicones
- 8.1.6. Other Resin Types
- 8.2. Market Analysis, Insights and Forecast - by Technology
- 8.2.1. Water-borne
- 8.2.2. Reactive
- 8.2.3. Hot-melt
- 8.2.4. Other Technologies
- 8.3. Market Analysis, Insights and Forecast - by End-use Sector
- 8.3.1. Residential
- 8.3.2. Commercial
- 8.3.3. Infrastructure
- 8.3.4. Industrial
- 8.4. Market Analysis, Insights and Forecast - by Geography
- 8.4.1. Saudi Arabia
- 8.4.2. South Africa
- 8.4.3. Rest of Middle-East and Africa
- 8.1. Market Analysis, Insights and Forecast - by Resin Type
- 9. North America MEA Construction Adhesives Industry Analysis, Insights and Forecast, 2019-2031
- 9.1. Market Analysis, Insights and Forecast - By Country/Sub-region
- 9.1.1 United States
- 9.1.2 Canada
- 9.1.3 Mexico
- 10. Europe MEA Construction Adhesives Industry Analysis, Insights and Forecast, 2019-2031
- 10.1. Market Analysis, Insights and Forecast - By Country/Sub-region
- 10.1.1 Germany
- 10.1.2 United Kingdom
- 10.1.3 France
- 10.1.4 Spain
- 10.1.5 Italy
- 10.1.6 Spain
- 10.1.7 Belgium
- 10.1.8 Netherland
- 10.1.9 Nordics
- 10.1.10 Rest of Europe
- 11. Asia Pacific MEA Construction Adhesives Industry Analysis, Insights and Forecast, 2019-2031
- 11.1. Market Analysis, Insights and Forecast - By Country/Sub-region
- 11.1.1 China
- 11.1.2 Japan
- 11.1.3 India
- 11.1.4 South Korea
- 11.1.5 Southeast Asia
- 11.1.6 Australia
- 11.1.7 Indonesia
- 11.1.8 Phillipes
- 11.1.9 Singapore
- 11.1.10 Thailandc
- 11.1.11 Rest of Asia Pacific
- 12. South America MEA Construction Adhesives Industry Analysis, Insights and Forecast, 2019-2031
- 12.1. Market Analysis, Insights and Forecast - By Country/Sub-region
- 12.1.1 Brazil
- 12.1.2 Argentina
- 12.1.3 Peru
- 12.1.4 Chile
- 12.1.5 Colombia
- 12.1.6 Ecuador
- 12.1.7 Venezuela
- 12.1.8 Rest of South America
- 13. North America MEA Construction Adhesives Industry Analysis, Insights and Forecast, 2019-2031
- 13.1. Market Analysis, Insights and Forecast - By Country/Sub-region
- 13.1.1 United States
- 13.1.2 Canada
- 13.1.3 Mexico
- 14. MEA MEA Construction Adhesives Industry Analysis, Insights and Forecast, 2019-2031
- 14.1. Market Analysis, Insights and Forecast - By Country/Sub-region
- 14.1.1 United Arab Emirates
- 14.1.2 Saudi Arabia
- 14.1.3 South Africa
- 14.1.4 Rest of Middle East and Africa
- 15. Competitive Analysis
- 15.1. Global Market Share Analysis 2024
- 15.2. Company Profiles
- 15.2.1 Henkel AG & Co KGaA
- 15.2.1.1. Overview
- 15.2.1.2. Products
- 15.2.1.3. SWOT Analysis
- 15.2.1.4. Recent Developments
- 15.2.1.5. Financials (Based on Availability)
- 15.2.2 3M
- 15.2.2.1. Overview
- 15.2.2.2. Products
- 15.2.2.3. SWOT Analysis
- 15.2.2.4. Recent Developments
- 15.2.2.5. Financials (Based on Availability)
- 15.2.3 Ashland
- 15.2.3.1. Overview
- 15.2.3.2. Products
- 15.2.3.3. SWOT Analysis
- 15.2.3.4. Recent Developments
- 15.2.3.5. Financials (Based on Availability)
- 15.2.4 Arkema Group
- 15.2.4.1. Overview
- 15.2.4.2. Products
- 15.2.4.3. SWOT Analysis
- 15.2.4.4. Recent Developments
- 15.2.4.5. Financials (Based on Availability)
- 15.2.5 Huntsman International LLC
- 15.2.5.1. Overview
- 15.2.5.2. Products
- 15.2.5.3. SWOT Analysis
- 15.2.5.4. Recent Developments
- 15.2.5.5. Financials (Based on Availability)
- 15.2.6 Dow
- 15.2.6.1. Overview
- 15.2.6.2. Products
- 15.2.6.3. SWOT Analysis
- 15.2.6.4. Recent Developments
- 15.2.6.5. Financials (Based on Availability)
- 15.2.7 H B Fuller Company
- 15.2.7.1. Overview
- 15.2.7.2. Products
- 15.2.7.3. SWOT Analysis
- 15.2.7.4. Recent Developments
- 15.2.7.5. Financials (Based on Availability)
- 15.2.8 Sika AG
- 15.2.8.1. Overview
- 15.2.8.2. Products
- 15.2.8.3. SWOT Analysis
- 15.2.8.4. Recent Developments
- 15.2.8.5. Financials (Based on Availability)
- 15.2.9 AVERY DENNISON CORPORATION
- 15.2.9.1. Overview
- 15.2.9.2. Products
- 15.2.9.3. SWOT Analysis
- 15.2.9.4. Recent Developments
- 15.2.9.5. Financials (Based on Availability)
- 15.2.10 Wacker Chemie AG*List Not Exhaustive
- 15.2.10.1. Overview
- 15.2.10.2. Products
- 15.2.10.3. SWOT Analysis
- 15.2.10.4. Recent Developments
- 15.2.10.5. Financials (Based on Availability)
- 15.2.1 Henkel AG & Co KGaA
List of Figures
- Figure 1: Global MEA Construction Adhesives Industry Revenue Breakdown (Million, %) by Region 2024 & 2032
- Figure 2: North America MEA Construction Adhesives Industry Revenue (Million), by Country 2024 & 2032
- Figure 3: North America MEA Construction Adhesives Industry Revenue Share (%), by Country 2024 & 2032
- Figure 4: Europe MEA Construction Adhesives Industry Revenue (Million), by Country 2024 & 2032
- Figure 5: Europe MEA Construction Adhesives Industry Revenue Share (%), by Country 2024 & 2032
- Figure 6: Asia Pacific MEA Construction Adhesives Industry Revenue (Million), by Country 2024 & 2032
- Figure 7: Asia Pacific MEA Construction Adhesives Industry Revenue Share (%), by Country 2024 & 2032
- Figure 8: South America MEA Construction Adhesives Industry Revenue (Million), by Country 2024 & 2032
- Figure 9: South America MEA Construction Adhesives Industry Revenue Share (%), by Country 2024 & 2032
- Figure 10: North America MEA Construction Adhesives Industry Revenue (Million), by Country 2024 & 2032
- Figure 11: North America MEA Construction Adhesives Industry Revenue Share (%), by Country 2024 & 2032
- Figure 12: MEA MEA Construction Adhesives Industry Revenue (Million), by Country 2024 & 2032
- Figure 13: MEA MEA Construction Adhesives Industry Revenue Share (%), by Country 2024 & 2032
- Figure 14: Saudi Arabia MEA Construction Adhesives Industry Revenue (Million), by Resin Type 2024 & 2032
- Figure 15: Saudi Arabia MEA Construction Adhesives Industry Revenue Share (%), by Resin Type 2024 & 2032
- Figure 16: Saudi Arabia MEA Construction Adhesives Industry Revenue (Million), by Technology 2024 & 2032
- Figure 17: Saudi Arabia MEA Construction Adhesives Industry Revenue Share (%), by Technology 2024 & 2032
- Figure 18: Saudi Arabia MEA Construction Adhesives Industry Revenue (Million), by End-use Sector 2024 & 2032
- Figure 19: Saudi Arabia MEA Construction Adhesives Industry Revenue Share (%), by End-use Sector 2024 & 2032
- Figure 20: Saudi Arabia MEA Construction Adhesives Industry Revenue (Million), by Geography 2024 & 2032
- Figure 21: Saudi Arabia MEA Construction Adhesives Industry Revenue Share (%), by Geography 2024 & 2032
- Figure 22: Saudi Arabia MEA Construction Adhesives Industry Revenue (Million), by Country 2024 & 2032
- Figure 23: Saudi Arabia MEA Construction Adhesives Industry Revenue Share (%), by Country 2024 & 2032
- Figure 24: South Africa MEA Construction Adhesives Industry Revenue (Million), by Resin Type 2024 & 2032
- Figure 25: South Africa MEA Construction Adhesives Industry Revenue Share (%), by Resin Type 2024 & 2032
- Figure 26: South Africa MEA Construction Adhesives Industry Revenue (Million), by Technology 2024 & 2032
- Figure 27: South Africa MEA Construction Adhesives Industry Revenue Share (%), by Technology 2024 & 2032
- Figure 28: South Africa MEA Construction Adhesives Industry Revenue (Million), by End-use Sector 2024 & 2032
- Figure 29: South Africa MEA Construction Adhesives Industry Revenue Share (%), by End-use Sector 2024 & 2032
- Figure 30: South Africa MEA Construction Adhesives Industry Revenue (Million), by Geography 2024 & 2032
- Figure 31: South Africa MEA Construction Adhesives Industry Revenue Share (%), by Geography 2024 & 2032
- Figure 32: South Africa MEA Construction Adhesives Industry Revenue (Million), by Country 2024 & 2032
- Figure 33: South Africa MEA Construction Adhesives Industry Revenue Share (%), by Country 2024 & 2032
- Figure 34: Rest of Middle East and Africa MEA Construction Adhesives Industry Revenue (Million), by Resin Type 2024 & 2032
- Figure 35: Rest of Middle East and Africa MEA Construction Adhesives Industry Revenue Share (%), by Resin Type 2024 & 2032
- Figure 36: Rest of Middle East and Africa MEA Construction Adhesives Industry Revenue (Million), by Technology 2024 & 2032
- Figure 37: Rest of Middle East and Africa MEA Construction Adhesives Industry Revenue Share (%), by Technology 2024 & 2032
- Figure 38: Rest of Middle East and Africa MEA Construction Adhesives Industry Revenue (Million), by End-use Sector 2024 & 2032
- Figure 39: Rest of Middle East and Africa MEA Construction Adhesives Industry Revenue Share (%), by End-use Sector 2024 & 2032
- Figure 40: Rest of Middle East and Africa MEA Construction Adhesives Industry Revenue (Million), by Geography 2024 & 2032
- Figure 41: Rest of Middle East and Africa MEA Construction Adhesives Industry Revenue Share (%), by Geography 2024 & 2032
- Figure 42: Rest of Middle East and Africa MEA Construction Adhesives Industry Revenue (Million), by Country 2024 & 2032
- Figure 43: Rest of Middle East and Africa MEA Construction Adhesives Industry Revenue Share (%), by Country 2024 & 2032
List of Tables
- Table 1: Global MEA Construction Adhesives Industry Revenue Million Forecast, by Region 2019 & 2032
- Table 2: Global MEA Construction Adhesives Industry Revenue Million Forecast, by Resin Type 2019 & 2032
- Table 3: Global MEA Construction Adhesives Industry Revenue Million Forecast, by Technology 2019 & 2032
- Table 4: Global MEA Construction Adhesives Industry Revenue Million Forecast, by End-use Sector 2019 & 2032
- Table 5: Global MEA Construction Adhesives Industry Revenue Million Forecast, by Geography 2019 & 2032
- Table 6: Global MEA Construction Adhesives Industry Revenue Million Forecast, by Region 2019 & 2032
- Table 7: Global MEA Construction Adhesives Industry Revenue Million Forecast, by Country 2019 & 2032
- Table 8: United States MEA Construction Adhesives Industry Revenue (Million) Forecast, by Application 2019 & 2032
- Table 9: Canada MEA Construction Adhesives Industry Revenue (Million) Forecast, by Application 2019 & 2032
- Table 10: Mexico MEA Construction Adhesives Industry Revenue (Million) Forecast, by Application 2019 & 2032
- Table 11: Global MEA Construction Adhesives Industry Revenue Million Forecast, by Country 2019 & 2032
- Table 12: Germany MEA Construction Adhesives Industry Revenue (Million) Forecast, by Application 2019 & 2032
- Table 13: United Kingdom MEA Construction Adhesives Industry Revenue (Million) Forecast, by Application 2019 & 2032
- Table 14: France MEA Construction Adhesives Industry Revenue (Million) Forecast, by Application 2019 & 2032
- Table 15: Spain MEA Construction Adhesives Industry Revenue (Million) Forecast, by Application 2019 & 2032
- Table 16: Italy MEA Construction Adhesives Industry Revenue (Million) Forecast, by Application 2019 & 2032
- Table 17: Spain MEA Construction Adhesives Industry Revenue (Million) Forecast, by Application 2019 & 2032
- Table 18: Belgium MEA Construction Adhesives Industry Revenue (Million) Forecast, by Application 2019 & 2032
- Table 19: Netherland MEA Construction Adhesives Industry Revenue (Million) Forecast, by Application 2019 & 2032
- Table 20: Nordics MEA Construction Adhesives Industry Revenue (Million) Forecast, by Application 2019 & 2032
- Table 21: Rest of Europe MEA Construction Adhesives Industry Revenue (Million) Forecast, by Application 2019 & 2032
- Table 22: Global MEA Construction Adhesives Industry Revenue Million Forecast, by Country 2019 & 2032
- Table 23: China MEA Construction Adhesives Industry Revenue (Million) Forecast, by Application 2019 & 2032
- Table 24: Japan MEA Construction Adhesives Industry Revenue (Million) Forecast, by Application 2019 & 2032
- Table 25: India MEA Construction Adhesives Industry Revenue (Million) Forecast, by Application 2019 & 2032
- Table 26: South Korea MEA Construction Adhesives Industry Revenue (Million) Forecast, by Application 2019 & 2032
- Table 27: Southeast Asia MEA Construction Adhesives Industry Revenue (Million) Forecast, by Application 2019 & 2032
- Table 28: Australia MEA Construction Adhesives Industry Revenue (Million) Forecast, by Application 2019 & 2032
- Table 29: Indonesia MEA Construction Adhesives Industry Revenue (Million) Forecast, by Application 2019 & 2032
- Table 30: Phillipes MEA Construction Adhesives Industry Revenue (Million) Forecast, by Application 2019 & 2032
- Table 31: Singapore MEA Construction Adhesives Industry Revenue (Million) Forecast, by Application 2019 & 2032
- Table 32: Thailandc MEA Construction Adhesives Industry Revenue (Million) Forecast, by Application 2019 & 2032
- Table 33: Rest of Asia Pacific MEA Construction Adhesives Industry Revenue (Million) Forecast, by Application 2019 & 2032
- Table 34: Global MEA Construction Adhesives Industry Revenue Million Forecast, by Country 2019 & 2032
- Table 35: Brazil MEA Construction Adhesives Industry Revenue (Million) Forecast, by Application 2019 & 2032
- Table 36: Argentina MEA Construction Adhesives Industry Revenue (Million) Forecast, by Application 2019 & 2032
- Table 37: Peru MEA Construction Adhesives Industry Revenue (Million) Forecast, by Application 2019 & 2032
- Table 38: Chile MEA Construction Adhesives Industry Revenue (Million) Forecast, by Application 2019 & 2032
- Table 39: Colombia MEA Construction Adhesives Industry Revenue (Million) Forecast, by Application 2019 & 2032
- Table 40: Ecuador MEA Construction Adhesives Industry Revenue (Million) Forecast, by Application 2019 & 2032
- Table 41: Venezuela MEA Construction Adhesives Industry Revenue (Million) Forecast, by Application 2019 & 2032
- Table 42: Rest of South America MEA Construction Adhesives Industry Revenue (Million) Forecast, by Application 2019 & 2032
- Table 43: Global MEA Construction Adhesives Industry Revenue Million Forecast, by Country 2019 & 2032
- Table 44: United States MEA Construction Adhesives Industry Revenue (Million) Forecast, by Application 2019 & 2032
- Table 45: Canada MEA Construction Adhesives Industry Revenue (Million) Forecast, by Application 2019 & 2032
- Table 46: Mexico MEA Construction Adhesives Industry Revenue (Million) Forecast, by Application 2019 & 2032
- Table 47: Global MEA Construction Adhesives Industry Revenue Million Forecast, by Country 2019 & 2032
- Table 48: United Arab Emirates MEA Construction Adhesives Industry Revenue (Million) Forecast, by Application 2019 & 2032
- Table 49: Saudi Arabia MEA Construction Adhesives Industry Revenue (Million) Forecast, by Application 2019 & 2032
- Table 50: South Africa MEA Construction Adhesives Industry Revenue (Million) Forecast, by Application 2019 & 2032
- Table 51: Rest of Middle East and Africa MEA Construction Adhesives Industry Revenue (Million) Forecast, by Application 2019 & 2032
- Table 52: Global MEA Construction Adhesives Industry Revenue Million Forecast, by Resin Type 2019 & 2032
- Table 53: Global MEA Construction Adhesives Industry Revenue Million Forecast, by Technology 2019 & 2032
- Table 54: Global MEA Construction Adhesives Industry Revenue Million Forecast, by End-use Sector 2019 & 2032
- Table 55: Global MEA Construction Adhesives Industry Revenue Million Forecast, by Geography 2019 & 2032
- Table 56: Global MEA Construction Adhesives Industry Revenue Million Forecast, by Country 2019 & 2032
- Table 57: Global MEA Construction Adhesives Industry Revenue Million Forecast, by Resin Type 2019 & 2032
- Table 58: Global MEA Construction Adhesives Industry Revenue Million Forecast, by Technology 2019 & 2032
- Table 59: Global MEA Construction Adhesives Industry Revenue Million Forecast, by End-use Sector 2019 & 2032
- Table 60: Global MEA Construction Adhesives Industry Revenue Million Forecast, by Geography 2019 & 2032
- Table 61: Global MEA Construction Adhesives Industry Revenue Million Forecast, by Country 2019 & 2032
- Table 62: Global MEA Construction Adhesives Industry Revenue Million Forecast, by Resin Type 2019 & 2032
- Table 63: Global MEA Construction Adhesives Industry Revenue Million Forecast, by Technology 2019 & 2032
- Table 64: Global MEA Construction Adhesives Industry Revenue Million Forecast, by End-use Sector 2019 & 2032
- Table 65: Global MEA Construction Adhesives Industry Revenue Million Forecast, by Geography 2019 & 2032
- Table 66: Global MEA Construction Adhesives Industry Revenue Million Forecast, by Country 2019 & 2032
Frequently Asked Questions
1. What is the projected Compound Annual Growth Rate (CAGR) of the MEA Construction Adhesives Industry?
The projected CAGR is approximately > 4.00%.
2. Which companies are prominent players in the MEA Construction Adhesives Industry?
Key companies in the market include Henkel AG & Co KGaA, 3M, Ashland, Arkema Group, Huntsman International LLC, Dow, H B Fuller Company, Sika AG, AVERY DENNISON CORPORATION, Wacker Chemie AG*List Not Exhaustive.
3. What are the main segments of the MEA Construction Adhesives Industry?
The market segments include Resin Type, Technology, End-use Sector, Geography.
4. Can you provide details about the market size?
The market size is estimated to be USD XX Million as of 2022.
5. What are some drivers contributing to market growth?
; Rapidly Growing Construction Industry.
6. What are the notable trends driving market growth?
Waterborne Technology to Dominate the Market.
7. Are there any restraints impacting market growth?
; Limited Usage in High End Applications; Other Restraints.
8. Can you provide examples of recent developments in the market?
N/A
9. What pricing options are available for accessing the report?
Pricing options include single-user, multi-user, and enterprise licenses priced at USD 4750, USD 5250, and USD 8750 respectively.
10. Is the market size provided in terms of value or volume?
The market size is provided in terms of value, measured in Million.
11. Are there any specific market keywords associated with the report?
Yes, the market keyword associated with the report is "MEA Construction Adhesives Industry," which aids in identifying and referencing the specific market segment covered.
12. How do I determine which pricing option suits my needs best?
The pricing options vary based on user requirements and access needs. Individual users may opt for single-user licenses, while businesses requiring broader access may choose multi-user or enterprise licenses for cost-effective access to the report.
13. Are there any additional resources or data provided in the MEA Construction Adhesives Industry report?
While the report offers comprehensive insights, it's advisable to review the specific contents or supplementary materials provided to ascertain if additional resources or data are available.
14. How can I stay updated on further developments or reports in the MEA Construction Adhesives Industry?
To stay informed about further developments, trends, and reports in the MEA Construction Adhesives Industry, consider subscribing to industry newsletters, following relevant companies and organizations, or regularly checking reputable industry news sources and publications.
Methodology
Step 1 - Identification of Relevant Samples Size from Population Database


Step 2 - Approaches for Defining Global Market Size (Value, Volume* & Price*)

Note*: In applicable scenarios
Step 3 - Data Sources
Primary Research
- Web Analytics
- Survey Reports
- Research Institute
- Latest Research Reports
- Opinion Leaders
Secondary Research
- Annual Reports
- White Paper
- Latest Press Release
- Industry Association
- Paid Database
- Investor Presentations

Step 4 - Data Triangulation
Involves using different sources of information in order to increase the validity of a study
These sources are likely to be stakeholders in a program - participants, other researchers, program staff, other community members, and so on.
Then we put all data in single framework & apply various statistical tools to find out the dynamic on the market.
During the analysis stage, feedback from the stakeholder groups would be compared to determine areas of agreement as well as areas of divergence


