
Key Insights
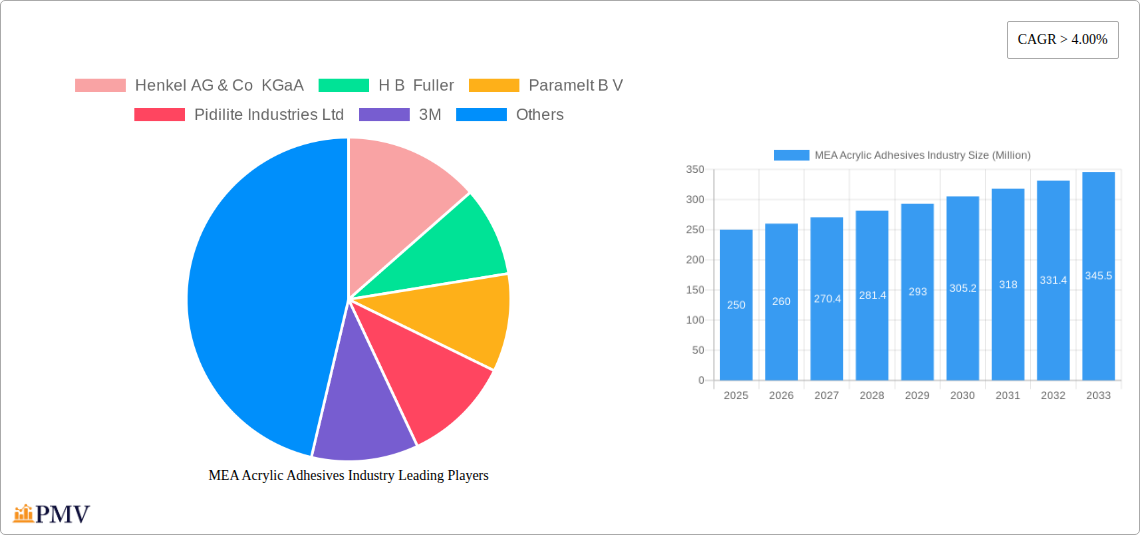
The Middle East and Africa (MEA) acrylic adhesives market is experiencing robust growth, driven by the burgeoning construction, packaging, and automotive sectors within the region. The market's expansion is fueled by increasing infrastructure development projects, a rise in disposable incomes leading to higher consumer spending, and a growing preference for advanced adhesive technologies offering superior bonding strength, durability, and ease of application. Specifically, the construction industry's demand for high-performance acrylic adhesives in applications like window installation, flooring, and interior design is a significant contributor to market growth. Furthermore, the packaging industry's adoption of acrylic adhesives for labels, cartons, and flexible packaging is another key driver. While a precise market size for MEA in 2025 is unavailable, considering a global CAGR of over 4% and the region's rapid industrialization, a reasonable estimate would place the MEA acrylic adhesives market value at approximately $250 million in 2025. This figure reflects a significant portion of the global market and the strong growth prospects within the region.
Looking ahead, the MEA acrylic adhesives market is poised for sustained expansion throughout the forecast period (2025-2033). Factors such as government initiatives promoting industrial diversification, the growing adoption of sustainable and eco-friendly adhesive solutions, and technological advancements leading to improved adhesive formulations will further stimulate market growth. However, potential restraints include fluctuations in raw material prices, economic volatility in certain MEA countries, and the presence of substitute adhesive technologies. Nevertheless, the overall positive outlook for the region's industrial and economic development suggests that the MEA acrylic adhesives market will continue its upward trajectory, driven by sustained demand across various end-use industries. The market segmentation within MEA will likely see significant growth in the water-based acrylic adhesives segment due to their environmentally friendly nature and increasing regulatory compliance.
This detailed report provides a comprehensive analysis of the Middle East and Africa (MEA) acrylic adhesives industry, offering invaluable insights for businesses, investors, and stakeholders. The study period spans from 2019 to 2033, with 2025 serving as the base and estimated year. The report meticulously examines market dynamics, competitive landscapes, technological advancements, and future growth prospects. With a focus on key segments and leading players, this report is an essential resource for understanding and navigating this dynamic market.
MEA Acrylic Adhesives Industry Market Structure & Competitive Dynamics
The MEA acrylic adhesives market is characterized by a moderately concentrated structure, with several multinational corporations and regional players vying for market share. Key players, including Henkel AG & Co KGaA, H.B. Fuller, Paramelt B.V., Pidilite Industries Ltd, 3M, and others, compete based on product innovation, pricing strategies, and distribution networks. The market share of the top five players in 2024 is estimated at approximately xx%.
The MEA region's regulatory landscape significantly impacts the industry, with varying regulations on chemical composition and environmental compliance across different countries. Innovation ecosystems are emerging, driven by collaborations between adhesive manufacturers and end-user industries to develop specialized solutions. Product substitution, particularly from bio-based adhesives, presents a growing challenge, although the performance and cost-effectiveness of acrylic adhesives remain their main advantage. Significant M&A activities have shaped the market landscape, with deal values exceeding xx Million in the past five years, primarily focused on expanding product portfolios and geographic reach. Examples include [Insert specific M&A examples with deal values if available, otherwise replace with "xx Million deals involving xx and xx"]. End-user trends toward lightweighting, sustainability, and automation in various industries are influencing the demand for specific acrylic adhesive types.
MEA Acrylic Adhesives Industry Industry Trends & Insights
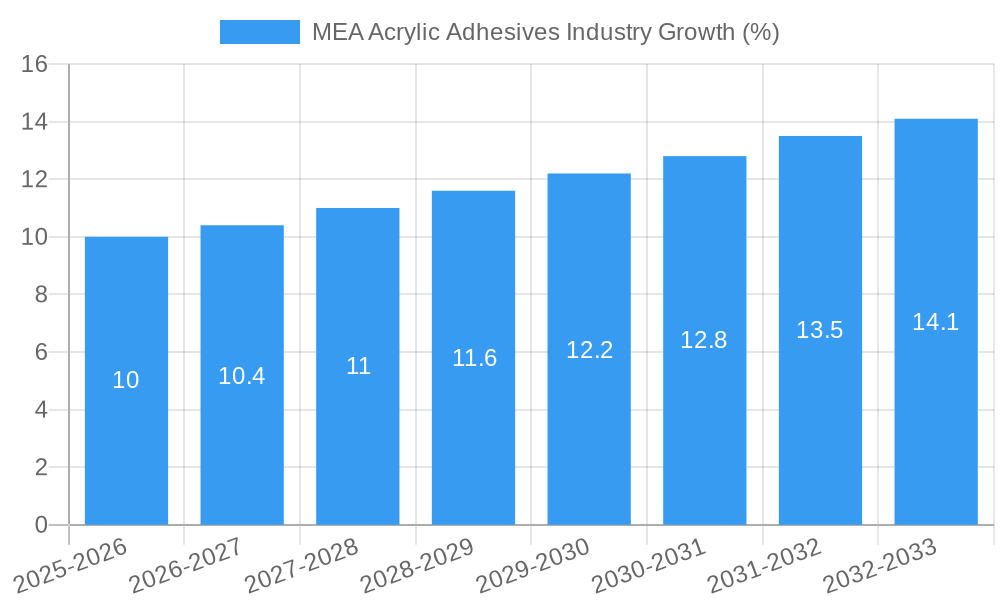
The MEA acrylic adhesives market is projected to experience a Compound Annual Growth Rate (CAGR) of xx% during the forecast period (2025-2033). This growth is propelled by several key factors. The burgeoning construction sector, driven by infrastructural development initiatives across the region, significantly fuels demand for acrylic adhesives in building and construction applications. The expanding electronics and packaging industries, particularly in key economies like the UAE and South Africa, contribute to substantial market growth. The rising adoption of advanced adhesive technologies, such as reactive and water-based systems, driven by environmental concerns, further propels market expansion.
Technological disruptions, particularly in adhesive formulation and application methods, are reshaping the competitive landscape. The introduction of automated dispensing systems and robotic assembly processes is enhancing efficiency and precision in adhesive applications. Consumer preferences are increasingly shifting towards sustainable and environmentally friendly products, leading to a greater demand for water-based and bio-based acrylic adhesives. The market's competitive dynamics are shaped by intense rivalry among established players and the emergence of new entrants, leading to continuous product innovation and price competition. Market penetration of water-based adhesives is steadily rising, currently estimated at xx%, projected to reach xx% by 2033.
Dominant Markets & Segments in MEA Acrylic Adhesives Industry
The building and construction sector represents the largest end-user segment for acrylic adhesives in the MEA region, accounting for approximately xx% of the total market in 2024. This is fueled by robust infrastructure development across several countries, including large-scale projects in Saudi Arabia, the UAE, and Egypt.
- Key Drivers for Building & Construction Dominance:
- Extensive government investments in infrastructure projects.
- Rapid urbanization and population growth in key regions.
- Increased adoption of sustainable building materials.
The packaging segment is another significant growth driver, projected to exhibit a CAGR of xx% during the forecast period. The expanding food and beverage, pharmaceuticals, and consumer goods industries contribute heavily to this sector's growth. Water-based acrylic adhesives dominate the technology segment due to growing environmental concerns and regulatory pressures. Specific countries like the UAE and South Africa show strong growth in the electrical and electronics sector, pushing demand for specialized acrylic adhesives.
MEA Acrylic Adhesives Industry Product Innovations
Recent advancements focus on developing high-performance acrylic adhesives with improved bonding strength, enhanced durability, and faster curing times. Emphasis is placed on developing environmentally friendly, low-VOC (Volatile Organic Compound) formulations to comply with stringent environmental regulations. Innovative application technologies, such as automated dispensing systems and two-component reactive systems, are enhancing efficiency and precision. These innovations cater to the increasing demand for high-speed manufacturing processes in diverse industries.
Report Segmentation & Scope
The report segments the MEA acrylic adhesives market by technology (water-based, solvent-based, reactive, and other technologies) and end-user industry (building and construction, electrical and electronics, packaging, sporting goods, transportation, woodworking, and other end-user industries). Each segment is analyzed in detail, providing insights into market size, growth projections, competitive dynamics, and key trends. For instance, the water-based segment is projected to experience faster growth due to environmental regulations, while the building and construction segment is expected to remain dominant due to infrastructure development. Market size estimations and growth projections are provided for each segment for the forecast period (2025-2033).
Key Drivers of MEA Acrylic Adhesives Industry Growth
Several factors contribute to the growth of the MEA acrylic adhesives market. The robust growth of the construction and infrastructure sectors in the region, driven by government investment and urbanization, is a major driver. The expanding manufacturing industries, particularly in the packaging, electronics, and automotive sectors, also contribute significantly. Technological advancements, leading to the development of high-performance, sustainable, and easy-to-apply adhesives, further enhance market growth. Favorable government policies supporting industrial development and infrastructure projects provide an impetus for growth.
Challenges in the MEA Acrylic Adhesives Industry Sector
The MEA acrylic adhesives market faces certain challenges. Fluctuations in raw material prices can impact production costs and profitability. Stringent environmental regulations and the increasing demand for sustainable alternatives necessitate continuous innovation and investment in eco-friendly technologies. Intense competition from established and emerging players adds pressure on pricing and margins. Supply chain disruptions, especially those related to raw material sourcing and transportation, can also negatively impact market dynamics.
Leading Players in the MEA Acrylic Adhesives Industry Market
- Henkel AG & Co KGaA
- H.B. Fuller
- Paramelt B.V.
- Pidilite Industries Ltd
- 3M
- Mapei Inc
- Dymax Corporation
- Jowat AG
- Ashland
- Arkema Group
- Huntsman International LLC
- Tesa SE (A Beiersdorf Company)
- ITW Performance Polymers (Illinois Tool Works Inc)
- MUNZING Corporation
- Beardow Adams
- DuPont
- Dow
- Avery Dennison Corporation
- Hexion
- Franklin International
- Adhesives Research Inc
- Sika AG
- Collano AG
- Permabond LLC
- Wacker Chemie AG
Key Developments in MEA Acrylic Adhesives Industry Sector
- 2023 Q3: Henkel launches a new range of sustainable acrylic adhesives for the packaging industry.
- 2022 Q4: H.B. Fuller acquires a regional adhesive manufacturer, expanding its market presence in the MEA region.
- 2021 Q2: 3M introduces a new high-performance acrylic adhesive for the automotive sector. [Add more specific examples with dates and impacts if available]
Strategic MEA Acrylic Adhesives Industry Market Outlook
The MEA acrylic adhesives market presents significant growth opportunities driven by continuous infrastructure development, industrial expansion, and the increasing adoption of advanced adhesive technologies. Strategic focus should be on developing sustainable and high-performance products tailored to specific end-user needs. Expanding distribution networks and strengthening partnerships with key players in the region are crucial for achieving market penetration and capturing growth opportunities. Investing in research and development to develop innovative and eco-friendly adhesive formulations is essential for long-term success in this dynamic market.
MEA Acrylic Adhesives Industry Segmentation
-
1. Technology
- 1.1. Water-based
- 1.2. Solvent-based
- 1.3. Reactive
- 1.4. Other Technologies
-
2. End-user Industry
- 2.1. Building and Construction
- 2.2. Electrical and Electronics
- 2.3. Packaging
- 2.4. Sporting Goods
- 2.5. Transportation
- 2.6. Woodworking
- 2.7. Other End-user Industries
-
3. Geography
- 3.1. Saudi Arabia
- 3.2. South Africa
- 3.3. United Arab Emirates
- 3.4. Qatar
- 3.5. Rest of Middle-East and Africa
MEA Acrylic Adhesives Industry Segmentation By Geography
- 1. Saudi Arabia
- 2. South Africa
- 3. United Arab Emirates
- 4. Qatar
- 5. Rest of Middle East and Africa
MEA Acrylic Adhesives Industry REPORT HIGHLIGHTS
| Aspects | Details |
|---|---|
| Study Period | 2019-2033 |
| Base Year | 2024 |
| Estimated Year | 2025 |
| Forecast Period | 2025-2033 |
| Historical Period | 2019-2024 |
| Growth Rate | CAGR of > 4.00% from 2019-2033 |
| Segmentation |
|
Table of Contents
- 1. Introduction
- 1.1. Research Scope
- 1.2. Market Segmentation
- 1.3. Research Methodology
- 1.4. Definitions and Assumptions
- 2. Executive Summary
- 2.1. Introduction
- 3. Market Dynamics
- 3.1. Introduction
- 3.2. Market Drivers
- 3.2.1. ; High Packaging Demand from Food & Beverage Industry; Robust Growth of Construction Industry
- 3.3. Market Restrains
- 3.3.1. ; Availability of Alternative Feedstocks for Adhesives; Stringent Environmental Regulations Regarding VOC Emissions
- 3.4. Market Trends
- 3.4.1. Packaging Industry to Drive the Market Demand
- 4. Market Factor Analysis
- 4.1. Porters Five Forces
- 4.2. Supply/Value Chain
- 4.3. PESTEL analysis
- 4.4. Market Entropy
- 4.5. Patent/Trademark Analysis
- 5. Global MEA Acrylic Adhesives Industry Analysis, Insights and Forecast, 2019-2031
- 5.1. Market Analysis, Insights and Forecast - by Technology
- 5.1.1. Water-based
- 5.1.2. Solvent-based
- 5.1.3. Reactive
- 5.1.4. Other Technologies
- 5.2. Market Analysis, Insights and Forecast - by End-user Industry
- 5.2.1. Building and Construction
- 5.2.2. Electrical and Electronics
- 5.2.3. Packaging
- 5.2.4. Sporting Goods
- 5.2.5. Transportation
- 5.2.6. Woodworking
- 5.2.7. Other End-user Industries
- 5.3. Market Analysis, Insights and Forecast - by Geography
- 5.3.1. Saudi Arabia
- 5.3.2. South Africa
- 5.3.3. United Arab Emirates
- 5.3.4. Qatar
- 5.3.5. Rest of Middle-East and Africa
- 5.4. Market Analysis, Insights and Forecast - by Region
- 5.4.1. Saudi Arabia
- 5.4.2. South Africa
- 5.4.3. United Arab Emirates
- 5.4.4. Qatar
- 5.4.5. Rest of Middle East and Africa
- 5.1. Market Analysis, Insights and Forecast - by Technology
- 6. Saudi Arabia MEA Acrylic Adhesives Industry Analysis, Insights and Forecast, 2019-2031
- 6.1. Market Analysis, Insights and Forecast - by Technology
- 6.1.1. Water-based
- 6.1.2. Solvent-based
- 6.1.3. Reactive
- 6.1.4. Other Technologies
- 6.2. Market Analysis, Insights and Forecast - by End-user Industry
- 6.2.1. Building and Construction
- 6.2.2. Electrical and Electronics
- 6.2.3. Packaging
- 6.2.4. Sporting Goods
- 6.2.5. Transportation
- 6.2.6. Woodworking
- 6.2.7. Other End-user Industries
- 6.3. Market Analysis, Insights and Forecast - by Geography
- 6.3.1. Saudi Arabia
- 6.3.2. South Africa
- 6.3.3. United Arab Emirates
- 6.3.4. Qatar
- 6.3.5. Rest of Middle-East and Africa
- 6.1. Market Analysis, Insights and Forecast - by Technology
- 7. South Africa MEA Acrylic Adhesives Industry Analysis, Insights and Forecast, 2019-2031
- 7.1. Market Analysis, Insights and Forecast - by Technology
- 7.1.1. Water-based
- 7.1.2. Solvent-based
- 7.1.3. Reactive
- 7.1.4. Other Technologies
- 7.2. Market Analysis, Insights and Forecast - by End-user Industry
- 7.2.1. Building and Construction
- 7.2.2. Electrical and Electronics
- 7.2.3. Packaging
- 7.2.4. Sporting Goods
- 7.2.5. Transportation
- 7.2.6. Woodworking
- 7.2.7. Other End-user Industries
- 7.3. Market Analysis, Insights and Forecast - by Geography
- 7.3.1. Saudi Arabia
- 7.3.2. South Africa
- 7.3.3. United Arab Emirates
- 7.3.4. Qatar
- 7.3.5. Rest of Middle-East and Africa
- 7.1. Market Analysis, Insights and Forecast - by Technology
- 8. United Arab Emirates MEA Acrylic Adhesives Industry Analysis, Insights and Forecast, 2019-2031
- 8.1. Market Analysis, Insights and Forecast - by Technology
- 8.1.1. Water-based
- 8.1.2. Solvent-based
- 8.1.3. Reactive
- 8.1.4. Other Technologies
- 8.2. Market Analysis, Insights and Forecast - by End-user Industry
- 8.2.1. Building and Construction
- 8.2.2. Electrical and Electronics
- 8.2.3. Packaging
- 8.2.4. Sporting Goods
- 8.2.5. Transportation
- 8.2.6. Woodworking
- 8.2.7. Other End-user Industries
- 8.3. Market Analysis, Insights and Forecast - by Geography
- 8.3.1. Saudi Arabia
- 8.3.2. South Africa
- 8.3.3. United Arab Emirates
- 8.3.4. Qatar
- 8.3.5. Rest of Middle-East and Africa
- 8.1. Market Analysis, Insights and Forecast - by Technology
- 9. Qatar MEA Acrylic Adhesives Industry Analysis, Insights and Forecast, 2019-2031
- 9.1. Market Analysis, Insights and Forecast - by Technology
- 9.1.1. Water-based
- 9.1.2. Solvent-based
- 9.1.3. Reactive
- 9.1.4. Other Technologies
- 9.2. Market Analysis, Insights and Forecast - by End-user Industry
- 9.2.1. Building and Construction
- 9.2.2. Electrical and Electronics
- 9.2.3. Packaging
- 9.2.4. Sporting Goods
- 9.2.5. Transportation
- 9.2.6. Woodworking
- 9.2.7. Other End-user Industries
- 9.3. Market Analysis, Insights and Forecast - by Geography
- 9.3.1. Saudi Arabia
- 9.3.2. South Africa
- 9.3.3. United Arab Emirates
- 9.3.4. Qatar
- 9.3.5. Rest of Middle-East and Africa
- 9.1. Market Analysis, Insights and Forecast - by Technology
- 10. Rest of Middle East and Africa MEA Acrylic Adhesives Industry Analysis, Insights and Forecast, 2019-2031
- 10.1. Market Analysis, Insights and Forecast - by Technology
- 10.1.1. Water-based
- 10.1.2. Solvent-based
- 10.1.3. Reactive
- 10.1.4. Other Technologies
- 10.2. Market Analysis, Insights and Forecast - by End-user Industry
- 10.2.1. Building and Construction
- 10.2.2. Electrical and Electronics
- 10.2.3. Packaging
- 10.2.4. Sporting Goods
- 10.2.5. Transportation
- 10.2.6. Woodworking
- 10.2.7. Other End-user Industries
- 10.3. Market Analysis, Insights and Forecast - by Geography
- 10.3.1. Saudi Arabia
- 10.3.2. South Africa
- 10.3.3. United Arab Emirates
- 10.3.4. Qatar
- 10.3.5. Rest of Middle-East and Africa
- 10.1. Market Analysis, Insights and Forecast - by Technology
- 11. North America MEA Acrylic Adhesives Industry Analysis, Insights and Forecast, 2019-2031
- 11.1. Market Analysis, Insights and Forecast - By Country/Sub-region
- 11.1.1 United States
- 11.1.2 Canada
- 11.1.3 Mexico
- 12. Europe MEA Acrylic Adhesives Industry Analysis, Insights and Forecast, 2019-2031
- 12.1. Market Analysis, Insights and Forecast - By Country/Sub-region
- 12.1.1 Germany
- 12.1.2 United Kingdom
- 12.1.3 France
- 12.1.4 Spain
- 12.1.5 Italy
- 12.1.6 Spain
- 12.1.7 Belgium
- 12.1.8 Netherland
- 12.1.9 Nordics
- 12.1.10 Rest of Europe
- 13. Asia Pacific MEA Acrylic Adhesives Industry Analysis, Insights and Forecast, 2019-2031
- 13.1. Market Analysis, Insights and Forecast - By Country/Sub-region
- 13.1.1 China
- 13.1.2 Japan
- 13.1.3 India
- 13.1.4 South Korea
- 13.1.5 Southeast Asia
- 13.1.6 Australia
- 13.1.7 Indonesia
- 13.1.8 Phillipes
- 13.1.9 Singapore
- 13.1.10 Thailandc
- 13.1.11 Rest of Asia Pacific
- 14. South America MEA Acrylic Adhesives Industry Analysis, Insights and Forecast, 2019-2031
- 14.1. Market Analysis, Insights and Forecast - By Country/Sub-region
- 14.1.1 Brazil
- 14.1.2 Argentina
- 14.1.3 Peru
- 14.1.4 Chile
- 14.1.5 Colombia
- 14.1.6 Ecuador
- 14.1.7 Venezuela
- 14.1.8 Rest of South America
- 15. MEA MEA Acrylic Adhesives Industry Analysis, Insights and Forecast, 2019-2031
- 15.1. Market Analysis, Insights and Forecast - By Country/Sub-region
- 15.1.1 United Arab Emirates
- 15.1.2 Saudi Arabia
- 15.1.3 South Africa
- 15.1.4 Rest of Middle East and Africa
- 16. Competitive Analysis
- 16.1. Global Market Share Analysis 2024
- 16.2. Company Profiles
- 16.2.1 Henkel AG & Co KGaA
- 16.2.1.1. Overview
- 16.2.1.2. Products
- 16.2.1.3. SWOT Analysis
- 16.2.1.4. Recent Developments
- 16.2.1.5. Financials (Based on Availability)
- 16.2.2 H B Fuller
- 16.2.2.1. Overview
- 16.2.2.2. Products
- 16.2.2.3. SWOT Analysis
- 16.2.2.4. Recent Developments
- 16.2.2.5. Financials (Based on Availability)
- 16.2.3 Paramelt B V
- 16.2.3.1. Overview
- 16.2.3.2. Products
- 16.2.3.3. SWOT Analysis
- 16.2.3.4. Recent Developments
- 16.2.3.5. Financials (Based on Availability)
- 16.2.4 Pidilite Industries Ltd
- 16.2.4.1. Overview
- 16.2.4.2. Products
- 16.2.4.3. SWOT Analysis
- 16.2.4.4. Recent Developments
- 16.2.4.5. Financials (Based on Availability)
- 16.2.5 3M
- 16.2.5.1. Overview
- 16.2.5.2. Products
- 16.2.5.3. SWOT Analysis
- 16.2.5.4. Recent Developments
- 16.2.5.5. Financials (Based on Availability)
- 16.2.6 Mapei Inc
- 16.2.6.1. Overview
- 16.2.6.2. Products
- 16.2.6.3. SWOT Analysis
- 16.2.6.4. Recent Developments
- 16.2.6.5. Financials (Based on Availability)
- 16.2.7 Dymax Corporation
- 16.2.7.1. Overview
- 16.2.7.2. Products
- 16.2.7.3. SWOT Analysis
- 16.2.7.4. Recent Developments
- 16.2.7.5. Financials (Based on Availability)
- 16.2.8 Jowat AG
- 16.2.8.1. Overview
- 16.2.8.2. Products
- 16.2.8.3. SWOT Analysis
- 16.2.8.4. Recent Developments
- 16.2.8.5. Financials (Based on Availability)
- 16.2.9 Ashland
- 16.2.9.1. Overview
- 16.2.9.2. Products
- 16.2.9.3. SWOT Analysis
- 16.2.9.4. Recent Developments
- 16.2.9.5. Financials (Based on Availability)
- 16.2.10 Arkema Group
- 16.2.10.1. Overview
- 16.2.10.2. Products
- 16.2.10.3. SWOT Analysis
- 16.2.10.4. Recent Developments
- 16.2.10.5. Financials (Based on Availability)
- 16.2.11 Huntsman International LLC
- 16.2.11.1. Overview
- 16.2.11.2. Products
- 16.2.11.3. SWOT Analysis
- 16.2.11.4. Recent Developments
- 16.2.11.5. Financials (Based on Availability)
- 16.2.12 Tesa SE (A Beiersdorf Company)
- 16.2.12.1. Overview
- 16.2.12.2. Products
- 16.2.12.3. SWOT Analysis
- 16.2.12.4. Recent Developments
- 16.2.12.5. Financials (Based on Availability)
- 16.2.13 ITW Performance Polymers (Illinois Tool Works Inc )
- 16.2.13.1. Overview
- 16.2.13.2. Products
- 16.2.13.3. SWOT Analysis
- 16.2.13.4. Recent Developments
- 16.2.13.5. Financials (Based on Availability)
- 16.2.14 MUNZING Corporation
- 16.2.14.1. Overview
- 16.2.14.2. Products
- 16.2.14.3. SWOT Analysis
- 16.2.14.4. Recent Developments
- 16.2.14.5. Financials (Based on Availability)
- 16.2.15 Beardow Adams
- 16.2.15.1. Overview
- 16.2.15.2. Products
- 16.2.15.3. SWOT Analysis
- 16.2.15.4. Recent Developments
- 16.2.15.5. Financials (Based on Availability)
- 16.2.16 DuPont
- 16.2.16.1. Overview
- 16.2.16.2. Products
- 16.2.16.3. SWOT Analysis
- 16.2.16.4. Recent Developments
- 16.2.16.5. Financials (Based on Availability)
- 16.2.17 Dow
- 16.2.17.1. Overview
- 16.2.17.2. Products
- 16.2.17.3. SWOT Analysis
- 16.2.17.4. Recent Developments
- 16.2.17.5. Financials (Based on Availability)
- 16.2.18 Avery Dennison Corporation
- 16.2.18.1. Overview
- 16.2.18.2. Products
- 16.2.18.3. SWOT Analysis
- 16.2.18.4. Recent Developments
- 16.2.18.5. Financials (Based on Availability)
- 16.2.19 Hexion
- 16.2.19.1. Overview
- 16.2.19.2. Products
- 16.2.19.3. SWOT Analysis
- 16.2.19.4. Recent Developments
- 16.2.19.5. Financials (Based on Availability)
- 16.2.20 Franklin International
- 16.2.20.1. Overview
- 16.2.20.2. Products
- 16.2.20.3. SWOT Analysis
- 16.2.20.4. Recent Developments
- 16.2.20.5. Financials (Based on Availability)
- 16.2.21 Adhesives Research Inc
- 16.2.21.1. Overview
- 16.2.21.2. Products
- 16.2.21.3. SWOT Analysis
- 16.2.21.4. Recent Developments
- 16.2.21.5. Financials (Based on Availability)
- 16.2.22 Sika AG
- 16.2.22.1. Overview
- 16.2.22.2. Products
- 16.2.22.3. SWOT Analysis
- 16.2.22.4. Recent Developments
- 16.2.22.5. Financials (Based on Availability)
- 16.2.23 Collano AG
- 16.2.23.1. Overview
- 16.2.23.2. Products
- 16.2.23.3. SWOT Analysis
- 16.2.23.4. Recent Developments
- 16.2.23.5. Financials (Based on Availability)
- 16.2.24 Permabond LLC
- 16.2.24.1. Overview
- 16.2.24.2. Products
- 16.2.24.3. SWOT Analysis
- 16.2.24.4. Recent Developments
- 16.2.24.5. Financials (Based on Availability)
- 16.2.25 Wacker Chemie AG*List Not Exhaustive
- 16.2.25.1. Overview
- 16.2.25.2. Products
- 16.2.25.3. SWOT Analysis
- 16.2.25.4. Recent Developments
- 16.2.25.5. Financials (Based on Availability)
- 16.2.1 Henkel AG & Co KGaA
List of Figures
- Figure 1: Global MEA Acrylic Adhesives Industry Revenue Breakdown (Million, %) by Region 2024 & 2032
- Figure 2: North America MEA Acrylic Adhesives Industry Revenue (Million), by Country 2024 & 2032
- Figure 3: North America MEA Acrylic Adhesives Industry Revenue Share (%), by Country 2024 & 2032
- Figure 4: Europe MEA Acrylic Adhesives Industry Revenue (Million), by Country 2024 & 2032
- Figure 5: Europe MEA Acrylic Adhesives Industry Revenue Share (%), by Country 2024 & 2032
- Figure 6: Asia Pacific MEA Acrylic Adhesives Industry Revenue (Million), by Country 2024 & 2032
- Figure 7: Asia Pacific MEA Acrylic Adhesives Industry Revenue Share (%), by Country 2024 & 2032
- Figure 8: South America MEA Acrylic Adhesives Industry Revenue (Million), by Country 2024 & 2032
- Figure 9: South America MEA Acrylic Adhesives Industry Revenue Share (%), by Country 2024 & 2032
- Figure 10: MEA MEA Acrylic Adhesives Industry Revenue (Million), by Country 2024 & 2032
- Figure 11: MEA MEA Acrylic Adhesives Industry Revenue Share (%), by Country 2024 & 2032
- Figure 12: Saudi Arabia MEA Acrylic Adhesives Industry Revenue (Million), by Technology 2024 & 2032
- Figure 13: Saudi Arabia MEA Acrylic Adhesives Industry Revenue Share (%), by Technology 2024 & 2032
- Figure 14: Saudi Arabia MEA Acrylic Adhesives Industry Revenue (Million), by End-user Industry 2024 & 2032
- Figure 15: Saudi Arabia MEA Acrylic Adhesives Industry Revenue Share (%), by End-user Industry 2024 & 2032
- Figure 16: Saudi Arabia MEA Acrylic Adhesives Industry Revenue (Million), by Geography 2024 & 2032
- Figure 17: Saudi Arabia MEA Acrylic Adhesives Industry Revenue Share (%), by Geography 2024 & 2032
- Figure 18: Saudi Arabia MEA Acrylic Adhesives Industry Revenue (Million), by Country 2024 & 2032
- Figure 19: Saudi Arabia MEA Acrylic Adhesives Industry Revenue Share (%), by Country 2024 & 2032
- Figure 20: South Africa MEA Acrylic Adhesives Industry Revenue (Million), by Technology 2024 & 2032
- Figure 21: South Africa MEA Acrylic Adhesives Industry Revenue Share (%), by Technology 2024 & 2032
- Figure 22: South Africa MEA Acrylic Adhesives Industry Revenue (Million), by End-user Industry 2024 & 2032
- Figure 23: South Africa MEA Acrylic Adhesives Industry Revenue Share (%), by End-user Industry 2024 & 2032
- Figure 24: South Africa MEA Acrylic Adhesives Industry Revenue (Million), by Geography 2024 & 2032
- Figure 25: South Africa MEA Acrylic Adhesives Industry Revenue Share (%), by Geography 2024 & 2032
- Figure 26: South Africa MEA Acrylic Adhesives Industry Revenue (Million), by Country 2024 & 2032
- Figure 27: South Africa MEA Acrylic Adhesives Industry Revenue Share (%), by Country 2024 & 2032
- Figure 28: United Arab Emirates MEA Acrylic Adhesives Industry Revenue (Million), by Technology 2024 & 2032
- Figure 29: United Arab Emirates MEA Acrylic Adhesives Industry Revenue Share (%), by Technology 2024 & 2032
- Figure 30: United Arab Emirates MEA Acrylic Adhesives Industry Revenue (Million), by End-user Industry 2024 & 2032
- Figure 31: United Arab Emirates MEA Acrylic Adhesives Industry Revenue Share (%), by End-user Industry 2024 & 2032
- Figure 32: United Arab Emirates MEA Acrylic Adhesives Industry Revenue (Million), by Geography 2024 & 2032
- Figure 33: United Arab Emirates MEA Acrylic Adhesives Industry Revenue Share (%), by Geography 2024 & 2032
- Figure 34: United Arab Emirates MEA Acrylic Adhesives Industry Revenue (Million), by Country 2024 & 2032
- Figure 35: United Arab Emirates MEA Acrylic Adhesives Industry Revenue Share (%), by Country 2024 & 2032
- Figure 36: Qatar MEA Acrylic Adhesives Industry Revenue (Million), by Technology 2024 & 2032
- Figure 37: Qatar MEA Acrylic Adhesives Industry Revenue Share (%), by Technology 2024 & 2032
- Figure 38: Qatar MEA Acrylic Adhesives Industry Revenue (Million), by End-user Industry 2024 & 2032
- Figure 39: Qatar MEA Acrylic Adhesives Industry Revenue Share (%), by End-user Industry 2024 & 2032
- Figure 40: Qatar MEA Acrylic Adhesives Industry Revenue (Million), by Geography 2024 & 2032
- Figure 41: Qatar MEA Acrylic Adhesives Industry Revenue Share (%), by Geography 2024 & 2032
- Figure 42: Qatar MEA Acrylic Adhesives Industry Revenue (Million), by Country 2024 & 2032
- Figure 43: Qatar MEA Acrylic Adhesives Industry Revenue Share (%), by Country 2024 & 2032
- Figure 44: Rest of Middle East and Africa MEA Acrylic Adhesives Industry Revenue (Million), by Technology 2024 & 2032
- Figure 45: Rest of Middle East and Africa MEA Acrylic Adhesives Industry Revenue Share (%), by Technology 2024 & 2032
- Figure 46: Rest of Middle East and Africa MEA Acrylic Adhesives Industry Revenue (Million), by End-user Industry 2024 & 2032
- Figure 47: Rest of Middle East and Africa MEA Acrylic Adhesives Industry Revenue Share (%), by End-user Industry 2024 & 2032
- Figure 48: Rest of Middle East and Africa MEA Acrylic Adhesives Industry Revenue (Million), by Geography 2024 & 2032
- Figure 49: Rest of Middle East and Africa MEA Acrylic Adhesives Industry Revenue Share (%), by Geography 2024 & 2032
- Figure 50: Rest of Middle East and Africa MEA Acrylic Adhesives Industry Revenue (Million), by Country 2024 & 2032
- Figure 51: Rest of Middle East and Africa MEA Acrylic Adhesives Industry Revenue Share (%), by Country 2024 & 2032
List of Tables
- Table 1: Global MEA Acrylic Adhesives Industry Revenue Million Forecast, by Region 2019 & 2032
- Table 2: Global MEA Acrylic Adhesives Industry Revenue Million Forecast, by Technology 2019 & 2032
- Table 3: Global MEA Acrylic Adhesives Industry Revenue Million Forecast, by End-user Industry 2019 & 2032
- Table 4: Global MEA Acrylic Adhesives Industry Revenue Million Forecast, by Geography 2019 & 2032
- Table 5: Global MEA Acrylic Adhesives Industry Revenue Million Forecast, by Region 2019 & 2032
- Table 6: Global MEA Acrylic Adhesives Industry Revenue Million Forecast, by Country 2019 & 2032
- Table 7: United States MEA Acrylic Adhesives Industry Revenue (Million) Forecast, by Application 2019 & 2032
- Table 8: Canada MEA Acrylic Adhesives Industry Revenue (Million) Forecast, by Application 2019 & 2032
- Table 9: Mexico MEA Acrylic Adhesives Industry Revenue (Million) Forecast, by Application 2019 & 2032
- Table 10: Global MEA Acrylic Adhesives Industry Revenue Million Forecast, by Country 2019 & 2032
- Table 11: Germany MEA Acrylic Adhesives Industry Revenue (Million) Forecast, by Application 2019 & 2032
- Table 12: United Kingdom MEA Acrylic Adhesives Industry Revenue (Million) Forecast, by Application 2019 & 2032
- Table 13: France MEA Acrylic Adhesives Industry Revenue (Million) Forecast, by Application 2019 & 2032
- Table 14: Spain MEA Acrylic Adhesives Industry Revenue (Million) Forecast, by Application 2019 & 2032
- Table 15: Italy MEA Acrylic Adhesives Industry Revenue (Million) Forecast, by Application 2019 & 2032
- Table 16: Spain MEA Acrylic Adhesives Industry Revenue (Million) Forecast, by Application 2019 & 2032
- Table 17: Belgium MEA Acrylic Adhesives Industry Revenue (Million) Forecast, by Application 2019 & 2032
- Table 18: Netherland MEA Acrylic Adhesives Industry Revenue (Million) Forecast, by Application 2019 & 2032
- Table 19: Nordics MEA Acrylic Adhesives Industry Revenue (Million) Forecast, by Application 2019 & 2032
- Table 20: Rest of Europe MEA Acrylic Adhesives Industry Revenue (Million) Forecast, by Application 2019 & 2032
- Table 21: Global MEA Acrylic Adhesives Industry Revenue Million Forecast, by Country 2019 & 2032
- Table 22: China MEA Acrylic Adhesives Industry Revenue (Million) Forecast, by Application 2019 & 2032
- Table 23: Japan MEA Acrylic Adhesives Industry Revenue (Million) Forecast, by Application 2019 & 2032
- Table 24: India MEA Acrylic Adhesives Industry Revenue (Million) Forecast, by Application 2019 & 2032
- Table 25: South Korea MEA Acrylic Adhesives Industry Revenue (Million) Forecast, by Application 2019 & 2032
- Table 26: Southeast Asia MEA Acrylic Adhesives Industry Revenue (Million) Forecast, by Application 2019 & 2032
- Table 27: Australia MEA Acrylic Adhesives Industry Revenue (Million) Forecast, by Application 2019 & 2032
- Table 28: Indonesia MEA Acrylic Adhesives Industry Revenue (Million) Forecast, by Application 2019 & 2032
- Table 29: Phillipes MEA Acrylic Adhesives Industry Revenue (Million) Forecast, by Application 2019 & 2032
- Table 30: Singapore MEA Acrylic Adhesives Industry Revenue (Million) Forecast, by Application 2019 & 2032
- Table 31: Thailandc MEA Acrylic Adhesives Industry Revenue (Million) Forecast, by Application 2019 & 2032
- Table 32: Rest of Asia Pacific MEA Acrylic Adhesives Industry Revenue (Million) Forecast, by Application 2019 & 2032
- Table 33: Global MEA Acrylic Adhesives Industry Revenue Million Forecast, by Country 2019 & 2032
- Table 34: Brazil MEA Acrylic Adhesives Industry Revenue (Million) Forecast, by Application 2019 & 2032
- Table 35: Argentina MEA Acrylic Adhesives Industry Revenue (Million) Forecast, by Application 2019 & 2032
- Table 36: Peru MEA Acrylic Adhesives Industry Revenue (Million) Forecast, by Application 2019 & 2032
- Table 37: Chile MEA Acrylic Adhesives Industry Revenue (Million) Forecast, by Application 2019 & 2032
- Table 38: Colombia MEA Acrylic Adhesives Industry Revenue (Million) Forecast, by Application 2019 & 2032
- Table 39: Ecuador MEA Acrylic Adhesives Industry Revenue (Million) Forecast, by Application 2019 & 2032
- Table 40: Venezuela MEA Acrylic Adhesives Industry Revenue (Million) Forecast, by Application 2019 & 2032
- Table 41: Rest of South America MEA Acrylic Adhesives Industry Revenue (Million) Forecast, by Application 2019 & 2032
- Table 42: Global MEA Acrylic Adhesives Industry Revenue Million Forecast, by Country 2019 & 2032
- Table 43: United Arab Emirates MEA Acrylic Adhesives Industry Revenue (Million) Forecast, by Application 2019 & 2032
- Table 44: Saudi Arabia MEA Acrylic Adhesives Industry Revenue (Million) Forecast, by Application 2019 & 2032
- Table 45: South Africa MEA Acrylic Adhesives Industry Revenue (Million) Forecast, by Application 2019 & 2032
- Table 46: Rest of Middle East and Africa MEA Acrylic Adhesives Industry Revenue (Million) Forecast, by Application 2019 & 2032
- Table 47: Global MEA Acrylic Adhesives Industry Revenue Million Forecast, by Technology 2019 & 2032
- Table 48: Global MEA Acrylic Adhesives Industry Revenue Million Forecast, by End-user Industry 2019 & 2032
- Table 49: Global MEA Acrylic Adhesives Industry Revenue Million Forecast, by Geography 2019 & 2032
- Table 50: Global MEA Acrylic Adhesives Industry Revenue Million Forecast, by Country 2019 & 2032
- Table 51: Global MEA Acrylic Adhesives Industry Revenue Million Forecast, by Technology 2019 & 2032
- Table 52: Global MEA Acrylic Adhesives Industry Revenue Million Forecast, by End-user Industry 2019 & 2032
- Table 53: Global MEA Acrylic Adhesives Industry Revenue Million Forecast, by Geography 2019 & 2032
- Table 54: Global MEA Acrylic Adhesives Industry Revenue Million Forecast, by Country 2019 & 2032
- Table 55: Global MEA Acrylic Adhesives Industry Revenue Million Forecast, by Technology 2019 & 2032
- Table 56: Global MEA Acrylic Adhesives Industry Revenue Million Forecast, by End-user Industry 2019 & 2032
- Table 57: Global MEA Acrylic Adhesives Industry Revenue Million Forecast, by Geography 2019 & 2032
- Table 58: Global MEA Acrylic Adhesives Industry Revenue Million Forecast, by Country 2019 & 2032
- Table 59: Global MEA Acrylic Adhesives Industry Revenue Million Forecast, by Technology 2019 & 2032
- Table 60: Global MEA Acrylic Adhesives Industry Revenue Million Forecast, by End-user Industry 2019 & 2032
- Table 61: Global MEA Acrylic Adhesives Industry Revenue Million Forecast, by Geography 2019 & 2032
- Table 62: Global MEA Acrylic Adhesives Industry Revenue Million Forecast, by Country 2019 & 2032
- Table 63: Global MEA Acrylic Adhesives Industry Revenue Million Forecast, by Technology 2019 & 2032
- Table 64: Global MEA Acrylic Adhesives Industry Revenue Million Forecast, by End-user Industry 2019 & 2032
- Table 65: Global MEA Acrylic Adhesives Industry Revenue Million Forecast, by Geography 2019 & 2032
- Table 66: Global MEA Acrylic Adhesives Industry Revenue Million Forecast, by Country 2019 & 2032
Frequently Asked Questions
1. What is the projected Compound Annual Growth Rate (CAGR) of the MEA Acrylic Adhesives Industry?
The projected CAGR is approximately > 4.00%.
2. Which companies are prominent players in the MEA Acrylic Adhesives Industry?
Key companies in the market include Henkel AG & Co KGaA, H B Fuller, Paramelt B V, Pidilite Industries Ltd, 3M, Mapei Inc, Dymax Corporation, Jowat AG, Ashland, Arkema Group, Huntsman International LLC, Tesa SE (A Beiersdorf Company), ITW Performance Polymers (Illinois Tool Works Inc ), MUNZING Corporation, Beardow Adams, DuPont, Dow, Avery Dennison Corporation, Hexion, Franklin International, Adhesives Research Inc, Sika AG, Collano AG, Permabond LLC, Wacker Chemie AG*List Not Exhaustive.
3. What are the main segments of the MEA Acrylic Adhesives Industry?
The market segments include Technology, End-user Industry, Geography.
4. Can you provide details about the market size?
The market size is estimated to be USD XX Million as of 2022.
5. What are some drivers contributing to market growth?
; High Packaging Demand from Food & Beverage Industry; Robust Growth of Construction Industry.
6. What are the notable trends driving market growth?
Packaging Industry to Drive the Market Demand.
7. Are there any restraints impacting market growth?
; Availability of Alternative Feedstocks for Adhesives; Stringent Environmental Regulations Regarding VOC Emissions.
8. Can you provide examples of recent developments in the market?
N/A
9. What pricing options are available for accessing the report?
Pricing options include single-user, multi-user, and enterprise licenses priced at USD 4750, USD 5250, and USD 8750 respectively.
10. Is the market size provided in terms of value or volume?
The market size is provided in terms of value, measured in Million.
11. Are there any specific market keywords associated with the report?
Yes, the market keyword associated with the report is "MEA Acrylic Adhesives Industry," which aids in identifying and referencing the specific market segment covered.
12. How do I determine which pricing option suits my needs best?
The pricing options vary based on user requirements and access needs. Individual users may opt for single-user licenses, while businesses requiring broader access may choose multi-user or enterprise licenses for cost-effective access to the report.
13. Are there any additional resources or data provided in the MEA Acrylic Adhesives Industry report?
While the report offers comprehensive insights, it's advisable to review the specific contents or supplementary materials provided to ascertain if additional resources or data are available.
14. How can I stay updated on further developments or reports in the MEA Acrylic Adhesives Industry?
To stay informed about further developments, trends, and reports in the MEA Acrylic Adhesives Industry, consider subscribing to industry newsletters, following relevant companies and organizations, or regularly checking reputable industry news sources and publications.
Methodology
Step 1 - Identification of Relevant Samples Size from Population Database


Step 2 - Approaches for Defining Global Market Size (Value, Volume* & Price*)

Note*: In applicable scenarios
Step 3 - Data Sources
Primary Research
- Web Analytics
- Survey Reports
- Research Institute
- Latest Research Reports
- Opinion Leaders
Secondary Research
- Annual Reports
- White Paper
- Latest Press Release
- Industry Association
- Paid Database
- Investor Presentations

Step 4 - Data Triangulation
Involves using different sources of information in order to increase the validity of a study
These sources are likely to be stakeholders in a program - participants, other researchers, program staff, other community members, and so on.
Then we put all data in single framework & apply various statistical tools to find out the dynamic on the market.
During the analysis stage, feedback from the stakeholder groups would be compared to determine areas of agreement as well as areas of divergence


