

Key Insights
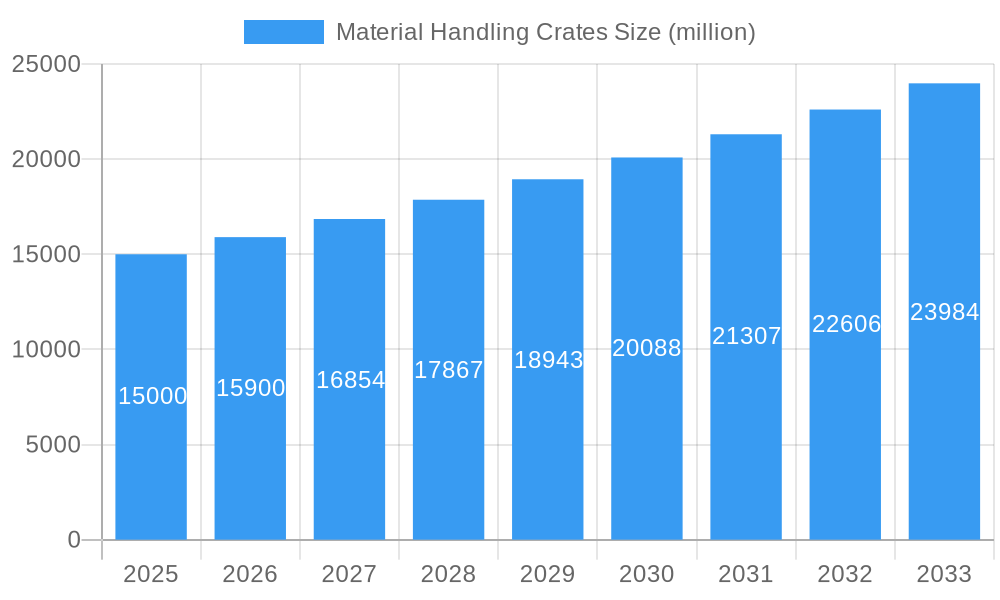
The global material handling crates market is poised for significant expansion, projected to reach $5.9 billion by 2025, with a Compound Annual Growth Rate (CAGR) of 4.2% from 2025 to 2033. This robust growth is primarily propelled by the escalating e-commerce sector, increasing industrial automation, and the persistent demand for optimized supply chain solutions. The surge in online retail necessitates durable and efficient packaging for product transit, thereby elevating the demand for reusable and recyclable material handling crates. Concurrently, advancements in warehouse automation and robotics are streamlining storage and handling operations, further driving the adoption of standardized, automation-compatible crates. A growing emphasis on sustainability is also a key market influencer, encouraging businesses to integrate eco-friendly materials and reusable crate systems to mitigate their environmental footprint.
Material Handling Crates Market Size (In Billion)
Despite these positive trends, market expansion faces certain constraints. Volatile raw material costs, especially for plastics, directly affect production expenses and profit margins. Geopolitical uncertainties and supply chain disruptions can introduce unpredictability. The competitive landscape, characterized by numerous established and emerging players, mandates continuous innovation in crate design, materials, and functionality to secure and grow market share. Nonetheless, the long-term outlook for the material handling crates market remains optimistic, supported by ongoing advancements in logistics efficiency, the adoption of sustainable practices, and the sustained growth of global commerce. The market is segmented by material type (plastic, wood, metal), size, and end-use industry (food and beverage, automotive, manufacturing). Leading companies are actively investing in research and development to refine their product portfolios and expand their market presence. Regional growth trajectories will likely vary, with North America and Europe currently dominating, while the Asia-Pacific region is anticipated to experience substantial growth.
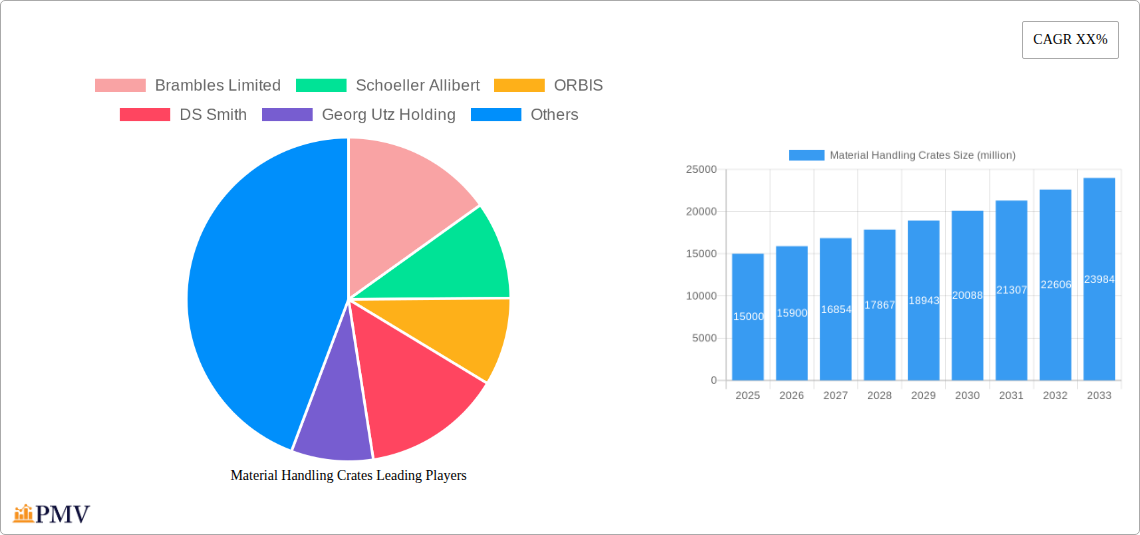
Material Handling Crates Company Market Share
Material Handling Crates Market Report: 2019-2033 - A Comprehensive Analysis of a Multi-Billion Dollar Industry
This in-depth report provides a comprehensive analysis of the global Material Handling Crates market, offering invaluable insights for businesses seeking to navigate this dynamic landscape. The study period spans from 2019 to 2033, with a base year of 2025 and a forecast period extending to 2033. The report leverages extensive primary and secondary research to uncover key trends, growth drivers, challenges, and opportunities within the multi-billion dollar material handling crates sector. This analysis covers various material types, including plastic, wood, and metal, across diverse end-use industries. Expect detailed assessments of market segmentation, competitive dynamics, and future projections, empowering informed strategic decision-making. This report projects a market size exceeding $XX billion by 2033.
Material Handling Crates Market Structure & Competitive Dynamics
The global material handling crates market exhibits a moderately concentrated structure, with several key players holding significant market share. Brambles Limited, Schoeller Allibert, and ORBIS are among the leading companies, collectively commanding an estimated xx% of the market in 2025. Smaller players, including regional manufacturers like Suzhou Dasen Plastic and Zhejiang Zhengji Plastic, cater to niche segments and geographical areas.
The market's competitive landscape is characterized by intense innovation, with companies focusing on developing lightweight, durable, and reusable crates to meet evolving customer demands. Regulatory frameworks concerning material sourcing, sustainability, and waste management significantly influence market dynamics. Product substitution is a factor, with alternative packaging solutions posing a challenge, although the inherent strength and versatility of crates maintain their dominance in specific applications.
End-user trends, especially within logistics and e-commerce, are driving demand for standardized, stackable, and easily automated crates. Mergers and acquisitions (M&A) activity has been moderate in recent years, with deal values totaling approximately $XX billion during the historical period (2019-2024). Future M&A activity is anticipated to consolidate the industry further, potentially leading to greater economies of scale and increased market concentration. The report details specific M&A transactions, their impact, and projections for future activity.
Material Handling Crates Industry Trends & Insights
The material handling crates market is experiencing robust growth, driven by several key factors. The rising popularity of e-commerce and the expansion of global supply chains have significantly increased demand for efficient and reliable packaging solutions. Technological advancements, such as the integration of RFID tags and smart sensors into crates, are enhancing traceability and improving supply chain visibility. Consumer preferences are shifting towards sustainable and eco-friendly options, prompting manufacturers to develop recyclable and reusable crate solutions.
The Compound Annual Growth Rate (CAGR) for the global material handling crates market is projected to be xx% during the forecast period (2025-2033), with market penetration expected to reach xx% in key regions by 2033. Competitive dynamics are shaping the market, with companies increasingly focusing on offering customized solutions and value-added services such as crate pooling and management programs. The report provides a comprehensive analysis of these trends, including detailed regional and segment-wise breakdowns.
Dominant Markets & Segments in Material Handling Crates
The Asia-Pacific region, particularly China and India, represents a dominant market for material handling crates, driven by robust economic growth, expanding industrialization, and burgeoning e-commerce sectors. Europe and North America also hold significant market shares, although growth rates may be comparatively slower.
- Key Drivers in Asia-Pacific: Rapid industrialization, rising disposable incomes, expanding e-commerce, favorable government policies promoting manufacturing and logistics.
- Key Drivers in Europe: Strong manufacturing base, robust logistics infrastructure, focus on sustainable packaging solutions.
- Key Drivers in North America: Growth in e-commerce, focus on supply chain optimization, increasing demand for reusable packaging.
The dominance of the Asia-Pacific region is attributed to a multitude of factors, including lower manufacturing costs, a large and growing consumer base, and a rapidly expanding logistics infrastructure. The report provides detailed analysis of market size, growth rate, and competitive landscape for each major region.
Material Handling Crates Product Innovations
Recent innovations in material handling crates focus on enhancing durability, sustainability, and efficiency. The integration of smart technologies like RFID and GPS tracking allows for real-time monitoring and improved supply chain management. Lightweight, high-strength materials like recycled plastics are increasingly being used to reduce environmental impact and transportation costs. Modular and customizable crate designs are gaining popularity, allowing businesses to optimize their packaging solutions for specific needs. This adaptability extends to stacking capabilities, minimizing warehousing space.
Report Segmentation & Scope
The report segments the material handling crates market based on material type (plastic, wood, metal, others), application (food & beverage, automotive, consumer goods, pharmaceuticals, industrial goods), and region (North America, Europe, Asia-Pacific, South America, Middle East & Africa). Each segment is analyzed in detail, including market size, growth projections, and competitive dynamics. For instance, the plastic crates segment is projected to witness the highest growth due to its lightweight, durability, and recyclability.
Key Drivers of Material Handling Crates Growth
The growth of the material handling crates market is propelled by several key factors: the rise of e-commerce and its associated demand for efficient packaging, the increasing adoption of automation and robotics in warehouses and distribution centers, the growing need for supply chain optimization and improved traceability, stringent regulations aimed at reducing waste and promoting sustainability, and expansion into developing economies with growing industrial and manufacturing sectors.
Challenges in the Material Handling Crates Sector
Challenges within the material handling crates sector include fluctuations in raw material prices, increasing transportation costs, intense competition from alternative packaging solutions, strict environmental regulations and sustainability concerns necessitating investments in eco-friendly materials, and the need to adapt to evolving industry standards and technological advancements. These factors can impact profitability and hinder market expansion if not addressed proactively.
Leading Players in the Material Handling Crates Market
- Brambles Limited
- Schoeller Allibert
- ORBIS
- DS Smith
- Georg Utz Holding
- Didak Injection
- Suzhou Dasen Plastic
- Suzhou First Plastic
- RGE Group
- Mexican Technical Plastics (PTM)
- Shenzhen Xingfeng Plastic
- Supreme Industries
- Nilkamal
- Mpact Limited
- Rehrig Pacific Company
- Delbrouck
- Myers Industries
- Zhejiang Zhengji Plastic
- Cherry Plastic
- Plastimer Industrial Corp.
Key Developments in Material Handling Crates Sector
- Q1 2022: Brambles Limited launches a new line of sustainable plastic crates made from recycled materials.
- Q3 2023: Schoeller Allibert acquires a smaller competitor, expanding its market share in Europe.
- Q4 2024: A significant investment in automated crate handling systems is announced by a major logistics company. (Specific company name is omitted for confidentiality)
Strategic Material Handling Crates Market Outlook
The material handling crates market presents significant growth potential in the coming years, driven by the continued expansion of e-commerce, the growing focus on supply chain optimization, and the increasing adoption of sustainable packaging solutions. Strategic opportunities exist for companies to invest in innovative technologies, expand into new markets, and develop customized solutions to meet the specific needs of various industries. The market's future trajectory is positive, with considerable room for growth and expansion.
Material Handling Crates Segmentation
-
1. Application
- 1.1. Retail
- 1.2. Food Industry
- 1.3. Catering Industry
- 1.4. Medical Industry
- 1.5. Agriculture & Seafood
- 1.6. Electronics
- 1.7. Others
-
2. Types
- 2.1. PP
- 2.2. PE
- 2.3. PVC
- 2.4. Others
Material Handling Crates Segmentation By Geography
-
1. North America
- 1.1. United States
- 1.2. Canada
- 1.3. Mexico
-
2. South America
- 2.1. Brazil
- 2.2. Argentina
- 2.3. Rest of South America
-
3. Europe
- 3.1. United Kingdom
- 3.2. Germany
- 3.3. France
- 3.4. Italy
- 3.5. Spain
- 3.6. Russia
- 3.7. Benelux
- 3.8. Nordics
- 3.9. Rest of Europe
-
4. Middle East & Africa
- 4.1. Turkey
- 4.2. Israel
- 4.3. GCC
- 4.4. North Africa
- 4.5. South Africa
- 4.6. Rest of Middle East & Africa
-
5. Asia Pacific
- 5.1. China
- 5.2. India
- 5.3. Japan
- 5.4. South Korea
- 5.5. ASEAN
- 5.6. Oceania
- 5.7. Rest of Asia Pacific

Material Handling Crates Regional Market Share
Geographic Coverage of Material Handling Crates
Material Handling Crates REPORT HIGHLIGHTS
| Aspects | Details |
|---|---|
| Study Period | 2020-2034 |
| Base Year | 2025 |
| Estimated Year | 2026 |
| Forecast Period | 2026-2034 |
| Historical Period | 2020-2025 |
| Growth Rate | CAGR of 4.2% from 2020-2034 |
| Segmentation |
|
Table of Contents
- 1. Introduction
- 1.1. Research Scope
- 1.2. Market Segmentation
- 1.3. Research Methodology
- 1.4. Definitions and Assumptions
- 2. Executive Summary
- 2.1. Introduction
- 3. Market Dynamics
- 3.1. Introduction
- 3.2. Market Drivers
- 3.3. Market Restrains
- 3.4. Market Trends
- 4. Market Factor Analysis
- 4.1. Porters Five Forces
- 4.2. Supply/Value Chain
- 4.3. PESTEL analysis
- 4.4. Market Entropy
- 4.5. Patent/Trademark Analysis
- 5. Global Material Handling Crates Analysis, Insights and Forecast, 2020-2032
- 5.1. Market Analysis, Insights and Forecast - by Application
- 5.1.1. Retail
- 5.1.2. Food Industry
- 5.1.3. Catering Industry
- 5.1.4. Medical Industry
- 5.1.5. Agriculture & Seafood
- 5.1.6. Electronics
- 5.1.7. Others
- 5.2. Market Analysis, Insights and Forecast - by Types
- 5.2.1. PP
- 5.2.2. PE
- 5.2.3. PVC
- 5.2.4. Others
- 5.3. Market Analysis, Insights and Forecast - by Region
- 5.3.1. North America
- 5.3.2. South America
- 5.3.3. Europe
- 5.3.4. Middle East & Africa
- 5.3.5. Asia Pacific
- 5.1. Market Analysis, Insights and Forecast - by Application
- 6. North America Material Handling Crates Analysis, Insights and Forecast, 2020-2032
- 6.1. Market Analysis, Insights and Forecast - by Application
- 6.1.1. Retail
- 6.1.2. Food Industry
- 6.1.3. Catering Industry
- 6.1.4. Medical Industry
- 6.1.5. Agriculture & Seafood
- 6.1.6. Electronics
- 6.1.7. Others
- 6.2. Market Analysis, Insights and Forecast - by Types
- 6.2.1. PP
- 6.2.2. PE
- 6.2.3. PVC
- 6.2.4. Others
- 6.1. Market Analysis, Insights and Forecast - by Application
- 7. South America Material Handling Crates Analysis, Insights and Forecast, 2020-2032
- 7.1. Market Analysis, Insights and Forecast - by Application
- 7.1.1. Retail
- 7.1.2. Food Industry
- 7.1.3. Catering Industry
- 7.1.4. Medical Industry
- 7.1.5. Agriculture & Seafood
- 7.1.6. Electronics
- 7.1.7. Others
- 7.2. Market Analysis, Insights and Forecast - by Types
- 7.2.1. PP
- 7.2.2. PE
- 7.2.3. PVC
- 7.2.4. Others
- 7.1. Market Analysis, Insights and Forecast - by Application
- 8. Europe Material Handling Crates Analysis, Insights and Forecast, 2020-2032
- 8.1. Market Analysis, Insights and Forecast - by Application
- 8.1.1. Retail
- 8.1.2. Food Industry
- 8.1.3. Catering Industry
- 8.1.4. Medical Industry
- 8.1.5. Agriculture & Seafood
- 8.1.6. Electronics
- 8.1.7. Others
- 8.2. Market Analysis, Insights and Forecast - by Types
- 8.2.1. PP
- 8.2.2. PE
- 8.2.3. PVC
- 8.2.4. Others
- 8.1. Market Analysis, Insights and Forecast - by Application
- 9. Middle East & Africa Material Handling Crates Analysis, Insights and Forecast, 2020-2032
- 9.1. Market Analysis, Insights and Forecast - by Application
- 9.1.1. Retail
- 9.1.2. Food Industry
- 9.1.3. Catering Industry
- 9.1.4. Medical Industry
- 9.1.5. Agriculture & Seafood
- 9.1.6. Electronics
- 9.1.7. Others
- 9.2. Market Analysis, Insights and Forecast - by Types
- 9.2.1. PP
- 9.2.2. PE
- 9.2.3. PVC
- 9.2.4. Others
- 9.1. Market Analysis, Insights and Forecast - by Application
- 10. Asia Pacific Material Handling Crates Analysis, Insights and Forecast, 2020-2032
- 10.1. Market Analysis, Insights and Forecast - by Application
- 10.1.1. Retail
- 10.1.2. Food Industry
- 10.1.3. Catering Industry
- 10.1.4. Medical Industry
- 10.1.5. Agriculture & Seafood
- 10.1.6. Electronics
- 10.1.7. Others
- 10.2. Market Analysis, Insights and Forecast - by Types
- 10.2.1. PP
- 10.2.2. PE
- 10.2.3. PVC
- 10.2.4. Others
- 10.1. Market Analysis, Insights and Forecast - by Application
- 11. Competitive Analysis
- 11.1. Global Market Share Analysis 2025
- 11.2. Company Profiles
- 11.2.1 Brambles Limited
- 11.2.1.1. Overview
- 11.2.1.2. Products
- 11.2.1.3. SWOT Analysis
- 11.2.1.4. Recent Developments
- 11.2.1.5. Financials (Based on Availability)
- 11.2.2 Schoeller Allibert
- 11.2.2.1. Overview
- 11.2.2.2. Products
- 11.2.2.3. SWOT Analysis
- 11.2.2.4. Recent Developments
- 11.2.2.5. Financials (Based on Availability)
- 11.2.3 ORBIS
- 11.2.3.1. Overview
- 11.2.3.2. Products
- 11.2.3.3. SWOT Analysis
- 11.2.3.4. Recent Developments
- 11.2.3.5. Financials (Based on Availability)
- 11.2.4 DS Smith
- 11.2.4.1. Overview
- 11.2.4.2. Products
- 11.2.4.3. SWOT Analysis
- 11.2.4.4. Recent Developments
- 11.2.4.5. Financials (Based on Availability)
- 11.2.5 Georg Utz Holding
- 11.2.5.1. Overview
- 11.2.5.2. Products
- 11.2.5.3. SWOT Analysis
- 11.2.5.4. Recent Developments
- 11.2.5.5. Financials (Based on Availability)
- 11.2.6 Didak Injection
- 11.2.6.1. Overview
- 11.2.6.2. Products
- 11.2.6.3. SWOT Analysis
- 11.2.6.4. Recent Developments
- 11.2.6.5. Financials (Based on Availability)
- 11.2.7 Suzhou Dasen Plastic
- 11.2.7.1. Overview
- 11.2.7.2. Products
- 11.2.7.3. SWOT Analysis
- 11.2.7.4. Recent Developments
- 11.2.7.5. Financials (Based on Availability)
- 11.2.8 Suzhou First Plastic
- 11.2.8.1. Overview
- 11.2.8.2. Products
- 11.2.8.3. SWOT Analysis
- 11.2.8.4. Recent Developments
- 11.2.8.5. Financials (Based on Availability)
- 11.2.9 RGE Group
- 11.2.9.1. Overview
- 11.2.9.2. Products
- 11.2.9.3. SWOT Analysis
- 11.2.9.4. Recent Developments
- 11.2.9.5. Financials (Based on Availability)
- 11.2.10 Mexican Technical Plastics (PTM)
- 11.2.10.1. Overview
- 11.2.10.2. Products
- 11.2.10.3. SWOT Analysis
- 11.2.10.4. Recent Developments
- 11.2.10.5. Financials (Based on Availability)
- 11.2.11 Shenzhen Xingfeng Plastic
- 11.2.11.1. Overview
- 11.2.11.2. Products
- 11.2.11.3. SWOT Analysis
- 11.2.11.4. Recent Developments
- 11.2.11.5. Financials (Based on Availability)
- 11.2.12 Supreme Industries
- 11.2.12.1. Overview
- 11.2.12.2. Products
- 11.2.12.3. SWOT Analysis
- 11.2.12.4. Recent Developments
- 11.2.12.5. Financials (Based on Availability)
- 11.2.13 Nilkamal
- 11.2.13.1. Overview
- 11.2.13.2. Products
- 11.2.13.3. SWOT Analysis
- 11.2.13.4. Recent Developments
- 11.2.13.5. Financials (Based on Availability)
- 11.2.14 Mpact Limited
- 11.2.14.1. Overview
- 11.2.14.2. Products
- 11.2.14.3. SWOT Analysis
- 11.2.14.4. Recent Developments
- 11.2.14.5. Financials (Based on Availability)
- 11.2.15 Rehrig Pacific Company
- 11.2.15.1. Overview
- 11.2.15.2. Products
- 11.2.15.3. SWOT Analysis
- 11.2.15.4. Recent Developments
- 11.2.15.5. Financials (Based on Availability)
- 11.2.16 Delbrouck
- 11.2.16.1. Overview
- 11.2.16.2. Products
- 11.2.16.3. SWOT Analysis
- 11.2.16.4. Recent Developments
- 11.2.16.5. Financials (Based on Availability)
- 11.2.17 Myers Industries
- 11.2.17.1. Overview
- 11.2.17.2. Products
- 11.2.17.3. SWOT Analysis
- 11.2.17.4. Recent Developments
- 11.2.17.5. Financials (Based on Availability)
- 11.2.18 Zhejiang Zhengji Plastic
- 11.2.18.1. Overview
- 11.2.18.2. Products
- 11.2.18.3. SWOT Analysis
- 11.2.18.4. Recent Developments
- 11.2.18.5. Financials (Based on Availability)
- 11.2.19 Cherry Plastic
- 11.2.19.1. Overview
- 11.2.19.2. Products
- 11.2.19.3. SWOT Analysis
- 11.2.19.4. Recent Developments
- 11.2.19.5. Financials (Based on Availability)
- 11.2.20 Plastimer Industrial Corp.
- 11.2.20.1. Overview
- 11.2.20.2. Products
- 11.2.20.3. SWOT Analysis
- 11.2.20.4. Recent Developments
- 11.2.20.5. Financials (Based on Availability)
- 11.2.1 Brambles Limited
List of Figures
- Figure 1: Global Material Handling Crates Revenue Breakdown (billion, %) by Region 2025 & 2033
- Figure 2: Global Material Handling Crates Volume Breakdown (K, %) by Region 2025 & 2033
- Figure 3: North America Material Handling Crates Revenue (billion), by Application 2025 & 2033
- Figure 4: North America Material Handling Crates Volume (K), by Application 2025 & 2033
- Figure 5: North America Material Handling Crates Revenue Share (%), by Application 2025 & 2033
- Figure 6: North America Material Handling Crates Volume Share (%), by Application 2025 & 2033
- Figure 7: North America Material Handling Crates Revenue (billion), by Types 2025 & 2033
- Figure 8: North America Material Handling Crates Volume (K), by Types 2025 & 2033
- Figure 9: North America Material Handling Crates Revenue Share (%), by Types 2025 & 2033
- Figure 10: North America Material Handling Crates Volume Share (%), by Types 2025 & 2033
- Figure 11: North America Material Handling Crates Revenue (billion), by Country 2025 & 2033
- Figure 12: North America Material Handling Crates Volume (K), by Country 2025 & 2033
- Figure 13: North America Material Handling Crates Revenue Share (%), by Country 2025 & 2033
- Figure 14: North America Material Handling Crates Volume Share (%), by Country 2025 & 2033
- Figure 15: South America Material Handling Crates Revenue (billion), by Application 2025 & 2033
- Figure 16: South America Material Handling Crates Volume (K), by Application 2025 & 2033
- Figure 17: South America Material Handling Crates Revenue Share (%), by Application 2025 & 2033
- Figure 18: South America Material Handling Crates Volume Share (%), by Application 2025 & 2033
- Figure 19: South America Material Handling Crates Revenue (billion), by Types 2025 & 2033
- Figure 20: South America Material Handling Crates Volume (K), by Types 2025 & 2033
- Figure 21: South America Material Handling Crates Revenue Share (%), by Types 2025 & 2033
- Figure 22: South America Material Handling Crates Volume Share (%), by Types 2025 & 2033
- Figure 23: South America Material Handling Crates Revenue (billion), by Country 2025 & 2033
- Figure 24: South America Material Handling Crates Volume (K), by Country 2025 & 2033
- Figure 25: South America Material Handling Crates Revenue Share (%), by Country 2025 & 2033
- Figure 26: South America Material Handling Crates Volume Share (%), by Country 2025 & 2033
- Figure 27: Europe Material Handling Crates Revenue (billion), by Application 2025 & 2033
- Figure 28: Europe Material Handling Crates Volume (K), by Application 2025 & 2033
- Figure 29: Europe Material Handling Crates Revenue Share (%), by Application 2025 & 2033
- Figure 30: Europe Material Handling Crates Volume Share (%), by Application 2025 & 2033
- Figure 31: Europe Material Handling Crates Revenue (billion), by Types 2025 & 2033
- Figure 32: Europe Material Handling Crates Volume (K), by Types 2025 & 2033
- Figure 33: Europe Material Handling Crates Revenue Share (%), by Types 2025 & 2033
- Figure 34: Europe Material Handling Crates Volume Share (%), by Types 2025 & 2033
- Figure 35: Europe Material Handling Crates Revenue (billion), by Country 2025 & 2033
- Figure 36: Europe Material Handling Crates Volume (K), by Country 2025 & 2033
- Figure 37: Europe Material Handling Crates Revenue Share (%), by Country 2025 & 2033
- Figure 38: Europe Material Handling Crates Volume Share (%), by Country 2025 & 2033
- Figure 39: Middle East & Africa Material Handling Crates Revenue (billion), by Application 2025 & 2033
- Figure 40: Middle East & Africa Material Handling Crates Volume (K), by Application 2025 & 2033
- Figure 41: Middle East & Africa Material Handling Crates Revenue Share (%), by Application 2025 & 2033
- Figure 42: Middle East & Africa Material Handling Crates Volume Share (%), by Application 2025 & 2033
- Figure 43: Middle East & Africa Material Handling Crates Revenue (billion), by Types 2025 & 2033
- Figure 44: Middle East & Africa Material Handling Crates Volume (K), by Types 2025 & 2033
- Figure 45: Middle East & Africa Material Handling Crates Revenue Share (%), by Types 2025 & 2033
- Figure 46: Middle East & Africa Material Handling Crates Volume Share (%), by Types 2025 & 2033
- Figure 47: Middle East & Africa Material Handling Crates Revenue (billion), by Country 2025 & 2033
- Figure 48: Middle East & Africa Material Handling Crates Volume (K), by Country 2025 & 2033
- Figure 49: Middle East & Africa Material Handling Crates Revenue Share (%), by Country 2025 & 2033
- Figure 50: Middle East & Africa Material Handling Crates Volume Share (%), by Country 2025 & 2033
- Figure 51: Asia Pacific Material Handling Crates Revenue (billion), by Application 2025 & 2033
- Figure 52: Asia Pacific Material Handling Crates Volume (K), by Application 2025 & 2033
- Figure 53: Asia Pacific Material Handling Crates Revenue Share (%), by Application 2025 & 2033
- Figure 54: Asia Pacific Material Handling Crates Volume Share (%), by Application 2025 & 2033
- Figure 55: Asia Pacific Material Handling Crates Revenue (billion), by Types 2025 & 2033
- Figure 56: Asia Pacific Material Handling Crates Volume (K), by Types 2025 & 2033
- Figure 57: Asia Pacific Material Handling Crates Revenue Share (%), by Types 2025 & 2033
- Figure 58: Asia Pacific Material Handling Crates Volume Share (%), by Types 2025 & 2033
- Figure 59: Asia Pacific Material Handling Crates Revenue (billion), by Country 2025 & 2033
- Figure 60: Asia Pacific Material Handling Crates Volume (K), by Country 2025 & 2033
- Figure 61: Asia Pacific Material Handling Crates Revenue Share (%), by Country 2025 & 2033
- Figure 62: Asia Pacific Material Handling Crates Volume Share (%), by Country 2025 & 2033
List of Tables
- Table 1: Global Material Handling Crates Revenue billion Forecast, by Application 2020 & 2033
- Table 2: Global Material Handling Crates Volume K Forecast, by Application 2020 & 2033
- Table 3: Global Material Handling Crates Revenue billion Forecast, by Types 2020 & 2033
- Table 4: Global Material Handling Crates Volume K Forecast, by Types 2020 & 2033
- Table 5: Global Material Handling Crates Revenue billion Forecast, by Region 2020 & 2033
- Table 6: Global Material Handling Crates Volume K Forecast, by Region 2020 & 2033
- Table 7: Global Material Handling Crates Revenue billion Forecast, by Application 2020 & 2033
- Table 8: Global Material Handling Crates Volume K Forecast, by Application 2020 & 2033
- Table 9: Global Material Handling Crates Revenue billion Forecast, by Types 2020 & 2033
- Table 10: Global Material Handling Crates Volume K Forecast, by Types 2020 & 2033
- Table 11: Global Material Handling Crates Revenue billion Forecast, by Country 2020 & 2033
- Table 12: Global Material Handling Crates Volume K Forecast, by Country 2020 & 2033
- Table 13: United States Material Handling Crates Revenue (billion) Forecast, by Application 2020 & 2033
- Table 14: United States Material Handling Crates Volume (K) Forecast, by Application 2020 & 2033
- Table 15: Canada Material Handling Crates Revenue (billion) Forecast, by Application 2020 & 2033
- Table 16: Canada Material Handling Crates Volume (K) Forecast, by Application 2020 & 2033
- Table 17: Mexico Material Handling Crates Revenue (billion) Forecast, by Application 2020 & 2033
- Table 18: Mexico Material Handling Crates Volume (K) Forecast, by Application 2020 & 2033
- Table 19: Global Material Handling Crates Revenue billion Forecast, by Application 2020 & 2033
- Table 20: Global Material Handling Crates Volume K Forecast, by Application 2020 & 2033
- Table 21: Global Material Handling Crates Revenue billion Forecast, by Types 2020 & 2033
- Table 22: Global Material Handling Crates Volume K Forecast, by Types 2020 & 2033
- Table 23: Global Material Handling Crates Revenue billion Forecast, by Country 2020 & 2033
- Table 24: Global Material Handling Crates Volume K Forecast, by Country 2020 & 2033
- Table 25: Brazil Material Handling Crates Revenue (billion) Forecast, by Application 2020 & 2033
- Table 26: Brazil Material Handling Crates Volume (K) Forecast, by Application 2020 & 2033
- Table 27: Argentina Material Handling Crates Revenue (billion) Forecast, by Application 2020 & 2033
- Table 28: Argentina Material Handling Crates Volume (K) Forecast, by Application 2020 & 2033
- Table 29: Rest of South America Material Handling Crates Revenue (billion) Forecast, by Application 2020 & 2033
- Table 30: Rest of South America Material Handling Crates Volume (K) Forecast, by Application 2020 & 2033
- Table 31: Global Material Handling Crates Revenue billion Forecast, by Application 2020 & 2033
- Table 32: Global Material Handling Crates Volume K Forecast, by Application 2020 & 2033
- Table 33: Global Material Handling Crates Revenue billion Forecast, by Types 2020 & 2033
- Table 34: Global Material Handling Crates Volume K Forecast, by Types 2020 & 2033
- Table 35: Global Material Handling Crates Revenue billion Forecast, by Country 2020 & 2033
- Table 36: Global Material Handling Crates Volume K Forecast, by Country 2020 & 2033
- Table 37: United Kingdom Material Handling Crates Revenue (billion) Forecast, by Application 2020 & 2033
- Table 38: United Kingdom Material Handling Crates Volume (K) Forecast, by Application 2020 & 2033
- Table 39: Germany Material Handling Crates Revenue (billion) Forecast, by Application 2020 & 2033
- Table 40: Germany Material Handling Crates Volume (K) Forecast, by Application 2020 & 2033
- Table 41: France Material Handling Crates Revenue (billion) Forecast, by Application 2020 & 2033
- Table 42: France Material Handling Crates Volume (K) Forecast, by Application 2020 & 2033
- Table 43: Italy Material Handling Crates Revenue (billion) Forecast, by Application 2020 & 2033
- Table 44: Italy Material Handling Crates Volume (K) Forecast, by Application 2020 & 2033
- Table 45: Spain Material Handling Crates Revenue (billion) Forecast, by Application 2020 & 2033
- Table 46: Spain Material Handling Crates Volume (K) Forecast, by Application 2020 & 2033
- Table 47: Russia Material Handling Crates Revenue (billion) Forecast, by Application 2020 & 2033
- Table 48: Russia Material Handling Crates Volume (K) Forecast, by Application 2020 & 2033
- Table 49: Benelux Material Handling Crates Revenue (billion) Forecast, by Application 2020 & 2033
- Table 50: Benelux Material Handling Crates Volume (K) Forecast, by Application 2020 & 2033
- Table 51: Nordics Material Handling Crates Revenue (billion) Forecast, by Application 2020 & 2033
- Table 52: Nordics Material Handling Crates Volume (K) Forecast, by Application 2020 & 2033
- Table 53: Rest of Europe Material Handling Crates Revenue (billion) Forecast, by Application 2020 & 2033
- Table 54: Rest of Europe Material Handling Crates Volume (K) Forecast, by Application 2020 & 2033
- Table 55: Global Material Handling Crates Revenue billion Forecast, by Application 2020 & 2033
- Table 56: Global Material Handling Crates Volume K Forecast, by Application 2020 & 2033
- Table 57: Global Material Handling Crates Revenue billion Forecast, by Types 2020 & 2033
- Table 58: Global Material Handling Crates Volume K Forecast, by Types 2020 & 2033
- Table 59: Global Material Handling Crates Revenue billion Forecast, by Country 2020 & 2033
- Table 60: Global Material Handling Crates Volume K Forecast, by Country 2020 & 2033
- Table 61: Turkey Material Handling Crates Revenue (billion) Forecast, by Application 2020 & 2033
- Table 62: Turkey Material Handling Crates Volume (K) Forecast, by Application 2020 & 2033
- Table 63: Israel Material Handling Crates Revenue (billion) Forecast, by Application 2020 & 2033
- Table 64: Israel Material Handling Crates Volume (K) Forecast, by Application 2020 & 2033
- Table 65: GCC Material Handling Crates Revenue (billion) Forecast, by Application 2020 & 2033
- Table 66: GCC Material Handling Crates Volume (K) Forecast, by Application 2020 & 2033
- Table 67: North Africa Material Handling Crates Revenue (billion) Forecast, by Application 2020 & 2033
- Table 68: North Africa Material Handling Crates Volume (K) Forecast, by Application 2020 & 2033
- Table 69: South Africa Material Handling Crates Revenue (billion) Forecast, by Application 2020 & 2033
- Table 70: South Africa Material Handling Crates Volume (K) Forecast, by Application 2020 & 2033
- Table 71: Rest of Middle East & Africa Material Handling Crates Revenue (billion) Forecast, by Application 2020 & 2033
- Table 72: Rest of Middle East & Africa Material Handling Crates Volume (K) Forecast, by Application 2020 & 2033
- Table 73: Global Material Handling Crates Revenue billion Forecast, by Application 2020 & 2033
- Table 74: Global Material Handling Crates Volume K Forecast, by Application 2020 & 2033
- Table 75: Global Material Handling Crates Revenue billion Forecast, by Types 2020 & 2033
- Table 76: Global Material Handling Crates Volume K Forecast, by Types 2020 & 2033
- Table 77: Global Material Handling Crates Revenue billion Forecast, by Country 2020 & 2033
- Table 78: Global Material Handling Crates Volume K Forecast, by Country 2020 & 2033
- Table 79: China Material Handling Crates Revenue (billion) Forecast, by Application 2020 & 2033
- Table 80: China Material Handling Crates Volume (K) Forecast, by Application 2020 & 2033
- Table 81: India Material Handling Crates Revenue (billion) Forecast, by Application 2020 & 2033
- Table 82: India Material Handling Crates Volume (K) Forecast, by Application 2020 & 2033
- Table 83: Japan Material Handling Crates Revenue (billion) Forecast, by Application 2020 & 2033
- Table 84: Japan Material Handling Crates Volume (K) Forecast, by Application 2020 & 2033
- Table 85: South Korea Material Handling Crates Revenue (billion) Forecast, by Application 2020 & 2033
- Table 86: South Korea Material Handling Crates Volume (K) Forecast, by Application 2020 & 2033
- Table 87: ASEAN Material Handling Crates Revenue (billion) Forecast, by Application 2020 & 2033
- Table 88: ASEAN Material Handling Crates Volume (K) Forecast, by Application 2020 & 2033
- Table 89: Oceania Material Handling Crates Revenue (billion) Forecast, by Application 2020 & 2033
- Table 90: Oceania Material Handling Crates Volume (K) Forecast, by Application 2020 & 2033
- Table 91: Rest of Asia Pacific Material Handling Crates Revenue (billion) Forecast, by Application 2020 & 2033
- Table 92: Rest of Asia Pacific Material Handling Crates Volume (K) Forecast, by Application 2020 & 2033
Frequently Asked Questions
1. What is the projected Compound Annual Growth Rate (CAGR) of the Material Handling Crates?
The projected CAGR is approximately 4.2%.
2. Which companies are prominent players in the Material Handling Crates?
Key companies in the market include Brambles Limited, Schoeller Allibert, ORBIS, DS Smith, Georg Utz Holding, Didak Injection, Suzhou Dasen Plastic, Suzhou First Plastic, RGE Group, Mexican Technical Plastics (PTM), Shenzhen Xingfeng Plastic, Supreme Industries, Nilkamal, Mpact Limited, Rehrig Pacific Company, Delbrouck, Myers Industries, Zhejiang Zhengji Plastic, Cherry Plastic, Plastimer Industrial Corp..
3. What are the main segments of the Material Handling Crates?
The market segments include Application, Types.
4. Can you provide details about the market size?
The market size is estimated to be USD 5.9 billion as of 2022.
5. What are some drivers contributing to market growth?
N/A
6. What are the notable trends driving market growth?
N/A
7. Are there any restraints impacting market growth?
N/A
8. Can you provide examples of recent developments in the market?
N/A
9. What pricing options are available for accessing the report?
Pricing options include single-user, multi-user, and enterprise licenses priced at USD 3350.00, USD 5025.00, and USD 6700.00 respectively.
10. Is the market size provided in terms of value or volume?
The market size is provided in terms of value, measured in billion and volume, measured in K.
11. Are there any specific market keywords associated with the report?
Yes, the market keyword associated with the report is "Material Handling Crates," which aids in identifying and referencing the specific market segment covered.
12. How do I determine which pricing option suits my needs best?
The pricing options vary based on user requirements and access needs. Individual users may opt for single-user licenses, while businesses requiring broader access may choose multi-user or enterprise licenses for cost-effective access to the report.
13. Are there any additional resources or data provided in the Material Handling Crates report?
While the report offers comprehensive insights, it's advisable to review the specific contents or supplementary materials provided to ascertain if additional resources or data are available.
14. How can I stay updated on further developments or reports in the Material Handling Crates?
To stay informed about further developments, trends, and reports in the Material Handling Crates, consider subscribing to industry newsletters, following relevant companies and organizations, or regularly checking reputable industry news sources and publications.
Methodology
Step 1 - Identification of Relevant Samples Size from Population Database


Step 2 - Approaches for Defining Global Market Size (Value, Volume* & Price*)

Note*: In applicable scenarios
Step 3 - Data Sources
Primary Research
- Web Analytics
- Survey Reports
- Research Institute
- Latest Research Reports
- Opinion Leaders
Secondary Research
- Annual Reports
- White Paper
- Latest Press Release
- Industry Association
- Paid Database
- Investor Presentations

Step 4 - Data Triangulation
Involves using different sources of information in order to increase the validity of a study
These sources are likely to be stakeholders in a program - participants, other researchers, program staff, other community members, and so on.
Then we put all data in single framework & apply various statistical tools to find out the dynamic on the market.
During the analysis stage, feedback from the stakeholder groups would be compared to determine areas of agreement as well as areas of divergence