
Key Insights
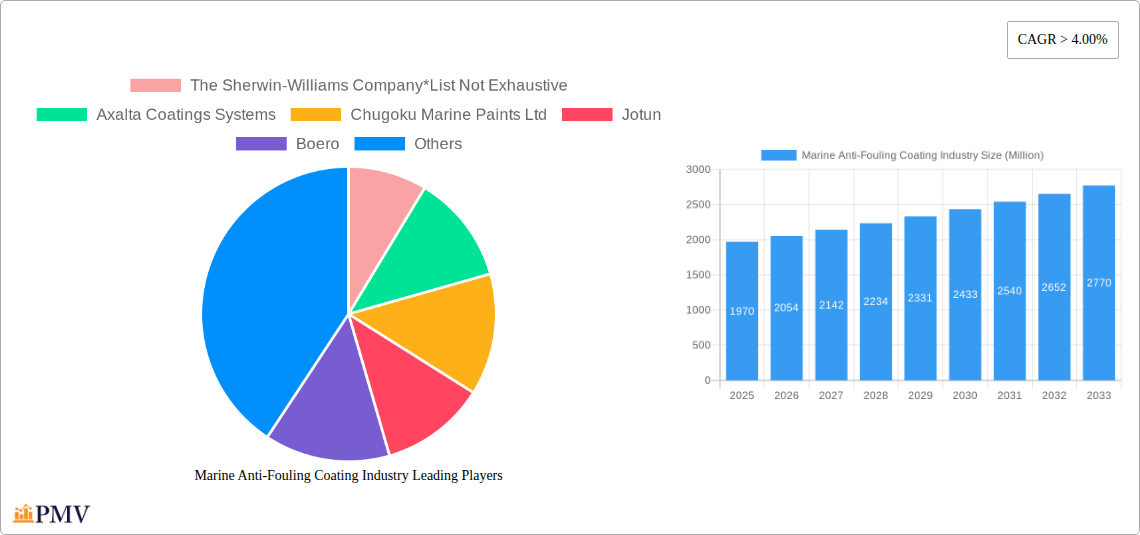
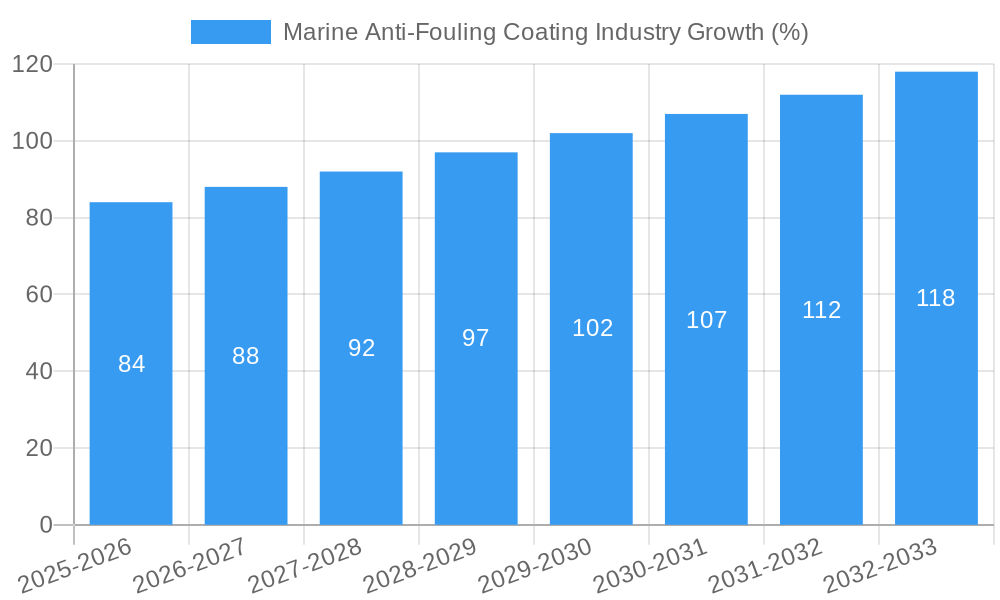
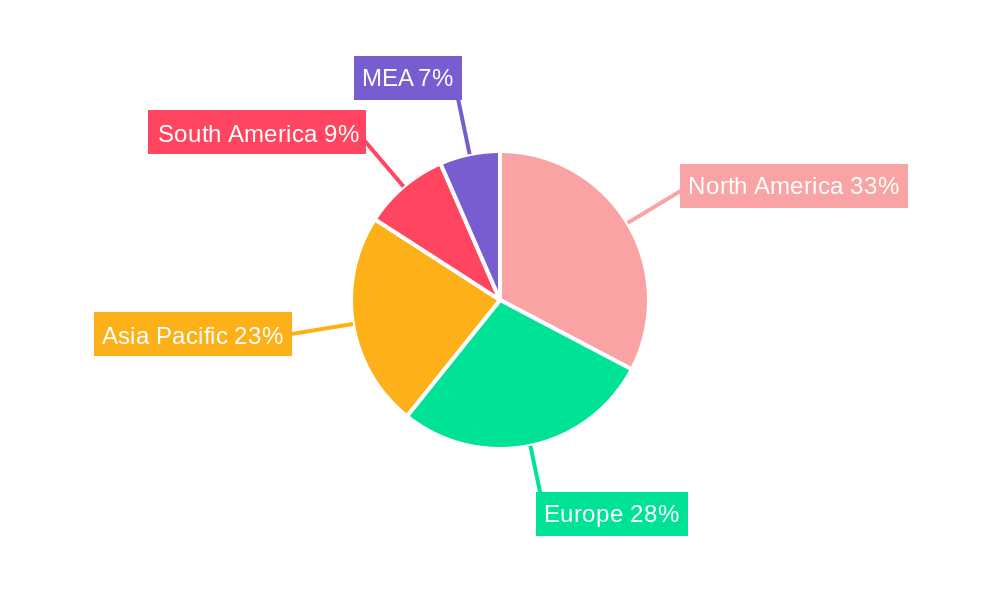
The global marine anti-fouling coating market, valued at $1.97 billion in 2025, is projected to experience robust growth, driven by a compound annual growth rate (CAGR) exceeding 4.00% from 2025 to 2033. This expansion is fueled by several key factors. Stringent environmental regulations aimed at reducing the impact of biofouling on marine ecosystems are pushing the adoption of environmentally friendly anti-fouling coatings. The growing global shipping industry, coupled with increasing demand for efficient and durable hull coatings to minimize fuel consumption and operational costs, significantly contributes to market growth. Furthermore, advancements in coating technology, including the development of self-polishing and hybrid coatings with enhanced performance and longevity, are driving market expansion. The increasing prevalence of biofouling, which negatively impacts vessel speed and fuel efficiency, is also a key driver. Regional variations exist, with North America and Europe currently holding significant market shares, while the Asia-Pacific region exhibits promising growth potential due to its expanding shipbuilding and shipping activities.
Segment-wise, copper-based coatings still dominate, though self-polishing (silver-based) and hybrid coatings are gaining traction due to their enhanced environmental profile and performance characteristics. The hull coating application segment holds the largest share, reflecting the crucial role of anti-fouling coatings in maintaining vessel efficiency. However, the tank coating and other applications segments are expected to witness significant growth, fueled by increasing demand for specialized coatings in diverse marine applications, including yachts and smaller vessels. Competitive dynamics are characterized by the presence of established industry players such as Sherwin-Williams, Akzo Nobel, Jotun, and Nippon Paint, alongside several regional and specialized companies. The market is expected to witness further consolidation as companies invest in research and development to develop innovative and sustainable anti-fouling solutions that meet increasingly stringent environmental requirements. Overall, the marine anti-fouling coating market is poised for sustained growth, propelled by environmental regulations, technological advancements, and the expanding global shipping industry.
Marine Anti-Fouling Coating Industry: A Comprehensive Market Report (2019-2033)
This detailed report provides a comprehensive analysis of the global marine anti-fouling coating industry, encompassing market size, segmentation, competitive landscape, and future growth projections. Valued at xx Million in 2025, the market is poised for significant expansion during the forecast period (2025-2033). This report is an essential resource for industry stakeholders, investors, and researchers seeking actionable insights into this dynamic sector. The study period covers 2019-2033, with 2025 serving as the base and estimated year.
Marine Anti-Fouling Coating Industry Market Structure & Competitive Dynamics
The global marine anti-fouling coating market exhibits a moderately concentrated structure, with several multinational corporations holding significant market share. Key players include The Sherwin-Williams Company, Axalta Coatings Systems, Chugoku Marine Paints Ltd, Jotun, Boero, RPM International Inc, Kansai Paint Co Ltd, Akzo Nobel NV, PPG Industries Inc, Nippon Paint Marine Coatings Co Ltd, BASF SE, Hempel A/S, and Lanxess. These companies compete based on product innovation, price competitiveness, and geographic reach. Market share dynamics are influenced by technological advancements, regulatory changes, and M&A activities. The past five years have witnessed several strategic mergers and acquisitions, valued collectively at approximately xx Million, aimed at expanding market access and product portfolios.
- Market Concentration: Moderately concentrated, with top 10 players accounting for approximately xx% of the global market share.
- Innovation Ecosystems: Active collaborations between coating manufacturers, research institutions, and shipbuilders are driving innovation in biocide-free and sustainable solutions.
- Regulatory Frameworks: Increasingly stringent environmental regulations are shaping product development and market access strategies. The International Maritime Organization (IMO) plays a crucial role in setting global standards.
- Product Substitutes: Alternative fouling control technologies, such as UV-C light systems, are emerging as potential substitutes. However, their market penetration remains limited.
- End-User Trends: The increasing demand for fuel-efficient vessels and environmentally friendly coatings is driving market growth. The growth of the global shipping industry is directly impacting the industry's growth as well.
- M&A Activities: Several significant mergers and acquisitions have been observed in recent years, consolidating market share and enhancing technological capabilities. Deal values have ranged from xx Million to xx Million.
Marine Anti-Fouling Coating Industry Industry Trends & Insights
The global marine anti-fouling coating market is experiencing robust growth, driven by several key factors. The increasing global maritime trade volume, coupled with the rising demand for larger and more efficient vessels, is fueling the demand for high-performance anti-fouling coatings. The market is expected to witness a CAGR of xx% during the forecast period, reaching xx Million by 2033. Technological advancements, such as the development of biocide-free and self-polishing coatings, are contributing significantly to market expansion. Moreover, stringent environmental regulations are pushing manufacturers to develop more sustainable and eco-friendly solutions, further shaping market dynamics. Consumer preferences are shifting towards high-performance coatings that enhance fuel efficiency, reduce emissions, and minimize environmental impact. The competitive landscape is characterized by intense innovation and strategic partnerships, with key players investing heavily in research and development to gain a competitive edge. Market penetration of advanced coating technologies is gradually increasing, with copper-based coatings still holding the largest market share.
Dominant Markets & Segments in Marine Anti-Fouling Coating Industry
The Asia-Pacific region currently dominates the global marine anti-fouling coating market, driven by the rapid growth of the shipbuilding and shipping industries in countries like China, Japan, South Korea, and Singapore. Strong economic growth, substantial infrastructure development, and favorable government policies are key factors contributing to this dominance.
By Type:
- Copper-based: This segment currently holds the largest market share, owing to its established efficacy and cost-effectiveness. However, environmental concerns are leading to a gradual shift towards alternative technologies.
- Self-polishing (Silver-based): This segment is experiencing significant growth due to its enhanced performance and reduced environmental impact compared to traditional copper-based coatings.
- Hybrid: Hybrid coatings combining the benefits of different technologies are gaining traction.
- Other Types (Organo Metallic, Silane): This segment is relatively smaller, but exhibiting growth due to their unique properties and emerging applications.
By Application:
- Hull Coatings: This segment represents the largest application area, due to the critical need to prevent fouling on vessel hulls.
- Tank Coatings: This segment is vital for preventing corrosion and fouling in cargo tanks.
- Other Applications (Yachts and Vessels): This segment is growing, driven by rising demand for high-performance coatings in the leisure boating sector.
Marine Anti-Fouling Coating Industry Product Innovations
Recent years have witnessed significant advancements in marine anti-fouling coating technology. The focus is on developing biocide-free, self-polishing, and environmentally friendly solutions. Companies are incorporating advanced materials and technologies to improve coating performance, durability, and sustainability. These innovations are aimed at enhancing fuel efficiency, reducing emissions, and minimizing the environmental impact of shipping operations. The launch of copper-free antifouling coatings, such as PPG Nexeon 810, exemplifies this trend towards sustainable solutions. This innovation focuses on improved vessel performance, emissions reduction, and sustainability, resulting in an immediate power boost of up to 10% and operational efficiency enhancement of up to 15%.
Report Segmentation & Scope
This report segments the marine anti-fouling coating market by type (Copper-based, Self-polishing (Silver-based), Hybrid, Other Types (Organo Metallic, Silane)) and by application (Hull Coatings, Tank Coatings, Other Applications (Yachts and Vessels)). Each segment is analyzed in detail, providing insights into market size, growth projections, competitive dynamics, and key drivers. The report also covers regional market analysis, identifying key growth regions and their respective market drivers. Growth projections for each segment are provided for the forecast period (2025-2033). Competitive dynamics within each segment are examined, highlighting key players and their market strategies.
Key Drivers of Marine Anti-Fouling Coating Industry Growth
Several key factors are driving the growth of the marine anti-fouling coating industry:
- Stringent environmental regulations: The IMO's regulations on ballast water management and the reduction of biofouling are pushing the adoption of eco-friendly coatings.
- Increasing demand for fuel-efficient vessels: Anti-fouling coatings reduce drag and improve fuel efficiency, making them economically attractive.
- Technological advancements: The development of innovative coatings with enhanced performance and sustainability is driving market expansion.
- Growth of the global shipping industry: The continuous expansion of global trade and maritime transportation directly fuels the demand for anti-fouling coatings.
Challenges in the Marine Anti-Fouling Coating Industry Sector
The marine anti-fouling coating industry faces several challenges:
- Regulatory hurdles: Meeting stringent environmental regulations and obtaining necessary approvals can be costly and time-consuming.
- Supply chain disruptions: Global supply chain volatility can impact the availability of raw materials and affect production costs.
- Competition: The market is characterized by intense competition, requiring continuous innovation and product differentiation to maintain market share. This competition leads to price pressures and the need for continuous R&D investment.
Leading Players in the Marine Anti-Fouling Coating Industry Market
- The Sherwin-Williams Company
- Axalta Coatings Systems
- Chugoku Marine Paints Ltd
- Jotun
- Boero
- RPM International Inc
- Kansai Paint Co Ltd
- Akzo Nobel NV
- PPG Industries Inc
- Nippon Paint Marine Coatings Co Ltd
- BASF SE
- Hempel A/S
- Lanxess
Key Developments in Marine Anti-Fouling Coating Industry Sector
- March 2024: PPG Industries Inc. launched PPG Nexeon 810, a copper-free antifouling coating that improves vessel performance and reduces emissions.
- October 2023: Hempel A/S inaugurated a new antifouling coatings production facility in Zhangjiagang, China, to meet rising demand.
- April 2023: Damen Shipyards, AkzoNobel, and Philips collaborated on a UV-C light fouling control solution.
- December 2022: I-Tech AB and LANXESS successfully tested antifouling coating formulations using Selektope and SEA NINE biocides.
- November 2022: AkzoNobel NV launched a new biocide-free (B-Free) fouling control range for yachts.
Strategic Marine Anti-Fouling Coating Industry Market Outlook
The future of the marine anti-fouling coating industry is bright, driven by continued growth in global shipping, stringent environmental regulations, and ongoing technological advancements. Strategic opportunities exist for companies that can develop and market sustainable, high-performance coatings that meet the evolving needs of the maritime industry. The focus on biocide-free and environmentally friendly solutions will continue to shape market dynamics, creating opportunities for innovation and market leadership. The industry is expected to witness further consolidation through mergers and acquisitions, leading to a more concentrated market structure.
Marine Anti-Fouling Coating Industry Segmentation
-
1. Type
- 1.1. Copper-based
- 1.2. Self-polishing (Silver-based)
- 1.3. Hybrid
- 1.4. Other Types (Organo Metallic, Silane)
-
2. Application
- 2.1. Hull Coatings
- 2.2. Tank Coatings
- 2.3. Other Applications (Yachts and Vessels)
Marine Anti-Fouling Coating Industry Segmentation By Geography
-
1. Asia Pacific
- 1.1. China
- 1.2. India
- 1.3. Japan
- 1.4. South Korea
- 1.5. Thailand
- 1.6. Vietnam
- 1.7. Indonesia
- 1.8. Malaysia
- 1.9. Rest of Asia Pacific
-
2. North America
- 2.1. United States
- 2.2. Canada
- 2.3. Mexico
-
3. Europe
- 3.1. Germany
- 3.2. United Kingdom
- 3.3. France
- 3.4. Italy
- 3.5. Spain
- 3.6. Russia
- 3.7. NORDIC Countries
- 3.8. Turkey
- 3.9. Rest of Europe
-
4. South America
- 4.1. Brazil
- 4.2. Argentina
- 4.3. Colombia
- 4.4. Rest of South America
-
5. Middle East and Africa
- 5.1. Saudi Arabia
- 5.2. South Africa
- 5.3. Nigeria
- 5.4. United Arab Emirates
- 5.5. Qatar
- 5.6. Egypt
- 5.7. Rest of Middle East and Africa
Marine Anti-Fouling Coating Industry REPORT HIGHLIGHTS
| Aspects | Details |
|---|---|
| Study Period | 2019-2033 |
| Base Year | 2024 |
| Estimated Year | 2025 |
| Forecast Period | 2025-2033 |
| Historical Period | 2019-2024 |
| Growth Rate | CAGR of > 4.00% from 2019-2033 |
| Segmentation |
|
Table of Contents
- 1. Introduction
- 1.1. Research Scope
- 1.2. Market Segmentation
- 1.3. Research Methodology
- 1.4. Definitions and Assumptions
- 2. Executive Summary
- 2.1. Introduction
- 3. Market Dynamics
- 3.1. Introduction
- 3.2. Market Drivers
- 3.2.1. Increasing Production of Leisure Boats and Cruise Ships; Increase in Ship Repairs and Maintenance Activities; Surging Demand from Oil and Gas Industry
- 3.3. Market Restrains
- 3.3.1. Stringent Government Regulations; Increased Usage of High-standard Durable Products
- 3.4. Market Trends
- 3.4.1. Hull Coatings Segment to Dominate the Market
- 4. Market Factor Analysis
- 4.1. Porters Five Forces
- 4.2. Supply/Value Chain
- 4.3. PESTEL analysis
- 4.4. Market Entropy
- 4.5. Patent/Trademark Analysis
- 5. Global Marine Anti-Fouling Coating Industry Analysis, Insights and Forecast, 2019-2031
- 5.1. Market Analysis, Insights and Forecast - by Type
- 5.1.1. Copper-based
- 5.1.2. Self-polishing (Silver-based)
- 5.1.3. Hybrid
- 5.1.4. Other Types (Organo Metallic, Silane)
- 5.2. Market Analysis, Insights and Forecast - by Application
- 5.2.1. Hull Coatings
- 5.2.2. Tank Coatings
- 5.2.3. Other Applications (Yachts and Vessels)
- 5.3. Market Analysis, Insights and Forecast - by Region
- 5.3.1. Asia Pacific
- 5.3.2. North America
- 5.3.3. Europe
- 5.3.4. South America
- 5.3.5. Middle East and Africa
- 5.1. Market Analysis, Insights and Forecast - by Type
- 6. Asia Pacific Marine Anti-Fouling Coating Industry Analysis, Insights and Forecast, 2019-2031
- 6.1. Market Analysis, Insights and Forecast - by Type
- 6.1.1. Copper-based
- 6.1.2. Self-polishing (Silver-based)
- 6.1.3. Hybrid
- 6.1.4. Other Types (Organo Metallic, Silane)
- 6.2. Market Analysis, Insights and Forecast - by Application
- 6.2.1. Hull Coatings
- 6.2.2. Tank Coatings
- 6.2.3. Other Applications (Yachts and Vessels)
- 6.1. Market Analysis, Insights and Forecast - by Type
- 7. North America Marine Anti-Fouling Coating Industry Analysis, Insights and Forecast, 2019-2031
- 7.1. Market Analysis, Insights and Forecast - by Type
- 7.1.1. Copper-based
- 7.1.2. Self-polishing (Silver-based)
- 7.1.3. Hybrid
- 7.1.4. Other Types (Organo Metallic, Silane)
- 7.2. Market Analysis, Insights and Forecast - by Application
- 7.2.1. Hull Coatings
- 7.2.2. Tank Coatings
- 7.2.3. Other Applications (Yachts and Vessels)
- 7.1. Market Analysis, Insights and Forecast - by Type
- 8. Europe Marine Anti-Fouling Coating Industry Analysis, Insights and Forecast, 2019-2031
- 8.1. Market Analysis, Insights and Forecast - by Type
- 8.1.1. Copper-based
- 8.1.2. Self-polishing (Silver-based)
- 8.1.3. Hybrid
- 8.1.4. Other Types (Organo Metallic, Silane)
- 8.2. Market Analysis, Insights and Forecast - by Application
- 8.2.1. Hull Coatings
- 8.2.2. Tank Coatings
- 8.2.3. Other Applications (Yachts and Vessels)
- 8.1. Market Analysis, Insights and Forecast - by Type
- 9. South America Marine Anti-Fouling Coating Industry Analysis, Insights and Forecast, 2019-2031
- 9.1. Market Analysis, Insights and Forecast - by Type
- 9.1.1. Copper-based
- 9.1.2. Self-polishing (Silver-based)
- 9.1.3. Hybrid
- 9.1.4. Other Types (Organo Metallic, Silane)
- 9.2. Market Analysis, Insights and Forecast - by Application
- 9.2.1. Hull Coatings
- 9.2.2. Tank Coatings
- 9.2.3. Other Applications (Yachts and Vessels)
- 9.1. Market Analysis, Insights and Forecast - by Type
- 10. Middle East and Africa Marine Anti-Fouling Coating Industry Analysis, Insights and Forecast, 2019-2031
- 10.1. Market Analysis, Insights and Forecast - by Type
- 10.1.1. Copper-based
- 10.1.2. Self-polishing (Silver-based)
- 10.1.3. Hybrid
- 10.1.4. Other Types (Organo Metallic, Silane)
- 10.2. Market Analysis, Insights and Forecast - by Application
- 10.2.1. Hull Coatings
- 10.2.2. Tank Coatings
- 10.2.3. Other Applications (Yachts and Vessels)
- 10.1. Market Analysis, Insights and Forecast - by Type
- 11. North America Marine Anti-Fouling Coating Industry Analysis, Insights and Forecast, 2019-2031
- 11.1. Market Analysis, Insights and Forecast - By Country/Sub-region
- 11.1.1 United States
- 11.1.2 Canada
- 11.1.3 Mexico
- 12. Europe Marine Anti-Fouling Coating Industry Analysis, Insights and Forecast, 2019-2031
- 12.1. Market Analysis, Insights and Forecast - By Country/Sub-region
- 12.1.1 Germany
- 12.1.2 United Kingdom
- 12.1.3 France
- 12.1.4 Spain
- 12.1.5 Italy
- 12.1.6 Spain
- 12.1.7 Belgium
- 12.1.8 Netherland
- 12.1.9 Nordics
- 12.1.10 Rest of Europe
- 13. Asia Pacific Marine Anti-Fouling Coating Industry Analysis, Insights and Forecast, 2019-2031
- 13.1. Market Analysis, Insights and Forecast - By Country/Sub-region
- 13.1.1 China
- 13.1.2 Japan
- 13.1.3 India
- 13.1.4 South Korea
- 13.1.5 Southeast Asia
- 13.1.6 Australia
- 13.1.7 Indonesia
- 13.1.8 Phillipes
- 13.1.9 Singapore
- 13.1.10 Thailandc
- 13.1.11 Rest of Asia Pacific
- 14. South America Marine Anti-Fouling Coating Industry Analysis, Insights and Forecast, 2019-2031
- 14.1. Market Analysis, Insights and Forecast - By Country/Sub-region
- 14.1.1 Brazil
- 14.1.2 Argentina
- 14.1.3 Peru
- 14.1.4 Chile
- 14.1.5 Colombia
- 14.1.6 Ecuador
- 14.1.7 Venezuela
- 14.1.8 Rest of South America
- 15. North America Marine Anti-Fouling Coating Industry Analysis, Insights and Forecast, 2019-2031
- 15.1. Market Analysis, Insights and Forecast - By Country/Sub-region
- 15.1.1 United States
- 15.1.2 Canada
- 15.1.3 Mexico
- 16. MEA Marine Anti-Fouling Coating Industry Analysis, Insights and Forecast, 2019-2031
- 16.1. Market Analysis, Insights and Forecast - By Country/Sub-region
- 16.1.1 United Arab Emirates
- 16.1.2 Saudi Arabia
- 16.1.3 South Africa
- 16.1.4 Rest of Middle East and Africa
- 17. Competitive Analysis
- 17.1. Global Market Share Analysis 2024
- 17.2. Company Profiles
- 17.2.1 The Sherwin-Williams Company*List Not Exhaustive
- 17.2.1.1. Overview
- 17.2.1.2. Products
- 17.2.1.3. SWOT Analysis
- 17.2.1.4. Recent Developments
- 17.2.1.5. Financials (Based on Availability)
- 17.2.2 Axalta Coatings Systems
- 17.2.2.1. Overview
- 17.2.2.2. Products
- 17.2.2.3. SWOT Analysis
- 17.2.2.4. Recent Developments
- 17.2.2.5. Financials (Based on Availability)
- 17.2.3 Chugoku Marine Paints Ltd
- 17.2.3.1. Overview
- 17.2.3.2. Products
- 17.2.3.3. SWOT Analysis
- 17.2.3.4. Recent Developments
- 17.2.3.5. Financials (Based on Availability)
- 17.2.4 Jotun
- 17.2.4.1. Overview
- 17.2.4.2. Products
- 17.2.4.3. SWOT Analysis
- 17.2.4.4. Recent Developments
- 17.2.4.5. Financials (Based on Availability)
- 17.2.5 Boero
- 17.2.5.1. Overview
- 17.2.5.2. Products
- 17.2.5.3. SWOT Analysis
- 17.2.5.4. Recent Developments
- 17.2.5.5. Financials (Based on Availability)
- 17.2.6 RPM International Inc
- 17.2.6.1. Overview
- 17.2.6.2. Products
- 17.2.6.3. SWOT Analysis
- 17.2.6.4. Recent Developments
- 17.2.6.5. Financials (Based on Availability)
- 17.2.7 Kansai Paint Co Ltd
- 17.2.7.1. Overview
- 17.2.7.2. Products
- 17.2.7.3. SWOT Analysis
- 17.2.7.4. Recent Developments
- 17.2.7.5. Financials (Based on Availability)
- 17.2.8 Akzo Nobel NV
- 17.2.8.1. Overview
- 17.2.8.2. Products
- 17.2.8.3. SWOT Analysis
- 17.2.8.4. Recent Developments
- 17.2.8.5. Financials (Based on Availability)
- 17.2.9 PPG Industries Inc
- 17.2.9.1. Overview
- 17.2.9.2. Products
- 17.2.9.3. SWOT Analysis
- 17.2.9.4. Recent Developments
- 17.2.9.5. Financials (Based on Availability)
- 17.2.10 Nippon Paint Marine Coatings Co Ltd
- 17.2.10.1. Overview
- 17.2.10.2. Products
- 17.2.10.3. SWOT Analysis
- 17.2.10.4. Recent Developments
- 17.2.10.5. Financials (Based on Availability)
- 17.2.11 BASF SE
- 17.2.11.1. Overview
- 17.2.11.2. Products
- 17.2.11.3. SWOT Analysis
- 17.2.11.4. Recent Developments
- 17.2.11.5. Financials (Based on Availability)
- 17.2.12 Hempel A/S
- 17.2.12.1. Overview
- 17.2.12.2. Products
- 17.2.12.3. SWOT Analysis
- 17.2.12.4. Recent Developments
- 17.2.12.5. Financials (Based on Availability)
- 17.2.13 Lanxess
- 17.2.13.1. Overview
- 17.2.13.2. Products
- 17.2.13.3. SWOT Analysis
- 17.2.13.4. Recent Developments
- 17.2.13.5. Financials (Based on Availability)
- 17.2.1 The Sherwin-Williams Company*List Not Exhaustive
List of Figures
- Figure 1: Global Marine Anti-Fouling Coating Industry Revenue Breakdown (Million, %) by Region 2024 & 2032
- Figure 2: Global Marine Anti-Fouling Coating Industry Volume Breakdown (liter, %) by Region 2024 & 2032
- Figure 3: North America Marine Anti-Fouling Coating Industry Revenue (Million), by Country 2024 & 2032
- Figure 4: North America Marine Anti-Fouling Coating Industry Volume (liter), by Country 2024 & 2032
- Figure 5: North America Marine Anti-Fouling Coating Industry Revenue Share (%), by Country 2024 & 2032
- Figure 6: North America Marine Anti-Fouling Coating Industry Volume Share (%), by Country 2024 & 2032
- Figure 7: Europe Marine Anti-Fouling Coating Industry Revenue (Million), by Country 2024 & 2032
- Figure 8: Europe Marine Anti-Fouling Coating Industry Volume (liter), by Country 2024 & 2032
- Figure 9: Europe Marine Anti-Fouling Coating Industry Revenue Share (%), by Country 2024 & 2032
- Figure 10: Europe Marine Anti-Fouling Coating Industry Volume Share (%), by Country 2024 & 2032
- Figure 11: Asia Pacific Marine Anti-Fouling Coating Industry Revenue (Million), by Country 2024 & 2032
- Figure 12: Asia Pacific Marine Anti-Fouling Coating Industry Volume (liter), by Country 2024 & 2032
- Figure 13: Asia Pacific Marine Anti-Fouling Coating Industry Revenue Share (%), by Country 2024 & 2032
- Figure 14: Asia Pacific Marine Anti-Fouling Coating Industry Volume Share (%), by Country 2024 & 2032
- Figure 15: South America Marine Anti-Fouling Coating Industry Revenue (Million), by Country 2024 & 2032
- Figure 16: South America Marine Anti-Fouling Coating Industry Volume (liter), by Country 2024 & 2032
- Figure 17: South America Marine Anti-Fouling Coating Industry Revenue Share (%), by Country 2024 & 2032
- Figure 18: South America Marine Anti-Fouling Coating Industry Volume Share (%), by Country 2024 & 2032
- Figure 19: North America Marine Anti-Fouling Coating Industry Revenue (Million), by Country 2024 & 2032
- Figure 20: North America Marine Anti-Fouling Coating Industry Volume (liter), by Country 2024 & 2032
- Figure 21: North America Marine Anti-Fouling Coating Industry Revenue Share (%), by Country 2024 & 2032
- Figure 22: North America Marine Anti-Fouling Coating Industry Volume Share (%), by Country 2024 & 2032
- Figure 23: MEA Marine Anti-Fouling Coating Industry Revenue (Million), by Country 2024 & 2032
- Figure 24: MEA Marine Anti-Fouling Coating Industry Volume (liter), by Country 2024 & 2032
- Figure 25: MEA Marine Anti-Fouling Coating Industry Revenue Share (%), by Country 2024 & 2032
- Figure 26: MEA Marine Anti-Fouling Coating Industry Volume Share (%), by Country 2024 & 2032
- Figure 27: Asia Pacific Marine Anti-Fouling Coating Industry Revenue (Million), by Type 2024 & 2032
- Figure 28: Asia Pacific Marine Anti-Fouling Coating Industry Volume (liter), by Type 2024 & 2032
- Figure 29: Asia Pacific Marine Anti-Fouling Coating Industry Revenue Share (%), by Type 2024 & 2032
- Figure 30: Asia Pacific Marine Anti-Fouling Coating Industry Volume Share (%), by Type 2024 & 2032
- Figure 31: Asia Pacific Marine Anti-Fouling Coating Industry Revenue (Million), by Application 2024 & 2032
- Figure 32: Asia Pacific Marine Anti-Fouling Coating Industry Volume (liter), by Application 2024 & 2032
- Figure 33: Asia Pacific Marine Anti-Fouling Coating Industry Revenue Share (%), by Application 2024 & 2032
- Figure 34: Asia Pacific Marine Anti-Fouling Coating Industry Volume Share (%), by Application 2024 & 2032
- Figure 35: Asia Pacific Marine Anti-Fouling Coating Industry Revenue (Million), by Country 2024 & 2032
- Figure 36: Asia Pacific Marine Anti-Fouling Coating Industry Volume (liter), by Country 2024 & 2032
- Figure 37: Asia Pacific Marine Anti-Fouling Coating Industry Revenue Share (%), by Country 2024 & 2032
- Figure 38: Asia Pacific Marine Anti-Fouling Coating Industry Volume Share (%), by Country 2024 & 2032
- Figure 39: North America Marine Anti-Fouling Coating Industry Revenue (Million), by Type 2024 & 2032
- Figure 40: North America Marine Anti-Fouling Coating Industry Volume (liter), by Type 2024 & 2032
- Figure 41: North America Marine Anti-Fouling Coating Industry Revenue Share (%), by Type 2024 & 2032
- Figure 42: North America Marine Anti-Fouling Coating Industry Volume Share (%), by Type 2024 & 2032
- Figure 43: North America Marine Anti-Fouling Coating Industry Revenue (Million), by Application 2024 & 2032
- Figure 44: North America Marine Anti-Fouling Coating Industry Volume (liter), by Application 2024 & 2032
- Figure 45: North America Marine Anti-Fouling Coating Industry Revenue Share (%), by Application 2024 & 2032
- Figure 46: North America Marine Anti-Fouling Coating Industry Volume Share (%), by Application 2024 & 2032
- Figure 47: North America Marine Anti-Fouling Coating Industry Revenue (Million), by Country 2024 & 2032
- Figure 48: North America Marine Anti-Fouling Coating Industry Volume (liter), by Country 2024 & 2032
- Figure 49: North America Marine Anti-Fouling Coating Industry Revenue Share (%), by Country 2024 & 2032
- Figure 50: North America Marine Anti-Fouling Coating Industry Volume Share (%), by Country 2024 & 2032
- Figure 51: Europe Marine Anti-Fouling Coating Industry Revenue (Million), by Type 2024 & 2032
- Figure 52: Europe Marine Anti-Fouling Coating Industry Volume (liter), by Type 2024 & 2032
- Figure 53: Europe Marine Anti-Fouling Coating Industry Revenue Share (%), by Type 2024 & 2032
- Figure 54: Europe Marine Anti-Fouling Coating Industry Volume Share (%), by Type 2024 & 2032
- Figure 55: Europe Marine Anti-Fouling Coating Industry Revenue (Million), by Application 2024 & 2032
- Figure 56: Europe Marine Anti-Fouling Coating Industry Volume (liter), by Application 2024 & 2032
- Figure 57: Europe Marine Anti-Fouling Coating Industry Revenue Share (%), by Application 2024 & 2032
- Figure 58: Europe Marine Anti-Fouling Coating Industry Volume Share (%), by Application 2024 & 2032
- Figure 59: Europe Marine Anti-Fouling Coating Industry Revenue (Million), by Country 2024 & 2032
- Figure 60: Europe Marine Anti-Fouling Coating Industry Volume (liter), by Country 2024 & 2032
- Figure 61: Europe Marine Anti-Fouling Coating Industry Revenue Share (%), by Country 2024 & 2032
- Figure 62: Europe Marine Anti-Fouling Coating Industry Volume Share (%), by Country 2024 & 2032
- Figure 63: South America Marine Anti-Fouling Coating Industry Revenue (Million), by Type 2024 & 2032
- Figure 64: South America Marine Anti-Fouling Coating Industry Volume (liter), by Type 2024 & 2032
- Figure 65: South America Marine Anti-Fouling Coating Industry Revenue Share (%), by Type 2024 & 2032
- Figure 66: South America Marine Anti-Fouling Coating Industry Volume Share (%), by Type 2024 & 2032
- Figure 67: South America Marine Anti-Fouling Coating Industry Revenue (Million), by Application 2024 & 2032
- Figure 68: South America Marine Anti-Fouling Coating Industry Volume (liter), by Application 2024 & 2032
- Figure 69: South America Marine Anti-Fouling Coating Industry Revenue Share (%), by Application 2024 & 2032
- Figure 70: South America Marine Anti-Fouling Coating Industry Volume Share (%), by Application 2024 & 2032
- Figure 71: South America Marine Anti-Fouling Coating Industry Revenue (Million), by Country 2024 & 2032
- Figure 72: South America Marine Anti-Fouling Coating Industry Volume (liter), by Country 2024 & 2032
- Figure 73: South America Marine Anti-Fouling Coating Industry Revenue Share (%), by Country 2024 & 2032
- Figure 74: South America Marine Anti-Fouling Coating Industry Volume Share (%), by Country 2024 & 2032
- Figure 75: Middle East and Africa Marine Anti-Fouling Coating Industry Revenue (Million), by Type 2024 & 2032
- Figure 76: Middle East and Africa Marine Anti-Fouling Coating Industry Volume (liter), by Type 2024 & 2032
- Figure 77: Middle East and Africa Marine Anti-Fouling Coating Industry Revenue Share (%), by Type 2024 & 2032
- Figure 78: Middle East and Africa Marine Anti-Fouling Coating Industry Volume Share (%), by Type 2024 & 2032
- Figure 79: Middle East and Africa Marine Anti-Fouling Coating Industry Revenue (Million), by Application 2024 & 2032
- Figure 80: Middle East and Africa Marine Anti-Fouling Coating Industry Volume (liter), by Application 2024 & 2032
- Figure 81: Middle East and Africa Marine Anti-Fouling Coating Industry Revenue Share (%), by Application 2024 & 2032
- Figure 82: Middle East and Africa Marine Anti-Fouling Coating Industry Volume Share (%), by Application 2024 & 2032
- Figure 83: Middle East and Africa Marine Anti-Fouling Coating Industry Revenue (Million), by Country 2024 & 2032
- Figure 84: Middle East and Africa Marine Anti-Fouling Coating Industry Volume (liter), by Country 2024 & 2032
- Figure 85: Middle East and Africa Marine Anti-Fouling Coating Industry Revenue Share (%), by Country 2024 & 2032
- Figure 86: Middle East and Africa Marine Anti-Fouling Coating Industry Volume Share (%), by Country 2024 & 2032
List of Tables
- Table 1: Global Marine Anti-Fouling Coating Industry Revenue Million Forecast, by Region 2019 & 2032
- Table 2: Global Marine Anti-Fouling Coating Industry Volume liter Forecast, by Region 2019 & 2032
- Table 3: Global Marine Anti-Fouling Coating Industry Revenue Million Forecast, by Type 2019 & 2032
- Table 4: Global Marine Anti-Fouling Coating Industry Volume liter Forecast, by Type 2019 & 2032
- Table 5: Global Marine Anti-Fouling Coating Industry Revenue Million Forecast, by Application 2019 & 2032
- Table 6: Global Marine Anti-Fouling Coating Industry Volume liter Forecast, by Application 2019 & 2032
- Table 7: Global Marine Anti-Fouling Coating Industry Revenue Million Forecast, by Region 2019 & 2032
- Table 8: Global Marine Anti-Fouling Coating Industry Volume liter Forecast, by Region 2019 & 2032
- Table 9: Global Marine Anti-Fouling Coating Industry Revenue Million Forecast, by Country 2019 & 2032
- Table 10: Global Marine Anti-Fouling Coating Industry Volume liter Forecast, by Country 2019 & 2032
- Table 11: United States Marine Anti-Fouling Coating Industry Revenue (Million) Forecast, by Application 2019 & 2032
- Table 12: United States Marine Anti-Fouling Coating Industry Volume (liter) Forecast, by Application 2019 & 2032
- Table 13: Canada Marine Anti-Fouling Coating Industry Revenue (Million) Forecast, by Application 2019 & 2032
- Table 14: Canada Marine Anti-Fouling Coating Industry Volume (liter) Forecast, by Application 2019 & 2032
- Table 15: Mexico Marine Anti-Fouling Coating Industry Revenue (Million) Forecast, by Application 2019 & 2032
- Table 16: Mexico Marine Anti-Fouling Coating Industry Volume (liter) Forecast, by Application 2019 & 2032
- Table 17: Global Marine Anti-Fouling Coating Industry Revenue Million Forecast, by Country 2019 & 2032
- Table 18: Global Marine Anti-Fouling Coating Industry Volume liter Forecast, by Country 2019 & 2032
- Table 19: Germany Marine Anti-Fouling Coating Industry Revenue (Million) Forecast, by Application 2019 & 2032
- Table 20: Germany Marine Anti-Fouling Coating Industry Volume (liter) Forecast, by Application 2019 & 2032
- Table 21: United Kingdom Marine Anti-Fouling Coating Industry Revenue (Million) Forecast, by Application 2019 & 2032
- Table 22: United Kingdom Marine Anti-Fouling Coating Industry Volume (liter) Forecast, by Application 2019 & 2032
- Table 23: France Marine Anti-Fouling Coating Industry Revenue (Million) Forecast, by Application 2019 & 2032
- Table 24: France Marine Anti-Fouling Coating Industry Volume (liter) Forecast, by Application 2019 & 2032
- Table 25: Spain Marine Anti-Fouling Coating Industry Revenue (Million) Forecast, by Application 2019 & 2032
- Table 26: Spain Marine Anti-Fouling Coating Industry Volume (liter) Forecast, by Application 2019 & 2032
- Table 27: Italy Marine Anti-Fouling Coating Industry Revenue (Million) Forecast, by Application 2019 & 2032
- Table 28: Italy Marine Anti-Fouling Coating Industry Volume (liter) Forecast, by Application 2019 & 2032
- Table 29: Spain Marine Anti-Fouling Coating Industry Revenue (Million) Forecast, by Application 2019 & 2032
- Table 30: Spain Marine Anti-Fouling Coating Industry Volume (liter) Forecast, by Application 2019 & 2032
- Table 31: Belgium Marine Anti-Fouling Coating Industry Revenue (Million) Forecast, by Application 2019 & 2032
- Table 32: Belgium Marine Anti-Fouling Coating Industry Volume (liter) Forecast, by Application 2019 & 2032
- Table 33: Netherland Marine Anti-Fouling Coating Industry Revenue (Million) Forecast, by Application 2019 & 2032
- Table 34: Netherland Marine Anti-Fouling Coating Industry Volume (liter) Forecast, by Application 2019 & 2032
- Table 35: Nordics Marine Anti-Fouling Coating Industry Revenue (Million) Forecast, by Application 2019 & 2032
- Table 36: Nordics Marine Anti-Fouling Coating Industry Volume (liter) Forecast, by Application 2019 & 2032
- Table 37: Rest of Europe Marine Anti-Fouling Coating Industry Revenue (Million) Forecast, by Application 2019 & 2032
- Table 38: Rest of Europe Marine Anti-Fouling Coating Industry Volume (liter) Forecast, by Application 2019 & 2032
- Table 39: Global Marine Anti-Fouling Coating Industry Revenue Million Forecast, by Country 2019 & 2032
- Table 40: Global Marine Anti-Fouling Coating Industry Volume liter Forecast, by Country 2019 & 2032
- Table 41: China Marine Anti-Fouling Coating Industry Revenue (Million) Forecast, by Application 2019 & 2032
- Table 42: China Marine Anti-Fouling Coating Industry Volume (liter) Forecast, by Application 2019 & 2032
- Table 43: Japan Marine Anti-Fouling Coating Industry Revenue (Million) Forecast, by Application 2019 & 2032
- Table 44: Japan Marine Anti-Fouling Coating Industry Volume (liter) Forecast, by Application 2019 & 2032
- Table 45: India Marine Anti-Fouling Coating Industry Revenue (Million) Forecast, by Application 2019 & 2032
- Table 46: India Marine Anti-Fouling Coating Industry Volume (liter) Forecast, by Application 2019 & 2032
- Table 47: South Korea Marine Anti-Fouling Coating Industry Revenue (Million) Forecast, by Application 2019 & 2032
- Table 48: South Korea Marine Anti-Fouling Coating Industry Volume (liter) Forecast, by Application 2019 & 2032
- Table 49: Southeast Asia Marine Anti-Fouling Coating Industry Revenue (Million) Forecast, by Application 2019 & 2032
- Table 50: Southeast Asia Marine Anti-Fouling Coating Industry Volume (liter) Forecast, by Application 2019 & 2032
- Table 51: Australia Marine Anti-Fouling Coating Industry Revenue (Million) Forecast, by Application 2019 & 2032
- Table 52: Australia Marine Anti-Fouling Coating Industry Volume (liter) Forecast, by Application 2019 & 2032
- Table 53: Indonesia Marine Anti-Fouling Coating Industry Revenue (Million) Forecast, by Application 2019 & 2032
- Table 54: Indonesia Marine Anti-Fouling Coating Industry Volume (liter) Forecast, by Application 2019 & 2032
- Table 55: Phillipes Marine Anti-Fouling Coating Industry Revenue (Million) Forecast, by Application 2019 & 2032
- Table 56: Phillipes Marine Anti-Fouling Coating Industry Volume (liter) Forecast, by Application 2019 & 2032
- Table 57: Singapore Marine Anti-Fouling Coating Industry Revenue (Million) Forecast, by Application 2019 & 2032
- Table 58: Singapore Marine Anti-Fouling Coating Industry Volume (liter) Forecast, by Application 2019 & 2032
- Table 59: Thailandc Marine Anti-Fouling Coating Industry Revenue (Million) Forecast, by Application 2019 & 2032
- Table 60: Thailandc Marine Anti-Fouling Coating Industry Volume (liter) Forecast, by Application 2019 & 2032
- Table 61: Rest of Asia Pacific Marine Anti-Fouling Coating Industry Revenue (Million) Forecast, by Application 2019 & 2032
- Table 62: Rest of Asia Pacific Marine Anti-Fouling Coating Industry Volume (liter) Forecast, by Application 2019 & 2032
- Table 63: Global Marine Anti-Fouling Coating Industry Revenue Million Forecast, by Country 2019 & 2032
- Table 64: Global Marine Anti-Fouling Coating Industry Volume liter Forecast, by Country 2019 & 2032
- Table 65: Brazil Marine Anti-Fouling Coating Industry Revenue (Million) Forecast, by Application 2019 & 2032
- Table 66: Brazil Marine Anti-Fouling Coating Industry Volume (liter) Forecast, by Application 2019 & 2032
- Table 67: Argentina Marine Anti-Fouling Coating Industry Revenue (Million) Forecast, by Application 2019 & 2032
- Table 68: Argentina Marine Anti-Fouling Coating Industry Volume (liter) Forecast, by Application 2019 & 2032
- Table 69: Peru Marine Anti-Fouling Coating Industry Revenue (Million) Forecast, by Application 2019 & 2032
- Table 70: Peru Marine Anti-Fouling Coating Industry Volume (liter) Forecast, by Application 2019 & 2032
- Table 71: Chile Marine Anti-Fouling Coating Industry Revenue (Million) Forecast, by Application 2019 & 2032
- Table 72: Chile Marine Anti-Fouling Coating Industry Volume (liter) Forecast, by Application 2019 & 2032
- Table 73: Colombia Marine Anti-Fouling Coating Industry Revenue (Million) Forecast, by Application 2019 & 2032
- Table 74: Colombia Marine Anti-Fouling Coating Industry Volume (liter) Forecast, by Application 2019 & 2032
- Table 75: Ecuador Marine Anti-Fouling Coating Industry Revenue (Million) Forecast, by Application 2019 & 2032
- Table 76: Ecuador Marine Anti-Fouling Coating Industry Volume (liter) Forecast, by Application 2019 & 2032
- Table 77: Venezuela Marine Anti-Fouling Coating Industry Revenue (Million) Forecast, by Application 2019 & 2032
- Table 78: Venezuela Marine Anti-Fouling Coating Industry Volume (liter) Forecast, by Application 2019 & 2032
- Table 79: Rest of South America Marine Anti-Fouling Coating Industry Revenue (Million) Forecast, by Application 2019 & 2032
- Table 80: Rest of South America Marine Anti-Fouling Coating Industry Volume (liter) Forecast, by Application 2019 & 2032
- Table 81: Global Marine Anti-Fouling Coating Industry Revenue Million Forecast, by Country 2019 & 2032
- Table 82: Global Marine Anti-Fouling Coating Industry Volume liter Forecast, by Country 2019 & 2032
- Table 83: United States Marine Anti-Fouling Coating Industry Revenue (Million) Forecast, by Application 2019 & 2032
- Table 84: United States Marine Anti-Fouling Coating Industry Volume (liter) Forecast, by Application 2019 & 2032
- Table 85: Canada Marine Anti-Fouling Coating Industry Revenue (Million) Forecast, by Application 2019 & 2032
- Table 86: Canada Marine Anti-Fouling Coating Industry Volume (liter) Forecast, by Application 2019 & 2032
- Table 87: Mexico Marine Anti-Fouling Coating Industry Revenue (Million) Forecast, by Application 2019 & 2032
- Table 88: Mexico Marine Anti-Fouling Coating Industry Volume (liter) Forecast, by Application 2019 & 2032
- Table 89: Global Marine Anti-Fouling Coating Industry Revenue Million Forecast, by Country 2019 & 2032
- Table 90: Global Marine Anti-Fouling Coating Industry Volume liter Forecast, by Country 2019 & 2032
- Table 91: United Arab Emirates Marine Anti-Fouling Coating Industry Revenue (Million) Forecast, by Application 2019 & 2032
- Table 92: United Arab Emirates Marine Anti-Fouling Coating Industry Volume (liter) Forecast, by Application 2019 & 2032
- Table 93: Saudi Arabia Marine Anti-Fouling Coating Industry Revenue (Million) Forecast, by Application 2019 & 2032
- Table 94: Saudi Arabia Marine Anti-Fouling Coating Industry Volume (liter) Forecast, by Application 2019 & 2032
- Table 95: South Africa Marine Anti-Fouling Coating Industry Revenue (Million) Forecast, by Application 2019 & 2032
- Table 96: South Africa Marine Anti-Fouling Coating Industry Volume (liter) Forecast, by Application 2019 & 2032
- Table 97: Rest of Middle East and Africa Marine Anti-Fouling Coating Industry Revenue (Million) Forecast, by Application 2019 & 2032
- Table 98: Rest of Middle East and Africa Marine Anti-Fouling Coating Industry Volume (liter) Forecast, by Application 2019 & 2032
- Table 99: Global Marine Anti-Fouling Coating Industry Revenue Million Forecast, by Type 2019 & 2032
- Table 100: Global Marine Anti-Fouling Coating Industry Volume liter Forecast, by Type 2019 & 2032
- Table 101: Global Marine Anti-Fouling Coating Industry Revenue Million Forecast, by Application 2019 & 2032
- Table 102: Global Marine Anti-Fouling Coating Industry Volume liter Forecast, by Application 2019 & 2032
- Table 103: Global Marine Anti-Fouling Coating Industry Revenue Million Forecast, by Country 2019 & 2032
- Table 104: Global Marine Anti-Fouling Coating Industry Volume liter Forecast, by Country 2019 & 2032
- Table 105: China Marine Anti-Fouling Coating Industry Revenue (Million) Forecast, by Application 2019 & 2032
- Table 106: China Marine Anti-Fouling Coating Industry Volume (liter) Forecast, by Application 2019 & 2032
- Table 107: India Marine Anti-Fouling Coating Industry Revenue (Million) Forecast, by Application 2019 & 2032
- Table 108: India Marine Anti-Fouling Coating Industry Volume (liter) Forecast, by Application 2019 & 2032
- Table 109: Japan Marine Anti-Fouling Coating Industry Revenue (Million) Forecast, by Application 2019 & 2032
- Table 110: Japan Marine Anti-Fouling Coating Industry Volume (liter) Forecast, by Application 2019 & 2032
- Table 111: South Korea Marine Anti-Fouling Coating Industry Revenue (Million) Forecast, by Application 2019 & 2032
- Table 112: South Korea Marine Anti-Fouling Coating Industry Volume (liter) Forecast, by Application 2019 & 2032
- Table 113: Thailand Marine Anti-Fouling Coating Industry Revenue (Million) Forecast, by Application 2019 & 2032
- Table 114: Thailand Marine Anti-Fouling Coating Industry Volume (liter) Forecast, by Application 2019 & 2032
- Table 115: Vietnam Marine Anti-Fouling Coating Industry Revenue (Million) Forecast, by Application 2019 & 2032
- Table 116: Vietnam Marine Anti-Fouling Coating Industry Volume (liter) Forecast, by Application 2019 & 2032
- Table 117: Indonesia Marine Anti-Fouling Coating Industry Revenue (Million) Forecast, by Application 2019 & 2032
- Table 118: Indonesia Marine Anti-Fouling Coating Industry Volume (liter) Forecast, by Application 2019 & 2032
- Table 119: Malaysia Marine Anti-Fouling Coating Industry Revenue (Million) Forecast, by Application 2019 & 2032
- Table 120: Malaysia Marine Anti-Fouling Coating Industry Volume (liter) Forecast, by Application 2019 & 2032
- Table 121: Rest of Asia Pacific Marine Anti-Fouling Coating Industry Revenue (Million) Forecast, by Application 2019 & 2032
- Table 122: Rest of Asia Pacific Marine Anti-Fouling Coating Industry Volume (liter) Forecast, by Application 2019 & 2032
- Table 123: Global Marine Anti-Fouling Coating Industry Revenue Million Forecast, by Type 2019 & 2032
- Table 124: Global Marine Anti-Fouling Coating Industry Volume liter Forecast, by Type 2019 & 2032
- Table 125: Global Marine Anti-Fouling Coating Industry Revenue Million Forecast, by Application 2019 & 2032
- Table 126: Global Marine Anti-Fouling Coating Industry Volume liter Forecast, by Application 2019 & 2032
- Table 127: Global Marine Anti-Fouling Coating Industry Revenue Million Forecast, by Country 2019 & 2032
- Table 128: Global Marine Anti-Fouling Coating Industry Volume liter Forecast, by Country 2019 & 2032
- Table 129: United States Marine Anti-Fouling Coating Industry Revenue (Million) Forecast, by Application 2019 & 2032
- Table 130: United States Marine Anti-Fouling Coating Industry Volume (liter) Forecast, by Application 2019 & 2032
- Table 131: Canada Marine Anti-Fouling Coating Industry Revenue (Million) Forecast, by Application 2019 & 2032
- Table 132: Canada Marine Anti-Fouling Coating Industry Volume (liter) Forecast, by Application 2019 & 2032
- Table 133: Mexico Marine Anti-Fouling Coating Industry Revenue (Million) Forecast, by Application 2019 & 2032
- Table 134: Mexico Marine Anti-Fouling Coating Industry Volume (liter) Forecast, by Application 2019 & 2032
- Table 135: Global Marine Anti-Fouling Coating Industry Revenue Million Forecast, by Type 2019 & 2032
- Table 136: Global Marine Anti-Fouling Coating Industry Volume liter Forecast, by Type 2019 & 2032
- Table 137: Global Marine Anti-Fouling Coating Industry Revenue Million Forecast, by Application 2019 & 2032
- Table 138: Global Marine Anti-Fouling Coating Industry Volume liter Forecast, by Application 2019 & 2032
- Table 139: Global Marine Anti-Fouling Coating Industry Revenue Million Forecast, by Country 2019 & 2032
- Table 140: Global Marine Anti-Fouling Coating Industry Volume liter Forecast, by Country 2019 & 2032
- Table 141: Germany Marine Anti-Fouling Coating Industry Revenue (Million) Forecast, by Application 2019 & 2032
- Table 142: Germany Marine Anti-Fouling Coating Industry Volume (liter) Forecast, by Application 2019 & 2032
- Table 143: United Kingdom Marine Anti-Fouling Coating Industry Revenue (Million) Forecast, by Application 2019 & 2032
- Table 144: United Kingdom Marine Anti-Fouling Coating Industry Volume (liter) Forecast, by Application 2019 & 2032
- Table 145: France Marine Anti-Fouling Coating Industry Revenue (Million) Forecast, by Application 2019 & 2032
- Table 146: France Marine Anti-Fouling Coating Industry Volume (liter) Forecast, by Application 2019 & 2032
- Table 147: Italy Marine Anti-Fouling Coating Industry Revenue (Million) Forecast, by Application 2019 & 2032
- Table 148: Italy Marine Anti-Fouling Coating Industry Volume (liter) Forecast, by Application 2019 & 2032
- Table 149: Spain Marine Anti-Fouling Coating Industry Revenue (Million) Forecast, by Application 2019 & 2032
- Table 150: Spain Marine Anti-Fouling Coating Industry Volume (liter) Forecast, by Application 2019 & 2032
- Table 151: Russia Marine Anti-Fouling Coating Industry Revenue (Million) Forecast, by Application 2019 & 2032
- Table 152: Russia Marine Anti-Fouling Coating Industry Volume (liter) Forecast, by Application 2019 & 2032
- Table 153: NORDIC Countries Marine Anti-Fouling Coating Industry Revenue (Million) Forecast, by Application 2019 & 2032
- Table 154: NORDIC Countries Marine Anti-Fouling Coating Industry Volume (liter) Forecast, by Application 2019 & 2032
- Table 155: Turkey Marine Anti-Fouling Coating Industry Revenue (Million) Forecast, by Application 2019 & 2032
- Table 156: Turkey Marine Anti-Fouling Coating Industry Volume (liter) Forecast, by Application 2019 & 2032
- Table 157: Rest of Europe Marine Anti-Fouling Coating Industry Revenue (Million) Forecast, by Application 2019 & 2032
- Table 158: Rest of Europe Marine Anti-Fouling Coating Industry Volume (liter) Forecast, by Application 2019 & 2032
- Table 159: Global Marine Anti-Fouling Coating Industry Revenue Million Forecast, by Type 2019 & 2032
- Table 160: Global Marine Anti-Fouling Coating Industry Volume liter Forecast, by Type 2019 & 2032
- Table 161: Global Marine Anti-Fouling Coating Industry Revenue Million Forecast, by Application 2019 & 2032
- Table 162: Global Marine Anti-Fouling Coating Industry Volume liter Forecast, by Application 2019 & 2032
- Table 163: Global Marine Anti-Fouling Coating Industry Revenue Million Forecast, by Country 2019 & 2032
- Table 164: Global Marine Anti-Fouling Coating Industry Volume liter Forecast, by Country 2019 & 2032
- Table 165: Brazil Marine Anti-Fouling Coating Industry Revenue (Million) Forecast, by Application 2019 & 2032
- Table 166: Brazil Marine Anti-Fouling Coating Industry Volume (liter) Forecast, by Application 2019 & 2032
- Table 167: Argentina Marine Anti-Fouling Coating Industry Revenue (Million) Forecast, by Application 2019 & 2032
- Table 168: Argentina Marine Anti-Fouling Coating Industry Volume (liter) Forecast, by Application 2019 & 2032
- Table 169: Colombia Marine Anti-Fouling Coating Industry Revenue (Million) Forecast, by Application 2019 & 2032
- Table 170: Colombia Marine Anti-Fouling Coating Industry Volume (liter) Forecast, by Application 2019 & 2032
- Table 171: Rest of South America Marine Anti-Fouling Coating Industry Revenue (Million) Forecast, by Application 2019 & 2032
- Table 172: Rest of South America Marine Anti-Fouling Coating Industry Volume (liter) Forecast, by Application 2019 & 2032
- Table 173: Global Marine Anti-Fouling Coating Industry Revenue Million Forecast, by Type 2019 & 2032
- Table 174: Global Marine Anti-Fouling Coating Industry Volume liter Forecast, by Type 2019 & 2032
- Table 175: Global Marine Anti-Fouling Coating Industry Revenue Million Forecast, by Application 2019 & 2032
- Table 176: Global Marine Anti-Fouling Coating Industry Volume liter Forecast, by Application 2019 & 2032
- Table 177: Global Marine Anti-Fouling Coating Industry Revenue Million Forecast, by Country 2019 & 2032
- Table 178: Global Marine Anti-Fouling Coating Industry Volume liter Forecast, by Country 2019 & 2032
- Table 179: Saudi Arabia Marine Anti-Fouling Coating Industry Revenue (Million) Forecast, by Application 2019 & 2032
- Table 180: Saudi Arabia Marine Anti-Fouling Coating Industry Volume (liter) Forecast, by Application 2019 & 2032
- Table 181: South Africa Marine Anti-Fouling Coating Industry Revenue (Million) Forecast, by Application 2019 & 2032
- Table 182: South Africa Marine Anti-Fouling Coating Industry Volume (liter) Forecast, by Application 2019 & 2032
- Table 183: Nigeria Marine Anti-Fouling Coating Industry Revenue (Million) Forecast, by Application 2019 & 2032
- Table 184: Nigeria Marine Anti-Fouling Coating Industry Volume (liter) Forecast, by Application 2019 & 2032
- Table 185: United Arab Emirates Marine Anti-Fouling Coating Industry Revenue (Million) Forecast, by Application 2019 & 2032
- Table 186: United Arab Emirates Marine Anti-Fouling Coating Industry Volume (liter) Forecast, by Application 2019 & 2032
- Table 187: Qatar Marine Anti-Fouling Coating Industry Revenue (Million) Forecast, by Application 2019 & 2032
- Table 188: Qatar Marine Anti-Fouling Coating Industry Volume (liter) Forecast, by Application 2019 & 2032
- Table 189: Egypt Marine Anti-Fouling Coating Industry Revenue (Million) Forecast, by Application 2019 & 2032
- Table 190: Egypt Marine Anti-Fouling Coating Industry Volume (liter) Forecast, by Application 2019 & 2032
- Table 191: Rest of Middle East and Africa Marine Anti-Fouling Coating Industry Revenue (Million) Forecast, by Application 2019 & 2032
- Table 192: Rest of Middle East and Africa Marine Anti-Fouling Coating Industry Volume (liter) Forecast, by Application 2019 & 2032
Frequently Asked Questions
1. What is the projected Compound Annual Growth Rate (CAGR) of the Marine Anti-Fouling Coating Industry?
The projected CAGR is approximately > 4.00%.
2. Which companies are prominent players in the Marine Anti-Fouling Coating Industry?
Key companies in the market include The Sherwin-Williams Company*List Not Exhaustive, Axalta Coatings Systems, Chugoku Marine Paints Ltd, Jotun, Boero, RPM International Inc, Kansai Paint Co Ltd, Akzo Nobel NV, PPG Industries Inc, Nippon Paint Marine Coatings Co Ltd, BASF SE, Hempel A/S, Lanxess.
3. What are the main segments of the Marine Anti-Fouling Coating Industry?
The market segments include Type, Application.
4. Can you provide details about the market size?
The market size is estimated to be USD 1.97 Million as of 2022.
5. What are some drivers contributing to market growth?
Increasing Production of Leisure Boats and Cruise Ships; Increase in Ship Repairs and Maintenance Activities; Surging Demand from Oil and Gas Industry.
6. What are the notable trends driving market growth?
Hull Coatings Segment to Dominate the Market.
7. Are there any restraints impacting market growth?
Stringent Government Regulations; Increased Usage of High-standard Durable Products.
8. Can you provide examples of recent developments in the market?
March 2024: PPG Industries Inc. launched PPG Nexeon 810, a copper-free antifouling coating developed with an emphasis on vessel performance, emissions reduction, and sustainability. It can yield an immediate boost in power of up to 10% and enhance operational efficiency by up to 15% due to improved fouling control performance.
9. What pricing options are available for accessing the report?
Pricing options include single-user, multi-user, and enterprise licenses priced at USD 4750, USD 5250, and USD 8750 respectively.
10. Is the market size provided in terms of value or volume?
The market size is provided in terms of value, measured in Million and volume, measured in liter.
11. Are there any specific market keywords associated with the report?
Yes, the market keyword associated with the report is "Marine Anti-Fouling Coating Industry," which aids in identifying and referencing the specific market segment covered.
12. How do I determine which pricing option suits my needs best?
The pricing options vary based on user requirements and access needs. Individual users may opt for single-user licenses, while businesses requiring broader access may choose multi-user or enterprise licenses for cost-effective access to the report.
13. Are there any additional resources or data provided in the Marine Anti-Fouling Coating Industry report?
While the report offers comprehensive insights, it's advisable to review the specific contents or supplementary materials provided to ascertain if additional resources or data are available.
14. How can I stay updated on further developments or reports in the Marine Anti-Fouling Coating Industry?
To stay informed about further developments, trends, and reports in the Marine Anti-Fouling Coating Industry, consider subscribing to industry newsletters, following relevant companies and organizations, or regularly checking reputable industry news sources and publications.
Methodology
Step 1 - Identification of Relevant Samples Size from Population Database


Step 2 - Approaches for Defining Global Market Size (Value, Volume* & Price*)

Note*: In applicable scenarios
Step 3 - Data Sources
Primary Research
- Web Analytics
- Survey Reports
- Research Institute
- Latest Research Reports
- Opinion Leaders
Secondary Research
- Annual Reports
- White Paper
- Latest Press Release
- Industry Association
- Paid Database
- Investor Presentations

Step 4 - Data Triangulation
Involves using different sources of information in order to increase the validity of a study
These sources are likely to be stakeholders in a program - participants, other researchers, program staff, other community members, and so on.
Then we put all data in single framework & apply various statistical tools to find out the dynamic on the market.
During the analysis stage, feedback from the stakeholder groups would be compared to determine areas of agreement as well as areas of divergence


