
Key Insights
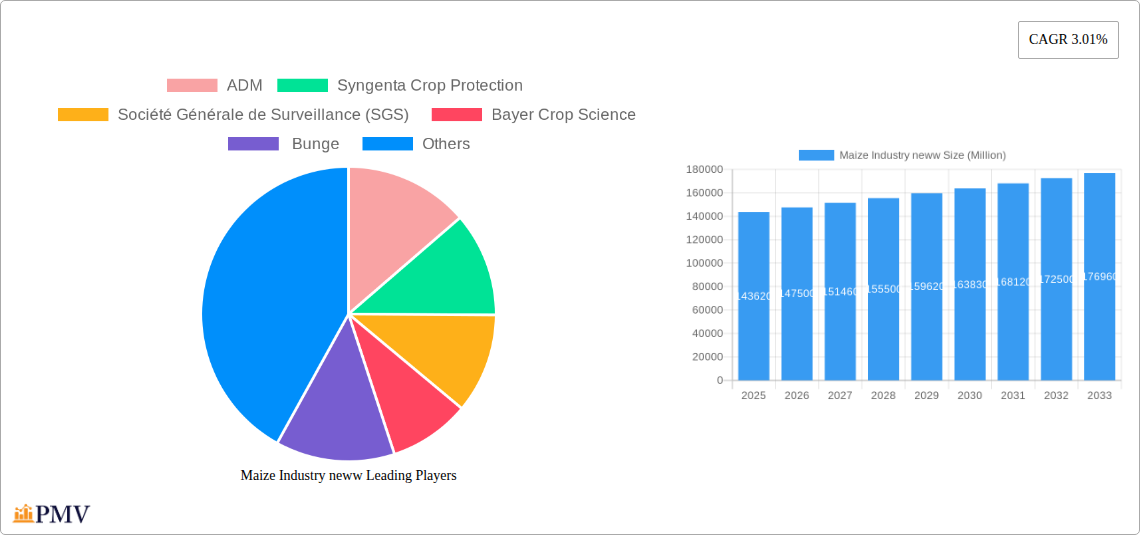
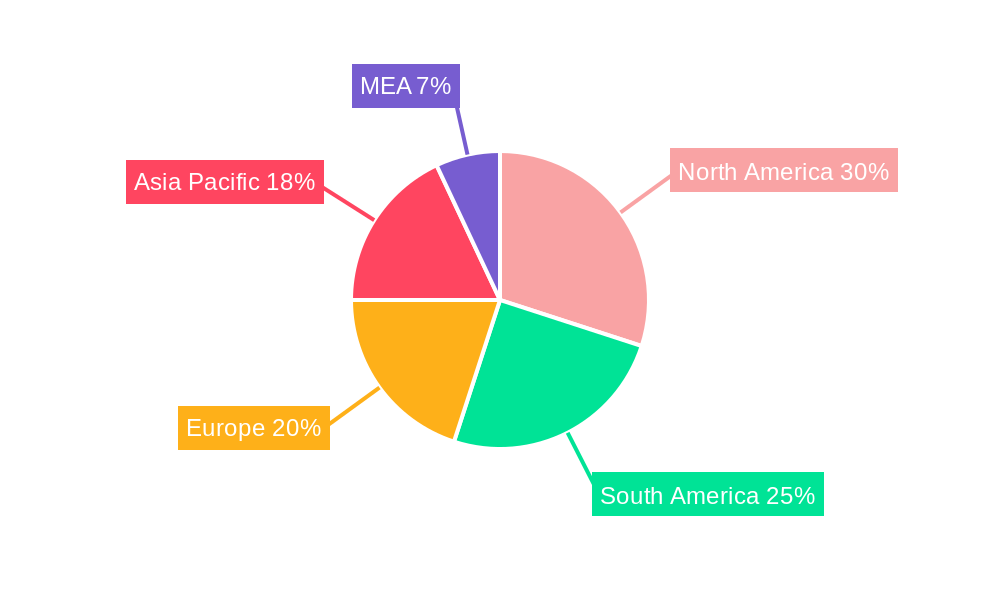
The global maize industry, valued at $143.62 billion in 2025, is projected to experience steady growth, driven by rising global demand for food, feed, and biofuels. A compound annual growth rate (CAGR) of 3.01% from 2025 to 2033 indicates a robust, albeit moderate, expansion. Key drivers include increasing global population and the consequent rise in food consumption, particularly in developing economies. The growing demand for livestock feed, coupled with the increasing use of maize in biofuel production, further fuels market growth. However, factors such as fluctuating weather patterns impacting yields and the rising costs of agricultural inputs (fertilizers, pesticides) pose significant restraints on market expansion. Market segmentation reveals that hybrid seeds hold a significant share of the product type segment, while the food and beverage industry dominates the end-user segment, reflecting maize's versatility as both a direct food source and a key ingredient in processed foods. Regional analysis shows a significant presence in North America and South America, with substantial growth potential in Asia-Pacific driven by increasing consumption and agricultural production in countries like China and India.
The competitive landscape is characterized by the presence of major agricultural giants like ADM, Syngenta, Bayer, Bunge, Cargill, and Corteva Agriscience. These companies play a crucial role in the production, processing, and distribution of maize products globally, leveraging advanced technologies and supply chain management to meet the growing demand. Strategic partnerships, acquisitions, and technological advancements in seed development and crop protection are key competitive strategies employed within the industry. The future growth of the maize market will depend on effectively addressing challenges like climate change impacts, optimizing agricultural practices for higher yields while minimizing environmental impact, and ensuring food security in a growing global population. Further expansion into innovative applications of maize, such as in the biomaterials sector, could further propel market growth in the coming years.
Maize Industry Market Report: 2019-2033
This comprehensive report provides a detailed analysis of the global maize industry, offering invaluable insights for businesses, investors, and stakeholders seeking to understand and capitalize on this dynamic market. With a study period spanning 2019-2033, a base year of 2025, and a forecast period of 2025-2033, this report delivers a holistic view of past performance, current trends, and future projections. The global maize market is estimated to be worth xx Million in 2025 and is projected to reach xx Million by 2033, exhibiting a CAGR of xx%.
Maize Industry Market Structure & Competitive Dynamics
The global maize market exhibits a moderately concentrated structure, with key players like ADM, Cargill, Incorporated, Bunge Limited, Corteva Agriscience, and Syngenta Crop Protection holding significant market share. Market concentration is influenced by factors such as economies of scale, access to technology, and global distribution networks. Innovation within the industry is driven by advancements in hybrid seed technology, precision agriculture, and biofuel production. Regulatory frameworks, varying by region, impact production practices, trade policies, and labeling requirements. Product substitutes, such as other grains and alternative biofuel sources, exert competitive pressure. End-user trends, particularly in the food & beverage and feed sectors, shape demand for specific maize varieties and qualities. Mergers and acquisitions (M&A) activities, exemplified by deals valued at xx Million in the last five years, are reshaping the competitive landscape and driving consolidation. The estimated average deal value was xx Million during 2019-2024, with ADM and Cargill being involved in most of the deals.
- Market Share: ADM (xx%), Cargill (xx%), Bunge (xx%), Corteva (xx%), Syngenta (xx%), Others (xx%)
- M&A Activity (2019-2024): xx deals totaling xx Million
Maize Industry Industry Trends & Insights
The maize industry is experiencing significant growth driven by several key factors. Rising global population and increasing demand for food and feed are primary drivers. Technological advancements in hybrid seed development are leading to higher yields and improved crop resilience. The increasing demand for biofuels is also creating new market opportunities. Consumer preferences are shifting towards healthier and more sustainably produced maize products. Competitive dynamics are intensifying, with companies investing in research and development to enhance product quality, yield, and sustainability. The market penetration of hybrid maize seeds continues to rise, exceeding xx% in developed regions and steadily increasing in developing countries. The overall market experienced a CAGR of xx% during the historical period (2019-2024), indicating robust growth prospects. Challenges such as climate change, fluctuating commodity prices, and pest infestations pose ongoing risks.
Dominant Markets & Segments in Maize Industry
The maize market exhibits regional variations in dominance. North America and South America currently hold significant market share due to large-scale production and favorable growing conditions. Asia is a rapidly growing market driven by increasing population and livestock production. Within product types, yellow maize maintains the largest segment share, followed by white maize and hybrid seeds. The feed industry consumes the largest volume of maize, followed by the food and beverage sector, while biofuels are an emerging significant segment.
- Key Drivers for Dominance:
- North America/South America: Favorable climate, established agricultural infrastructure, advanced farming techniques.
- Asia: Rapid population growth, expanding livestock sector, rising disposable incomes.
- Yellow Maize: Versatile applications across various end-use sectors, cost-effectiveness.
- Feed Industry: High demand from livestock production, significant portion of maize consumption.
Maize Industry Product Innovations
Recent product innovations in the maize industry focus on developing improved hybrid varieties with higher yields, enhanced disease resistance, and improved nutritional content. Gene editing technologies are being explored to further enhance these characteristics. These innovations aim to meet the growing demand for sustainable and efficient maize production, catering to the needs of diverse end-users, while simultaneously addressing climate change concerns. The development of drought-resistant varieties has become a significant area of focus.
Report Segmentation & Scope
This report segments the maize market by product type (Hybrid Seeds, Yellow Maize, White Maize, Sweet Corn, Popcorn) and end-user (Food & Beverage, Feed, Biofuels). Each segment is analyzed in detail, including historical data, current market size, growth projections for the forecast period, and competitive dynamics. For example, the hybrid seeds segment is projected to grow at a CAGR of xx% due to increased adoption by farmers. The food and beverage segment is expected to witness steady growth, driven by rising consumption of processed food products. Biofuels represent a rapidly growing segment fueled by governmental policies supporting renewable energy sources. The market size for each segment is projected to be xx Million in 2025.
Key Drivers of Maize Industry Growth
Several factors fuel the growth of the maize industry. Technological advancements, including improved seed varieties and precision farming techniques, enhance productivity and efficiency. Growing global population and rising demand for food and feed products drive market expansion. Government policies and initiatives supporting agricultural development and biofuel production further stimulate growth. Finally, increasing investments in infrastructure and research & development contribute to overall industry expansion.
Challenges in the Maize Industry Sector
The maize industry faces challenges such as climate change, resulting in unpredictable weather patterns and reduced yields (estimated impact: xx% reduction in yield in certain regions). Fluctuating commodity prices and supply chain disruptions, especially following events like the COVID-19 pandemic, impact profitability. Furthermore, intense competition among industry players and the need for sustainable production practices present significant hurdles.
Leading Players in the Maize Industry Market
- ADM
- Syngenta Crop Protection
- Société Générale de Surveillance (SGS)
- Bayer Crop Science
- Bunge
- Bunge Limited
- Cargill, Incorporated
- Corteva Agriscience
- ADM
- Olam Group
Key Developments in Maize Industry Sector
- November 2021: Fufeng Group announced plans to build a USD 700 Million corn wet milling plant in the US, signifying expansion in value-added maize products.
- May 2022: The Indian government announced initiatives to boost maize production, including MSP (Minimum Support Price), indicating government support for the sector.
- October 2022: Ghana inaugurated a modern maize processing factory, demonstrating investments in infrastructure and value chain development.
Strategic Maize Industry Market Outlook
The maize industry exhibits strong growth potential, fueled by increasing demand for food, feed, and biofuels. Strategic opportunities lie in developing innovative hybrid seeds, advancing precision agriculture, investing in sustainable production practices, and expanding into value-added maize products. Companies that can effectively navigate the challenges of climate change, supply chain vulnerabilities, and competition are poised for significant success in this dynamic market. The future growth trajectory is expected to be positive, with increasing emphasis on sustainable and efficient farming methods.
Maize Industry neww Segmentation
- 1. Production Analysis
- 2. Consumption Analysis
- 3. Import Market Analysis (Value & Volume)
- 4. Export Market Analysis (Value & Volume)
- 5. Price Trend Analysis
Maize Industry neww Segmentation By Geography
-
1. North America
- 1.1. United States
- 1.2. Canada
- 1.3. Mexico
-
2. Europe
- 2.1. Spain
- 2.2. Italy
- 2.3. France
- 2.4. Germany
- 2.5. Russia
-
3. Asia Pacific
- 3.1. India
- 3.2. China
- 3.3. Vietnam
-
4. South America
- 4.1. Brazil
- 4.2. Argentina
-
5. Africa
- 5.1. South Africa
- 5.2. Nigeria
Maize Industry neww REPORT HIGHLIGHTS
| Aspects | Details |
|---|---|
| Study Period | 2019-2033 |
| Base Year | 2024 |
| Estimated Year | 2025 |
| Forecast Period | 2025-2033 |
| Historical Period | 2019-2024 |
| Growth Rate | CAGR of 3.01% from 2019-2033 |
| Segmentation |
|
Table of Contents
- 1. Introduction
- 1.1. Research Scope
- 1.2. Market Segmentation
- 1.3. Research Methodology
- 1.4. Definitions and Assumptions
- 2. Executive Summary
- 2.1. Introduction
- 3. Market Dynamics
- 3.1. Introduction
- 3.2. Market Drivers
- 3.3. Market Restrains
- 3.4. Market Trends
- 3.4.1. Increase in Demand for Animal-based Protein Sources
- 4. Market Factor Analysis
- 4.1. Porters Five Forces
- 4.2. Supply/Value Chain
- 4.3. PESTEL analysis
- 4.4. Market Entropy
- 4.5. Patent/Trademark Analysis
- 5. Global Maize Industry neww Analysis, Insights and Forecast, 2019-2031
- 5.1. Market Analysis, Insights and Forecast - by Production Analysis
- 5.2. Market Analysis, Insights and Forecast - by Consumption Analysis
- 5.3. Market Analysis, Insights and Forecast - by Import Market Analysis (Value & Volume)
- 5.4. Market Analysis, Insights and Forecast - by Export Market Analysis (Value & Volume)
- 5.5. Market Analysis, Insights and Forecast - by Price Trend Analysis
- 5.6. Market Analysis, Insights and Forecast - by Region
- 5.6.1. North America
- 5.6.2. Europe
- 5.6.3. Asia Pacific
- 5.6.4. South America
- 5.6.5. Africa
- 5.1. Market Analysis, Insights and Forecast - by Production Analysis
- 6. North America Maize Industry neww Analysis, Insights and Forecast, 2019-2031
- 6.1. Market Analysis, Insights and Forecast - by Production Analysis
- 6.2. Market Analysis, Insights and Forecast - by Consumption Analysis
- 6.3. Market Analysis, Insights and Forecast - by Import Market Analysis (Value & Volume)
- 6.4. Market Analysis, Insights and Forecast - by Export Market Analysis (Value & Volume)
- 6.5. Market Analysis, Insights and Forecast - by Price Trend Analysis
- 6.1. Market Analysis, Insights and Forecast - by Production Analysis
- 7. Europe Maize Industry neww Analysis, Insights and Forecast, 2019-2031
- 7.1. Market Analysis, Insights and Forecast - by Production Analysis
- 7.2. Market Analysis, Insights and Forecast - by Consumption Analysis
- 7.3. Market Analysis, Insights and Forecast - by Import Market Analysis (Value & Volume)
- 7.4. Market Analysis, Insights and Forecast - by Export Market Analysis (Value & Volume)
- 7.5. Market Analysis, Insights and Forecast - by Price Trend Analysis
- 7.1. Market Analysis, Insights and Forecast - by Production Analysis
- 8. Asia Pacific Maize Industry neww Analysis, Insights and Forecast, 2019-2031
- 8.1. Market Analysis, Insights and Forecast - by Production Analysis
- 8.2. Market Analysis, Insights and Forecast - by Consumption Analysis
- 8.3. Market Analysis, Insights and Forecast - by Import Market Analysis (Value & Volume)
- 8.4. Market Analysis, Insights and Forecast - by Export Market Analysis (Value & Volume)
- 8.5. Market Analysis, Insights and Forecast - by Price Trend Analysis
- 8.1. Market Analysis, Insights and Forecast - by Production Analysis
- 9. South America Maize Industry neww Analysis, Insights and Forecast, 2019-2031
- 9.1. Market Analysis, Insights and Forecast - by Production Analysis
- 9.2. Market Analysis, Insights and Forecast - by Consumption Analysis
- 9.3. Market Analysis, Insights and Forecast - by Import Market Analysis (Value & Volume)
- 9.4. Market Analysis, Insights and Forecast - by Export Market Analysis (Value & Volume)
- 9.5. Market Analysis, Insights and Forecast - by Price Trend Analysis
- 9.1. Market Analysis, Insights and Forecast - by Production Analysis
- 10. Africa Maize Industry neww Analysis, Insights and Forecast, 2019-2031
- 10.1. Market Analysis, Insights and Forecast - by Production Analysis
- 10.2. Market Analysis, Insights and Forecast - by Consumption Analysis
- 10.3. Market Analysis, Insights and Forecast - by Import Market Analysis (Value & Volume)
- 10.4. Market Analysis, Insights and Forecast - by Export Market Analysis (Value & Volume)
- 10.5. Market Analysis, Insights and Forecast - by Price Trend Analysis
- 10.1. Market Analysis, Insights and Forecast - by Production Analysis
- 11. South America Maize Industry neww Analysis, Insights and Forecast, 2019-2031
- 11.1. Market Analysis, Insights and Forecast - By Country/Sub-region
- 11.1.1 Brazil
- 11.1.2 Argentina
- 11.1.3 Rest of South America
- 12. North America Maize Industry neww Analysis, Insights and Forecast, 2019-2031
- 12.1. Market Analysis, Insights and Forecast - By Country/Sub-region
- 12.1.1 United States
- 12.1.2 Canada
- 12.1.3 Mexico
- 13. Europe Maize Industry neww Analysis, Insights and Forecast, 2019-2031
- 13.1. Market Analysis, Insights and Forecast - By Country/Sub-region
- 13.1.1 Germany
- 13.1.2 France
- 13.1.3 Italy
- 13.1.4 United Kingdom
- 13.1.5 Netherlands
- 13.1.6 Rest of Europe
- 14. Asia Pacific Maize Industry neww Analysis, Insights and Forecast, 2019-2031
- 14.1. Market Analysis, Insights and Forecast - By Country/Sub-region
- 14.1.1 China
- 14.1.2 Japan
- 14.1.3 India
- 14.1.4 South Korea
- 14.1.5 Taiwan
- 14.1.6 Australia
- 14.1.7 Rest of Asia-Pacific
- 15. MEA Maize Industry neww Analysis, Insights and Forecast, 2019-2031
- 15.1. Market Analysis, Insights and Forecast - By Country/Sub-region
- 15.1.1 Middle East
- 15.1.2 Africa
- 16. Competitive Analysis
- 16.1. Global Market Share Analysis 2024
- 16.2. Company Profiles
- 16.2.1 ADM
- 16.2.1.1. Overview
- 16.2.1.2. Products
- 16.2.1.3. SWOT Analysis
- 16.2.1.4. Recent Developments
- 16.2.1.5. Financials (Based on Availability)
- 16.2.2 Syngenta Crop Protection
- 16.2.2.1. Overview
- 16.2.2.2. Products
- 16.2.2.3. SWOT Analysis
- 16.2.2.4. Recent Developments
- 16.2.2.5. Financials (Based on Availability)
- 16.2.3 Société Générale de Surveillance (SGS)
- 16.2.3.1. Overview
- 16.2.3.2. Products
- 16.2.3.3. SWOT Analysis
- 16.2.3.4. Recent Developments
- 16.2.3.5. Financials (Based on Availability)
- 16.2.4 Bayer Crop Science
- 16.2.4.1. Overview
- 16.2.4.2. Products
- 16.2.4.3. SWOT Analysis
- 16.2.4.4. Recent Developments
- 16.2.4.5. Financials (Based on Availability)
- 16.2.5 Bunge
- 16.2.5.1. Overview
- 16.2.5.2. Products
- 16.2.5.3. SWOT Analysis
- 16.2.5.4. Recent Developments
- 16.2.5.5. Financials (Based on Availability)
- 16.2.6 Bunge Limited
- 16.2.6.1. Overview
- 16.2.6.2. Products
- 16.2.6.3. SWOT Analysis
- 16.2.6.4. Recent Developments
- 16.2.6.5. Financials (Based on Availability)
- 16.2.7 Cargill Incorporated
- 16.2.7.1. Overview
- 16.2.7.2. Products
- 16.2.7.3. SWOT Analysis
- 16.2.7.4. Recent Developments
- 16.2.7.5. Financials (Based on Availability)
- 16.2.8 Corteva Agriscience
- 16.2.8.1. Overview
- 16.2.8.2. Products
- 16.2.8.3. SWOT Analysis
- 16.2.8.4. Recent Developments
- 16.2.8.5. Financials (Based on Availability)
- 16.2.9 ADM
- 16.2.9.1. Overview
- 16.2.9.2. Products
- 16.2.9.3. SWOT Analysis
- 16.2.9.4. Recent Developments
- 16.2.9.5. Financials (Based on Availability)
- 16.2.10 Olam Group
- 16.2.10.1. Overview
- 16.2.10.2. Products
- 16.2.10.3. SWOT Analysis
- 16.2.10.4. Recent Developments
- 16.2.10.5. Financials (Based on Availability)
- 16.2.1 ADM
List of Figures
- Figure 1: Global Maize Industry neww Revenue Breakdown (Million, %) by Region 2024 & 2032
- Figure 2: Global Maize Industry neww Volume Breakdown (Kiloton, %) by Region 2024 & 2032
- Figure 3: South America Maize Industry neww Revenue (Million), by Country 2024 & 2032
- Figure 4: South America Maize Industry neww Volume (Kiloton), by Country 2024 & 2032
- Figure 5: South America Maize Industry neww Revenue Share (%), by Country 2024 & 2032
- Figure 6: South America Maize Industry neww Volume Share (%), by Country 2024 & 2032
- Figure 7: North America Maize Industry neww Revenue (Million), by Country 2024 & 2032
- Figure 8: North America Maize Industry neww Volume (Kiloton), by Country 2024 & 2032
- Figure 9: North America Maize Industry neww Revenue Share (%), by Country 2024 & 2032
- Figure 10: North America Maize Industry neww Volume Share (%), by Country 2024 & 2032
- Figure 11: Europe Maize Industry neww Revenue (Million), by Country 2024 & 2032
- Figure 12: Europe Maize Industry neww Volume (Kiloton), by Country 2024 & 2032
- Figure 13: Europe Maize Industry neww Revenue Share (%), by Country 2024 & 2032
- Figure 14: Europe Maize Industry neww Volume Share (%), by Country 2024 & 2032
- Figure 15: Asia Pacific Maize Industry neww Revenue (Million), by Country 2024 & 2032
- Figure 16: Asia Pacific Maize Industry neww Volume (Kiloton), by Country 2024 & 2032
- Figure 17: Asia Pacific Maize Industry neww Revenue Share (%), by Country 2024 & 2032
- Figure 18: Asia Pacific Maize Industry neww Volume Share (%), by Country 2024 & 2032
- Figure 19: MEA Maize Industry neww Revenue (Million), by Country 2024 & 2032
- Figure 20: MEA Maize Industry neww Volume (Kiloton), by Country 2024 & 2032
- Figure 21: MEA Maize Industry neww Revenue Share (%), by Country 2024 & 2032
- Figure 22: MEA Maize Industry neww Volume Share (%), by Country 2024 & 2032
- Figure 23: North America Maize Industry neww Revenue (Million), by Production Analysis 2024 & 2032
- Figure 24: North America Maize Industry neww Volume (Kiloton), by Production Analysis 2024 & 2032
- Figure 25: North America Maize Industry neww Revenue Share (%), by Production Analysis 2024 & 2032
- Figure 26: North America Maize Industry neww Volume Share (%), by Production Analysis 2024 & 2032
- Figure 27: North America Maize Industry neww Revenue (Million), by Consumption Analysis 2024 & 2032
- Figure 28: North America Maize Industry neww Volume (Kiloton), by Consumption Analysis 2024 & 2032
- Figure 29: North America Maize Industry neww Revenue Share (%), by Consumption Analysis 2024 & 2032
- Figure 30: North America Maize Industry neww Volume Share (%), by Consumption Analysis 2024 & 2032
- Figure 31: North America Maize Industry neww Revenue (Million), by Import Market Analysis (Value & Volume) 2024 & 2032
- Figure 32: North America Maize Industry neww Volume (Kiloton), by Import Market Analysis (Value & Volume) 2024 & 2032
- Figure 33: North America Maize Industry neww Revenue Share (%), by Import Market Analysis (Value & Volume) 2024 & 2032
- Figure 34: North America Maize Industry neww Volume Share (%), by Import Market Analysis (Value & Volume) 2024 & 2032
- Figure 35: North America Maize Industry neww Revenue (Million), by Export Market Analysis (Value & Volume) 2024 & 2032
- Figure 36: North America Maize Industry neww Volume (Kiloton), by Export Market Analysis (Value & Volume) 2024 & 2032
- Figure 37: North America Maize Industry neww Revenue Share (%), by Export Market Analysis (Value & Volume) 2024 & 2032
- Figure 38: North America Maize Industry neww Volume Share (%), by Export Market Analysis (Value & Volume) 2024 & 2032
- Figure 39: North America Maize Industry neww Revenue (Million), by Price Trend Analysis 2024 & 2032
- Figure 40: North America Maize Industry neww Volume (Kiloton), by Price Trend Analysis 2024 & 2032
- Figure 41: North America Maize Industry neww Revenue Share (%), by Price Trend Analysis 2024 & 2032
- Figure 42: North America Maize Industry neww Volume Share (%), by Price Trend Analysis 2024 & 2032
- Figure 43: North America Maize Industry neww Revenue (Million), by Country 2024 & 2032
- Figure 44: North America Maize Industry neww Volume (Kiloton), by Country 2024 & 2032
- Figure 45: North America Maize Industry neww Revenue Share (%), by Country 2024 & 2032
- Figure 46: North America Maize Industry neww Volume Share (%), by Country 2024 & 2032
- Figure 47: Europe Maize Industry neww Revenue (Million), by Production Analysis 2024 & 2032
- Figure 48: Europe Maize Industry neww Volume (Kiloton), by Production Analysis 2024 & 2032
- Figure 49: Europe Maize Industry neww Revenue Share (%), by Production Analysis 2024 & 2032
- Figure 50: Europe Maize Industry neww Volume Share (%), by Production Analysis 2024 & 2032
- Figure 51: Europe Maize Industry neww Revenue (Million), by Consumption Analysis 2024 & 2032
- Figure 52: Europe Maize Industry neww Volume (Kiloton), by Consumption Analysis 2024 & 2032
- Figure 53: Europe Maize Industry neww Revenue Share (%), by Consumption Analysis 2024 & 2032
- Figure 54: Europe Maize Industry neww Volume Share (%), by Consumption Analysis 2024 & 2032
- Figure 55: Europe Maize Industry neww Revenue (Million), by Import Market Analysis (Value & Volume) 2024 & 2032
- Figure 56: Europe Maize Industry neww Volume (Kiloton), by Import Market Analysis (Value & Volume) 2024 & 2032
- Figure 57: Europe Maize Industry neww Revenue Share (%), by Import Market Analysis (Value & Volume) 2024 & 2032
- Figure 58: Europe Maize Industry neww Volume Share (%), by Import Market Analysis (Value & Volume) 2024 & 2032
- Figure 59: Europe Maize Industry neww Revenue (Million), by Export Market Analysis (Value & Volume) 2024 & 2032
- Figure 60: Europe Maize Industry neww Volume (Kiloton), by Export Market Analysis (Value & Volume) 2024 & 2032
- Figure 61: Europe Maize Industry neww Revenue Share (%), by Export Market Analysis (Value & Volume) 2024 & 2032
- Figure 62: Europe Maize Industry neww Volume Share (%), by Export Market Analysis (Value & Volume) 2024 & 2032
- Figure 63: Europe Maize Industry neww Revenue (Million), by Price Trend Analysis 2024 & 2032
- Figure 64: Europe Maize Industry neww Volume (Kiloton), by Price Trend Analysis 2024 & 2032
- Figure 65: Europe Maize Industry neww Revenue Share (%), by Price Trend Analysis 2024 & 2032
- Figure 66: Europe Maize Industry neww Volume Share (%), by Price Trend Analysis 2024 & 2032
- Figure 67: Europe Maize Industry neww Revenue (Million), by Country 2024 & 2032
- Figure 68: Europe Maize Industry neww Volume (Kiloton), by Country 2024 & 2032
- Figure 69: Europe Maize Industry neww Revenue Share (%), by Country 2024 & 2032
- Figure 70: Europe Maize Industry neww Volume Share (%), by Country 2024 & 2032
- Figure 71: Asia Pacific Maize Industry neww Revenue (Million), by Production Analysis 2024 & 2032
- Figure 72: Asia Pacific Maize Industry neww Volume (Kiloton), by Production Analysis 2024 & 2032
- Figure 73: Asia Pacific Maize Industry neww Revenue Share (%), by Production Analysis 2024 & 2032
- Figure 74: Asia Pacific Maize Industry neww Volume Share (%), by Production Analysis 2024 & 2032
- Figure 75: Asia Pacific Maize Industry neww Revenue (Million), by Consumption Analysis 2024 & 2032
- Figure 76: Asia Pacific Maize Industry neww Volume (Kiloton), by Consumption Analysis 2024 & 2032
- Figure 77: Asia Pacific Maize Industry neww Revenue Share (%), by Consumption Analysis 2024 & 2032
- Figure 78: Asia Pacific Maize Industry neww Volume Share (%), by Consumption Analysis 2024 & 2032
- Figure 79: Asia Pacific Maize Industry neww Revenue (Million), by Import Market Analysis (Value & Volume) 2024 & 2032
- Figure 80: Asia Pacific Maize Industry neww Volume (Kiloton), by Import Market Analysis (Value & Volume) 2024 & 2032
- Figure 81: Asia Pacific Maize Industry neww Revenue Share (%), by Import Market Analysis (Value & Volume) 2024 & 2032
- Figure 82: Asia Pacific Maize Industry neww Volume Share (%), by Import Market Analysis (Value & Volume) 2024 & 2032
- Figure 83: Asia Pacific Maize Industry neww Revenue (Million), by Export Market Analysis (Value & Volume) 2024 & 2032
- Figure 84: Asia Pacific Maize Industry neww Volume (Kiloton), by Export Market Analysis (Value & Volume) 2024 & 2032
- Figure 85: Asia Pacific Maize Industry neww Revenue Share (%), by Export Market Analysis (Value & Volume) 2024 & 2032
- Figure 86: Asia Pacific Maize Industry neww Volume Share (%), by Export Market Analysis (Value & Volume) 2024 & 2032
- Figure 87: Asia Pacific Maize Industry neww Revenue (Million), by Price Trend Analysis 2024 & 2032
- Figure 88: Asia Pacific Maize Industry neww Volume (Kiloton), by Price Trend Analysis 2024 & 2032
- Figure 89: Asia Pacific Maize Industry neww Revenue Share (%), by Price Trend Analysis 2024 & 2032
- Figure 90: Asia Pacific Maize Industry neww Volume Share (%), by Price Trend Analysis 2024 & 2032
- Figure 91: Asia Pacific Maize Industry neww Revenue (Million), by Country 2024 & 2032
- Figure 92: Asia Pacific Maize Industry neww Volume (Kiloton), by Country 2024 & 2032
- Figure 93: Asia Pacific Maize Industry neww Revenue Share (%), by Country 2024 & 2032
- Figure 94: Asia Pacific Maize Industry neww Volume Share (%), by Country 2024 & 2032
- Figure 95: South America Maize Industry neww Revenue (Million), by Production Analysis 2024 & 2032
- Figure 96: South America Maize Industry neww Volume (Kiloton), by Production Analysis 2024 & 2032
- Figure 97: South America Maize Industry neww Revenue Share (%), by Production Analysis 2024 & 2032
- Figure 98: South America Maize Industry neww Volume Share (%), by Production Analysis 2024 & 2032
- Figure 99: South America Maize Industry neww Revenue (Million), by Consumption Analysis 2024 & 2032
- Figure 100: South America Maize Industry neww Volume (Kiloton), by Consumption Analysis 2024 & 2032
- Figure 101: South America Maize Industry neww Revenue Share (%), by Consumption Analysis 2024 & 2032
- Figure 102: South America Maize Industry neww Volume Share (%), by Consumption Analysis 2024 & 2032
- Figure 103: South America Maize Industry neww Revenue (Million), by Import Market Analysis (Value & Volume) 2024 & 2032
- Figure 104: South America Maize Industry neww Volume (Kiloton), by Import Market Analysis (Value & Volume) 2024 & 2032
- Figure 105: South America Maize Industry neww Revenue Share (%), by Import Market Analysis (Value & Volume) 2024 & 2032
- Figure 106: South America Maize Industry neww Volume Share (%), by Import Market Analysis (Value & Volume) 2024 & 2032
- Figure 107: South America Maize Industry neww Revenue (Million), by Export Market Analysis (Value & Volume) 2024 & 2032
- Figure 108: South America Maize Industry neww Volume (Kiloton), by Export Market Analysis (Value & Volume) 2024 & 2032
- Figure 109: South America Maize Industry neww Revenue Share (%), by Export Market Analysis (Value & Volume) 2024 & 2032
- Figure 110: South America Maize Industry neww Volume Share (%), by Export Market Analysis (Value & Volume) 2024 & 2032
- Figure 111: South America Maize Industry neww Revenue (Million), by Price Trend Analysis 2024 & 2032
- Figure 112: South America Maize Industry neww Volume (Kiloton), by Price Trend Analysis 2024 & 2032
- Figure 113: South America Maize Industry neww Revenue Share (%), by Price Trend Analysis 2024 & 2032
- Figure 114: South America Maize Industry neww Volume Share (%), by Price Trend Analysis 2024 & 2032
- Figure 115: South America Maize Industry neww Revenue (Million), by Country 2024 & 2032
- Figure 116: South America Maize Industry neww Volume (Kiloton), by Country 2024 & 2032
- Figure 117: South America Maize Industry neww Revenue Share (%), by Country 2024 & 2032
- Figure 118: South America Maize Industry neww Volume Share (%), by Country 2024 & 2032
- Figure 119: Africa Maize Industry neww Revenue (Million), by Production Analysis 2024 & 2032
- Figure 120: Africa Maize Industry neww Volume (Kiloton), by Production Analysis 2024 & 2032
- Figure 121: Africa Maize Industry neww Revenue Share (%), by Production Analysis 2024 & 2032
- Figure 122: Africa Maize Industry neww Volume Share (%), by Production Analysis 2024 & 2032
- Figure 123: Africa Maize Industry neww Revenue (Million), by Consumption Analysis 2024 & 2032
- Figure 124: Africa Maize Industry neww Volume (Kiloton), by Consumption Analysis 2024 & 2032
- Figure 125: Africa Maize Industry neww Revenue Share (%), by Consumption Analysis 2024 & 2032
- Figure 126: Africa Maize Industry neww Volume Share (%), by Consumption Analysis 2024 & 2032
- Figure 127: Africa Maize Industry neww Revenue (Million), by Import Market Analysis (Value & Volume) 2024 & 2032
- Figure 128: Africa Maize Industry neww Volume (Kiloton), by Import Market Analysis (Value & Volume) 2024 & 2032
- Figure 129: Africa Maize Industry neww Revenue Share (%), by Import Market Analysis (Value & Volume) 2024 & 2032
- Figure 130: Africa Maize Industry neww Volume Share (%), by Import Market Analysis (Value & Volume) 2024 & 2032
- Figure 131: Africa Maize Industry neww Revenue (Million), by Export Market Analysis (Value & Volume) 2024 & 2032
- Figure 132: Africa Maize Industry neww Volume (Kiloton), by Export Market Analysis (Value & Volume) 2024 & 2032
- Figure 133: Africa Maize Industry neww Revenue Share (%), by Export Market Analysis (Value & Volume) 2024 & 2032
- Figure 134: Africa Maize Industry neww Volume Share (%), by Export Market Analysis (Value & Volume) 2024 & 2032
- Figure 135: Africa Maize Industry neww Revenue (Million), by Price Trend Analysis 2024 & 2032
- Figure 136: Africa Maize Industry neww Volume (Kiloton), by Price Trend Analysis 2024 & 2032
- Figure 137: Africa Maize Industry neww Revenue Share (%), by Price Trend Analysis 2024 & 2032
- Figure 138: Africa Maize Industry neww Volume Share (%), by Price Trend Analysis 2024 & 2032
- Figure 139: Africa Maize Industry neww Revenue (Million), by Country 2024 & 2032
- Figure 140: Africa Maize Industry neww Volume (Kiloton), by Country 2024 & 2032
- Figure 141: Africa Maize Industry neww Revenue Share (%), by Country 2024 & 2032
- Figure 142: Africa Maize Industry neww Volume Share (%), by Country 2024 & 2032
List of Tables
- Table 1: Global Maize Industry neww Revenue Million Forecast, by Region 2019 & 2032
- Table 2: Global Maize Industry neww Volume Kiloton Forecast, by Region 2019 & 2032
- Table 3: Global Maize Industry neww Revenue Million Forecast, by Production Analysis 2019 & 2032
- Table 4: Global Maize Industry neww Volume Kiloton Forecast, by Production Analysis 2019 & 2032
- Table 5: Global Maize Industry neww Revenue Million Forecast, by Consumption Analysis 2019 & 2032
- Table 6: Global Maize Industry neww Volume Kiloton Forecast, by Consumption Analysis 2019 & 2032
- Table 7: Global Maize Industry neww Revenue Million Forecast, by Import Market Analysis (Value & Volume) 2019 & 2032
- Table 8: Global Maize Industry neww Volume Kiloton Forecast, by Import Market Analysis (Value & Volume) 2019 & 2032
- Table 9: Global Maize Industry neww Revenue Million Forecast, by Export Market Analysis (Value & Volume) 2019 & 2032
- Table 10: Global Maize Industry neww Volume Kiloton Forecast, by Export Market Analysis (Value & Volume) 2019 & 2032
- Table 11: Global Maize Industry neww Revenue Million Forecast, by Price Trend Analysis 2019 & 2032
- Table 12: Global Maize Industry neww Volume Kiloton Forecast, by Price Trend Analysis 2019 & 2032
- Table 13: Global Maize Industry neww Revenue Million Forecast, by Region 2019 & 2032
- Table 14: Global Maize Industry neww Volume Kiloton Forecast, by Region 2019 & 2032
- Table 15: Global Maize Industry neww Revenue Million Forecast, by Country 2019 & 2032
- Table 16: Global Maize Industry neww Volume Kiloton Forecast, by Country 2019 & 2032
- Table 17: Brazil Maize Industry neww Revenue (Million) Forecast, by Application 2019 & 2032
- Table 18: Brazil Maize Industry neww Volume (Kiloton) Forecast, by Application 2019 & 2032
- Table 19: Argentina Maize Industry neww Revenue (Million) Forecast, by Application 2019 & 2032
- Table 20: Argentina Maize Industry neww Volume (Kiloton) Forecast, by Application 2019 & 2032
- Table 21: Rest of South America Maize Industry neww Revenue (Million) Forecast, by Application 2019 & 2032
- Table 22: Rest of South America Maize Industry neww Volume (Kiloton) Forecast, by Application 2019 & 2032
- Table 23: Global Maize Industry neww Revenue Million Forecast, by Country 2019 & 2032
- Table 24: Global Maize Industry neww Volume Kiloton Forecast, by Country 2019 & 2032
- Table 25: United States Maize Industry neww Revenue (Million) Forecast, by Application 2019 & 2032
- Table 26: United States Maize Industry neww Volume (Kiloton) Forecast, by Application 2019 & 2032
- Table 27: Canada Maize Industry neww Revenue (Million) Forecast, by Application 2019 & 2032
- Table 28: Canada Maize Industry neww Volume (Kiloton) Forecast, by Application 2019 & 2032
- Table 29: Mexico Maize Industry neww Revenue (Million) Forecast, by Application 2019 & 2032
- Table 30: Mexico Maize Industry neww Volume (Kiloton) Forecast, by Application 2019 & 2032
- Table 31: Global Maize Industry neww Revenue Million Forecast, by Country 2019 & 2032
- Table 32: Global Maize Industry neww Volume Kiloton Forecast, by Country 2019 & 2032
- Table 33: Germany Maize Industry neww Revenue (Million) Forecast, by Application 2019 & 2032
- Table 34: Germany Maize Industry neww Volume (Kiloton) Forecast, by Application 2019 & 2032
- Table 35: France Maize Industry neww Revenue (Million) Forecast, by Application 2019 & 2032
- Table 36: France Maize Industry neww Volume (Kiloton) Forecast, by Application 2019 & 2032
- Table 37: Italy Maize Industry neww Revenue (Million) Forecast, by Application 2019 & 2032
- Table 38: Italy Maize Industry neww Volume (Kiloton) Forecast, by Application 2019 & 2032
- Table 39: United Kingdom Maize Industry neww Revenue (Million) Forecast, by Application 2019 & 2032
- Table 40: United Kingdom Maize Industry neww Volume (Kiloton) Forecast, by Application 2019 & 2032
- Table 41: Netherlands Maize Industry neww Revenue (Million) Forecast, by Application 2019 & 2032
- Table 42: Netherlands Maize Industry neww Volume (Kiloton) Forecast, by Application 2019 & 2032
- Table 43: Rest of Europe Maize Industry neww Revenue (Million) Forecast, by Application 2019 & 2032
- Table 44: Rest of Europe Maize Industry neww Volume (Kiloton) Forecast, by Application 2019 & 2032
- Table 45: Global Maize Industry neww Revenue Million Forecast, by Country 2019 & 2032
- Table 46: Global Maize Industry neww Volume Kiloton Forecast, by Country 2019 & 2032
- Table 47: China Maize Industry neww Revenue (Million) Forecast, by Application 2019 & 2032
- Table 48: China Maize Industry neww Volume (Kiloton) Forecast, by Application 2019 & 2032
- Table 49: Japan Maize Industry neww Revenue (Million) Forecast, by Application 2019 & 2032
- Table 50: Japan Maize Industry neww Volume (Kiloton) Forecast, by Application 2019 & 2032
- Table 51: India Maize Industry neww Revenue (Million) Forecast, by Application 2019 & 2032
- Table 52: India Maize Industry neww Volume (Kiloton) Forecast, by Application 2019 & 2032
- Table 53: South Korea Maize Industry neww Revenue (Million) Forecast, by Application 2019 & 2032
- Table 54: South Korea Maize Industry neww Volume (Kiloton) Forecast, by Application 2019 & 2032
- Table 55: Taiwan Maize Industry neww Revenue (Million) Forecast, by Application 2019 & 2032
- Table 56: Taiwan Maize Industry neww Volume (Kiloton) Forecast, by Application 2019 & 2032
- Table 57: Australia Maize Industry neww Revenue (Million) Forecast, by Application 2019 & 2032
- Table 58: Australia Maize Industry neww Volume (Kiloton) Forecast, by Application 2019 & 2032
- Table 59: Rest of Asia-Pacific Maize Industry neww Revenue (Million) Forecast, by Application 2019 & 2032
- Table 60: Rest of Asia-Pacific Maize Industry neww Volume (Kiloton) Forecast, by Application 2019 & 2032
- Table 61: Global Maize Industry neww Revenue Million Forecast, by Country 2019 & 2032
- Table 62: Global Maize Industry neww Volume Kiloton Forecast, by Country 2019 & 2032
- Table 63: Middle East Maize Industry neww Revenue (Million) Forecast, by Application 2019 & 2032
- Table 64: Middle East Maize Industry neww Volume (Kiloton) Forecast, by Application 2019 & 2032
- Table 65: Africa Maize Industry neww Revenue (Million) Forecast, by Application 2019 & 2032
- Table 66: Africa Maize Industry neww Volume (Kiloton) Forecast, by Application 2019 & 2032
- Table 67: Global Maize Industry neww Revenue Million Forecast, by Production Analysis 2019 & 2032
- Table 68: Global Maize Industry neww Volume Kiloton Forecast, by Production Analysis 2019 & 2032
- Table 69: Global Maize Industry neww Revenue Million Forecast, by Consumption Analysis 2019 & 2032
- Table 70: Global Maize Industry neww Volume Kiloton Forecast, by Consumption Analysis 2019 & 2032
- Table 71: Global Maize Industry neww Revenue Million Forecast, by Import Market Analysis (Value & Volume) 2019 & 2032
- Table 72: Global Maize Industry neww Volume Kiloton Forecast, by Import Market Analysis (Value & Volume) 2019 & 2032
- Table 73: Global Maize Industry neww Revenue Million Forecast, by Export Market Analysis (Value & Volume) 2019 & 2032
- Table 74: Global Maize Industry neww Volume Kiloton Forecast, by Export Market Analysis (Value & Volume) 2019 & 2032
- Table 75: Global Maize Industry neww Revenue Million Forecast, by Price Trend Analysis 2019 & 2032
- Table 76: Global Maize Industry neww Volume Kiloton Forecast, by Price Trend Analysis 2019 & 2032
- Table 77: Global Maize Industry neww Revenue Million Forecast, by Country 2019 & 2032
- Table 78: Global Maize Industry neww Volume Kiloton Forecast, by Country 2019 & 2032
- Table 79: United States Maize Industry neww Revenue (Million) Forecast, by Application 2019 & 2032
- Table 80: United States Maize Industry neww Volume (Kiloton) Forecast, by Application 2019 & 2032
- Table 81: Canada Maize Industry neww Revenue (Million) Forecast, by Application 2019 & 2032
- Table 82: Canada Maize Industry neww Volume (Kiloton) Forecast, by Application 2019 & 2032
- Table 83: Mexico Maize Industry neww Revenue (Million) Forecast, by Application 2019 & 2032
- Table 84: Mexico Maize Industry neww Volume (Kiloton) Forecast, by Application 2019 & 2032
- Table 85: Global Maize Industry neww Revenue Million Forecast, by Production Analysis 2019 & 2032
- Table 86: Global Maize Industry neww Volume Kiloton Forecast, by Production Analysis 2019 & 2032
- Table 87: Global Maize Industry neww Revenue Million Forecast, by Consumption Analysis 2019 & 2032
- Table 88: Global Maize Industry neww Volume Kiloton Forecast, by Consumption Analysis 2019 & 2032
- Table 89: Global Maize Industry neww Revenue Million Forecast, by Import Market Analysis (Value & Volume) 2019 & 2032
- Table 90: Global Maize Industry neww Volume Kiloton Forecast, by Import Market Analysis (Value & Volume) 2019 & 2032
- Table 91: Global Maize Industry neww Revenue Million Forecast, by Export Market Analysis (Value & Volume) 2019 & 2032
- Table 92: Global Maize Industry neww Volume Kiloton Forecast, by Export Market Analysis (Value & Volume) 2019 & 2032
- Table 93: Global Maize Industry neww Revenue Million Forecast, by Price Trend Analysis 2019 & 2032
- Table 94: Global Maize Industry neww Volume Kiloton Forecast, by Price Trend Analysis 2019 & 2032
- Table 95: Global Maize Industry neww Revenue Million Forecast, by Country 2019 & 2032
- Table 96: Global Maize Industry neww Volume Kiloton Forecast, by Country 2019 & 2032
- Table 97: Spain Maize Industry neww Revenue (Million) Forecast, by Application 2019 & 2032
- Table 98: Spain Maize Industry neww Volume (Kiloton) Forecast, by Application 2019 & 2032
- Table 99: Italy Maize Industry neww Revenue (Million) Forecast, by Application 2019 & 2032
- Table 100: Italy Maize Industry neww Volume (Kiloton) Forecast, by Application 2019 & 2032
- Table 101: France Maize Industry neww Revenue (Million) Forecast, by Application 2019 & 2032
- Table 102: France Maize Industry neww Volume (Kiloton) Forecast, by Application 2019 & 2032
- Table 103: Germany Maize Industry neww Revenue (Million) Forecast, by Application 2019 & 2032
- Table 104: Germany Maize Industry neww Volume (Kiloton) Forecast, by Application 2019 & 2032
- Table 105: Russia Maize Industry neww Revenue (Million) Forecast, by Application 2019 & 2032
- Table 106: Russia Maize Industry neww Volume (Kiloton) Forecast, by Application 2019 & 2032
- Table 107: Global Maize Industry neww Revenue Million Forecast, by Production Analysis 2019 & 2032
- Table 108: Global Maize Industry neww Volume Kiloton Forecast, by Production Analysis 2019 & 2032
- Table 109: Global Maize Industry neww Revenue Million Forecast, by Consumption Analysis 2019 & 2032
- Table 110: Global Maize Industry neww Volume Kiloton Forecast, by Consumption Analysis 2019 & 2032
- Table 111: Global Maize Industry neww Revenue Million Forecast, by Import Market Analysis (Value & Volume) 2019 & 2032
- Table 112: Global Maize Industry neww Volume Kiloton Forecast, by Import Market Analysis (Value & Volume) 2019 & 2032
- Table 113: Global Maize Industry neww Revenue Million Forecast, by Export Market Analysis (Value & Volume) 2019 & 2032
- Table 114: Global Maize Industry neww Volume Kiloton Forecast, by Export Market Analysis (Value & Volume) 2019 & 2032
- Table 115: Global Maize Industry neww Revenue Million Forecast, by Price Trend Analysis 2019 & 2032
- Table 116: Global Maize Industry neww Volume Kiloton Forecast, by Price Trend Analysis 2019 & 2032
- Table 117: Global Maize Industry neww Revenue Million Forecast, by Country 2019 & 2032
- Table 118: Global Maize Industry neww Volume Kiloton Forecast, by Country 2019 & 2032
- Table 119: India Maize Industry neww Revenue (Million) Forecast, by Application 2019 & 2032
- Table 120: India Maize Industry neww Volume (Kiloton) Forecast, by Application 2019 & 2032
- Table 121: China Maize Industry neww Revenue (Million) Forecast, by Application 2019 & 2032
- Table 122: China Maize Industry neww Volume (Kiloton) Forecast, by Application 2019 & 2032
- Table 123: Vietnam Maize Industry neww Revenue (Million) Forecast, by Application 2019 & 2032
- Table 124: Vietnam Maize Industry neww Volume (Kiloton) Forecast, by Application 2019 & 2032
- Table 125: Global Maize Industry neww Revenue Million Forecast, by Production Analysis 2019 & 2032
- Table 126: Global Maize Industry neww Volume Kiloton Forecast, by Production Analysis 2019 & 2032
- Table 127: Global Maize Industry neww Revenue Million Forecast, by Consumption Analysis 2019 & 2032
- Table 128: Global Maize Industry neww Volume Kiloton Forecast, by Consumption Analysis 2019 & 2032
- Table 129: Global Maize Industry neww Revenue Million Forecast, by Import Market Analysis (Value & Volume) 2019 & 2032
- Table 130: Global Maize Industry neww Volume Kiloton Forecast, by Import Market Analysis (Value & Volume) 2019 & 2032
- Table 131: Global Maize Industry neww Revenue Million Forecast, by Export Market Analysis (Value & Volume) 2019 & 2032
- Table 132: Global Maize Industry neww Volume Kiloton Forecast, by Export Market Analysis (Value & Volume) 2019 & 2032
- Table 133: Global Maize Industry neww Revenue Million Forecast, by Price Trend Analysis 2019 & 2032
- Table 134: Global Maize Industry neww Volume Kiloton Forecast, by Price Trend Analysis 2019 & 2032
- Table 135: Global Maize Industry neww Revenue Million Forecast, by Country 2019 & 2032
- Table 136: Global Maize Industry neww Volume Kiloton Forecast, by Country 2019 & 2032
- Table 137: Brazil Maize Industry neww Revenue (Million) Forecast, by Application 2019 & 2032
- Table 138: Brazil Maize Industry neww Volume (Kiloton) Forecast, by Application 2019 & 2032
- Table 139: Argentina Maize Industry neww Revenue (Million) Forecast, by Application 2019 & 2032
- Table 140: Argentina Maize Industry neww Volume (Kiloton) Forecast, by Application 2019 & 2032
- Table 141: Global Maize Industry neww Revenue Million Forecast, by Production Analysis 2019 & 2032
- Table 142: Global Maize Industry neww Volume Kiloton Forecast, by Production Analysis 2019 & 2032
- Table 143: Global Maize Industry neww Revenue Million Forecast, by Consumption Analysis 2019 & 2032
- Table 144: Global Maize Industry neww Volume Kiloton Forecast, by Consumption Analysis 2019 & 2032
- Table 145: Global Maize Industry neww Revenue Million Forecast, by Import Market Analysis (Value & Volume) 2019 & 2032
- Table 146: Global Maize Industry neww Volume Kiloton Forecast, by Import Market Analysis (Value & Volume) 2019 & 2032
- Table 147: Global Maize Industry neww Revenue Million Forecast, by Export Market Analysis (Value & Volume) 2019 & 2032
- Table 148: Global Maize Industry neww Volume Kiloton Forecast, by Export Market Analysis (Value & Volume) 2019 & 2032
- Table 149: Global Maize Industry neww Revenue Million Forecast, by Price Trend Analysis 2019 & 2032
- Table 150: Global Maize Industry neww Volume Kiloton Forecast, by Price Trend Analysis 2019 & 2032
- Table 151: Global Maize Industry neww Revenue Million Forecast, by Country 2019 & 2032
- Table 152: Global Maize Industry neww Volume Kiloton Forecast, by Country 2019 & 2032
- Table 153: South Africa Maize Industry neww Revenue (Million) Forecast, by Application 2019 & 2032
- Table 154: South Africa Maize Industry neww Volume (Kiloton) Forecast, by Application 2019 & 2032
- Table 155: Nigeria Maize Industry neww Revenue (Million) Forecast, by Application 2019 & 2032
- Table 156: Nigeria Maize Industry neww Volume (Kiloton) Forecast, by Application 2019 & 2032
Frequently Asked Questions
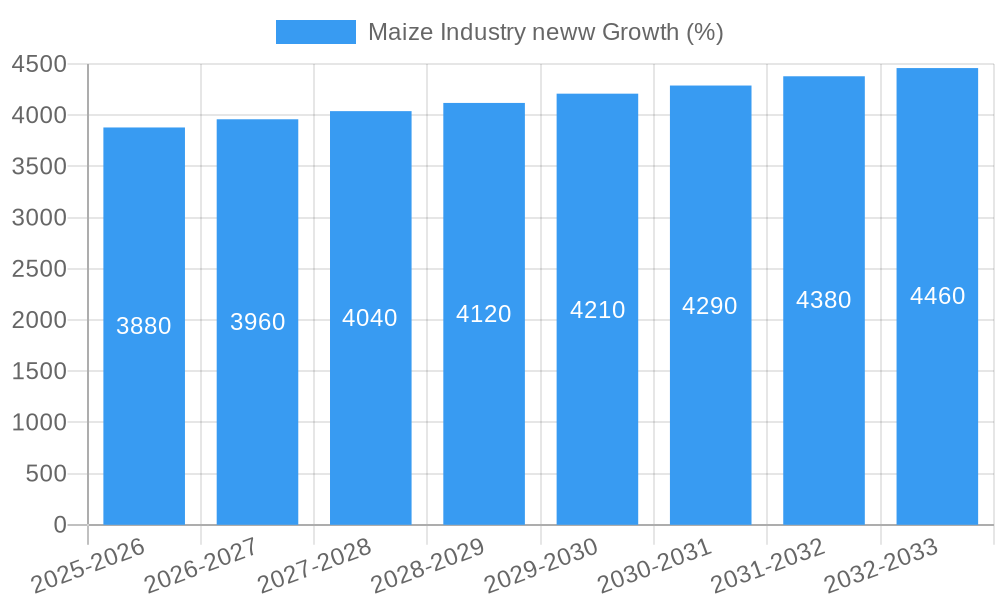
1. What is the projected Compound Annual Growth Rate (CAGR) of the Maize Industry neww?
The projected CAGR is approximately 3.01%.
2. Which companies are prominent players in the Maize Industry neww?
Key companies in the market include ADM, Syngenta Crop Protection , Société Générale de Surveillance (SGS) , Bayer Crop Science , Bunge , Bunge Limited , Cargill, Incorporated , Corteva Agriscience , ADM , Olam Group .
3. What are the main segments of the Maize Industry neww?
The market segments include Production Analysis, Consumption Analysis, Import Market Analysis (Value & Volume), Export Market Analysis (Value & Volume), Price Trend Analysis.
4. Can you provide details about the market size?
The market size is estimated to be USD 143.62 Million as of 2022.
5. What are some drivers contributing to market growth?
N/A
6. What are the notable trends driving market growth?
Increase in Demand for Animal-based Protein Sources.
7. Are there any restraints impacting market growth?
N/A
8. Can you provide examples of recent developments in the market?
October 2022: Ghana's President, Nana Addo Dankwa Akufo-Addo, inaugurated an ultramodern maize processing factory at Nsuta-Kwagye in the Sekyere-Central District of the Ashanti Region, as part of the "One District, One Factory" initiative. The facility is equipped with cutting-edge processing equipment, such as a maize drying plant, a grit milling machine, and many more.
9. What pricing options are available for accessing the report?
Pricing options include single-user, multi-user, and enterprise licenses priced at USD 4750, USD 5250, and USD 8750 respectively.
10. Is the market size provided in terms of value or volume?
The market size is provided in terms of value, measured in Million and volume, measured in Kiloton.
11. Are there any specific market keywords associated with the report?
Yes, the market keyword associated with the report is "Maize Industry neww," which aids in identifying and referencing the specific market segment covered.
12. How do I determine which pricing option suits my needs best?
The pricing options vary based on user requirements and access needs. Individual users may opt for single-user licenses, while businesses requiring broader access may choose multi-user or enterprise licenses for cost-effective access to the report.
13. Are there any additional resources or data provided in the Maize Industry neww report?
While the report offers comprehensive insights, it's advisable to review the specific contents or supplementary materials provided to ascertain if additional resources or data are available.
14. How can I stay updated on further developments or reports in the Maize Industry neww?
To stay informed about further developments, trends, and reports in the Maize Industry neww, consider subscribing to industry newsletters, following relevant companies and organizations, or regularly checking reputable industry news sources and publications.
Methodology
Step 1 - Identification of Relevant Samples Size from Population Database


Step 2 - Approaches for Defining Global Market Size (Value, Volume* & Price*)

Note*: In applicable scenarios
Step 3 - Data Sources
Primary Research
- Web Analytics
- Survey Reports
- Research Institute
- Latest Research Reports
- Opinion Leaders
Secondary Research
- Annual Reports
- White Paper
- Latest Press Release
- Industry Association
- Paid Database
- Investor Presentations

Step 4 - Data Triangulation
Involves using different sources of information in order to increase the validity of a study
These sources are likely to be stakeholders in a program - participants, other researchers, program staff, other community members, and so on.
Then we put all data in single framework & apply various statistical tools to find out the dynamic on the market.
During the analysis stage, feedback from the stakeholder groups would be compared to determine areas of agreement as well as areas of divergence


