
Key Insights
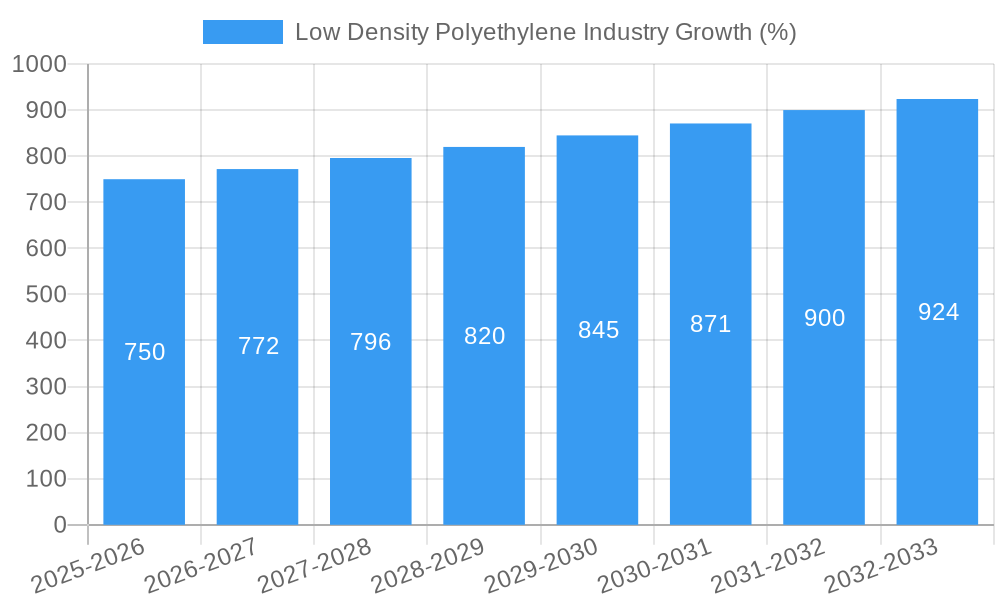
The low-density polyethylene (LDPE) market is experiencing steady growth, driven by its versatile applications across diverse sectors. With a Compound Annual Growth Rate (CAGR) exceeding 3.00% and a 2025 market size (estimated based on available data and market trends) of approximately $25 billion, the industry presents significant opportunities for established players and new entrants alike. Key drivers include the expanding packaging industry, particularly in food and consumer goods, the rising demand for flexible films, and the increasing use of LDPE in various applications such as agricultural films and coatings. Furthermore, technological advancements leading to improved LDPE properties, such as enhanced tensile strength and barrier properties, are fueling market expansion. However, fluctuating raw material prices, particularly ethylene costs, pose a significant challenge, along with environmental concerns regarding plastic waste management and the push towards sustainable alternatives. Market segmentation reveals strong performance across various regions, with North America and Asia-Pacific likely representing the largest market shares, reflecting high consumption in these regions. Major players like Chevron Phillips Chemical, Dow, ExxonMobil, and others are strategically investing in capacity expansions and technological improvements to maintain their market positions and capitalize on future growth prospects.
The competitive landscape is characterized by a mix of large multinational corporations and regional players. The forecast period (2025-2033) anticipates continued market growth, driven by factors mentioned above. However, sustainable packaging solutions and recycling initiatives are gaining traction, potentially influencing market dynamics in the longer term. Companies are focusing on innovation to address these concerns, developing biodegradable and recyclable LDPE alternatives. Successful players will need to balance cost efficiency with environmental sustainability, incorporating circular economy principles into their operations and product lifecycle management. This focus on sustainability, combined with continued growth in key application areas, ensures a dynamic and promising future for the LDPE market.
This in-depth report provides a comprehensive analysis of the Low Density Polyethylene (LDPE) industry, offering valuable insights for businesses, investors, and stakeholders seeking to understand market dynamics, competitive landscapes, and future growth opportunities. The report covers the period 2019-2033, with a base year of 2025 and a forecast period of 2025-2033. Key aspects of the LDPE market are meticulously examined, including industry structure, competitive dynamics, technological advancements, and major market players. The report also features detailed segmentations and growth projections, providing a clear roadmap for strategic decision-making.
Low Density Polyethylene Industry Market Structure & Competitive Dynamics
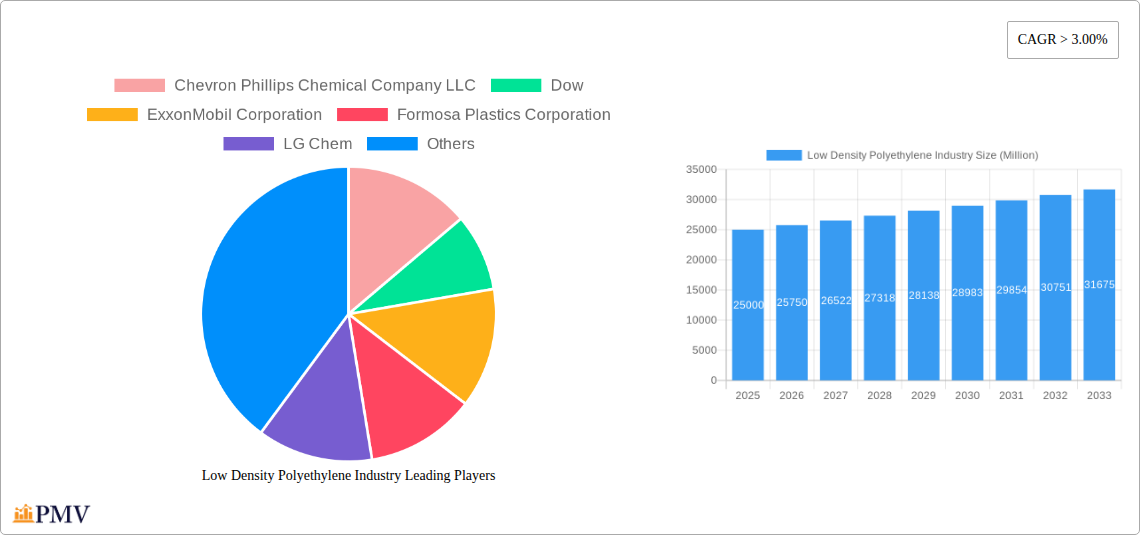
The LDPE industry is characterized by a moderately concentrated market structure, with a handful of major players controlling a significant portion of global production. Key companies include Chevron Phillips Chemical Company LLC, Dow, ExxonMobil Corporation, Formosa Plastics Corporation, LG Chem, LyondellBasell Industries Holdings BV, NOVA Chemicals Corporate, PetroChina, Reliance Industries Limited, and Westlake Corporation. However, the market also features several smaller players, contributing to a dynamic competitive landscape.
Innovation ecosystems are crucial for driving growth, with companies continually investing in research and development to enhance product properties, improve manufacturing processes, and develop new applications. Regulatory frameworks, including environmental regulations and safety standards, significantly influence industry practices. The presence of substitute materials, such as other types of polyethylene and alternative packaging materials, necessitates continuous innovation and competitive pricing strategies. End-user trends, particularly in the packaging and film industries, shape product demand.
Mergers and acquisitions (M&A) activity is a notable feature of the LDPE industry. Recent transactions have involved significant investments, reflecting the industry's consolidation and growth potential. For example, the xx Million deal between [Company A] and [Company B] in [Year] demonstrated a focus on expanding production capacity and market reach. The total value of M&A deals in the LDPE sector between 2019 and 2024 was approximately xx Million, indicating significant industry consolidation. Market share data reveals that the top five players collectively account for approximately xx% of the global LDPE market.
Low Density Polyethylene Industry Industry Trends & Insights
The LDPE industry is experiencing steady growth, driven by robust demand from various end-use sectors, particularly packaging, films, and consumer goods. The compound annual growth rate (CAGR) for the LDPE market during the forecast period (2025-2033) is estimated at xx%, indicating a healthy growth trajectory. Technological advancements, such as the development of advanced polymerization processes and improved product formulations, are contributing to enhanced product performance and efficiency. Consumer preferences for lightweight, flexible, and recyclable packaging are also driving demand for LDPE. However, the industry faces challenges related to fluctuating raw material prices, environmental concerns surrounding plastic waste, and intense competition. Market penetration of LDPE in emerging economies continues to rise due to factors such as increasing disposable income and expanding industrial activities, indicating ample growth opportunities. The global market size for LDPE in 2025 is estimated at xx Million, projected to reach xx Million by 2033.
Dominant Markets & Segments in Low Density Polyethylene Industry
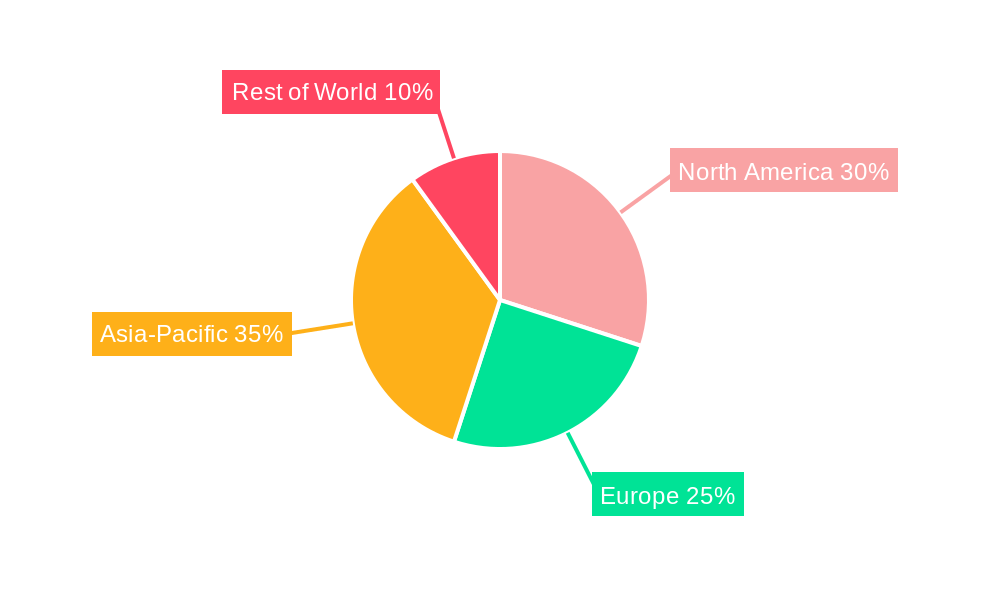
The Asia-Pacific region dominates the global LDPE market, driven by rapid economic growth, increasing industrialization, and rising consumption in countries like China and India.
- Key Drivers in Asia-Pacific:
- Rapid economic growth and industrialization.
- High population density and expanding consumer base.
- Favorable government policies supporting infrastructure development.
- Significant investments in manufacturing facilities.
The dominance of Asia-Pacific can be attributed to several factors, including robust economic growth, a burgeoning population, and increasing demand from various end-use sectors. This region is expected to continue its market leadership over the forecast period, fueled by ongoing industrialization and urbanization. Other regions, such as North America and Europe, also contribute significantly to the LDPE market, albeit at a slower growth rate compared to Asia-Pacific.
Low Density Polyethylene Industry Product Innovations
Recent product innovations in the LDPE industry have focused on enhancing material properties, such as improved strength, flexibility, and barrier properties. Technological trends include the development of bio-based LDPE and the incorporation of recycled content to meet growing sustainability demands. These innovations are improving the market fit of LDPE in various applications, enabling its usage in more demanding environments and contributing to a more circular economy.
Report Segmentation & Scope
This report segments the LDPE market based on several key criteria, including product type (film grade, injection molding grade, others), application (packaging, films, consumer goods, others), and region (North America, Europe, Asia-Pacific, Middle East & Africa, South America). Each segment's growth projections, market size, and competitive dynamics are analyzed separately. The report provides a detailed understanding of the LDPE market across various geographical locations and application areas, offering comprehensive market insights.
Key Drivers of Low Density Polyethylene Industry Growth
Several factors are driving growth in the LDPE industry. Technological advancements, such as improved polymerization techniques and the development of specialized grades for specific applications, are leading to enhanced product properties and improved efficiency. Economic growth in emerging economies is boosting demand, particularly in the packaging and consumer goods sectors. Favorable government policies promoting industrial development and infrastructure projects also contribute to market expansion.
Challenges in the Low Density Polyethylene Industry Sector
The LDPE industry faces several challenges. Fluctuating raw material prices (e.g., crude oil) impact production costs and profitability. Growing environmental concerns about plastic waste are leading to increased scrutiny and stricter regulations, necessitating sustainable practices. Intense competition among manufacturers requires ongoing innovation and cost optimization to maintain market share. The combined effect of these challenges puts pressure on the industry to adapt and implement sustainable solutions.
Leading Players in the Low Density Polyethylene Industry Market
- Chevron Phillips Chemical Company LLC
- Dow
- ExxonMobil Corporation
- Formosa Plastics Corporation
- LG Chem
- LyondellBasell Industries Holdings BV
- NOVA Chemicals Corporate
- PetroChina
- Reliance Industries Limited
- Westlake Corporation *List Not Exhaustive
Key Developments in Low Density Polyethylene Industry Sector
- October 2023: LyondellBasell acquired a 50% stake in Rodepa Vastgoed BV, boosting its recycled LDPE capacity and strengthening its commitment to circular economy solutions.
- November 2022: Shell Polymers Monaca (SPM) commenced operations, significantly increasing polyethylene production capacity in the Northeastern United States.
- January 2022: ExxonMobil and SABIC launched Gulf Coast Growth Ventures, adding substantial polyethylene production capacity to the US Gulf Coast.
Strategic Low Density Polyethylene Industry Market Outlook
The LDPE market is poised for continued growth, driven by factors such as rising demand from emerging economies, technological innovations, and increased focus on sustainability. Strategic opportunities lie in developing bio-based LDPE, enhancing recycling infrastructure, and creating innovative applications that address specific customer needs. Companies that effectively manage raw material costs, embrace sustainability initiatives, and invest in R&D will be well-positioned to capture market share and drive future growth.
Low Density Polyethylene Industry Segmentation
-
1. Product Type
- 1.1. Blow Molded
- 1.2. Films
- 1.3. Injection Molded
- 1.4. Sheets
- 1.5. Other Pr
-
2. End-user Industry
- 2.1. Agriculture
- 2.2. Electrical and Electronics
- 2.3. Packaging
- 2.4. Construction
- 2.5. Other En
Low Density Polyethylene Industry Segmentation By Geography
-
1. Asia Pacific
- 1.1. China
- 1.2. India
- 1.3. Japan
- 1.4. South Korea
- 1.5. Malaysia
- 1.6. Thailand
- 1.7. Indonesia
- 1.8. Vietnam
- 1.9. Rest of Asia Pacific
-
2. North America
- 2.1. United States
- 2.2. Canada
- 2.3. Mexico
-
3. Europe
- 3.1. Germany
- 3.2. United Kingdom
- 3.3. France
- 3.4. Italy
- 3.5. Spain
- 3.6. NORDIC Countries
- 3.7. Turkey
- 3.8. Russia
- 3.9. Rest of Europe
-
4. South America
- 4.1. Brazil
- 4.2. Argentina
- 4.3. Colombia
- 4.4. Rest of South America
-
5. Middle East and Africa
- 5.1. Saudi Arabia
- 5.2. Qatar
- 5.3. United Arab Emirates
- 5.4. Nigeria
- 5.5. Egypt
- 5.6. South Africa
- 5.7. Rest of Middle East and Africa
Low Density Polyethylene Industry REPORT HIGHLIGHTS
| Aspects | Details |
|---|---|
| Study Period | 2019-2033 |
| Base Year | 2024 |
| Estimated Year | 2025 |
| Forecast Period | 2025-2033 |
| Historical Period | 2019-2024 |
| Growth Rate | CAGR of > 3.00% from 2019-2033 |
| Segmentation |
|
Table of Contents
- 1. Introduction
- 1.1. Research Scope
- 1.2. Market Segmentation
- 1.3. Research Methodology
- 1.4. Definitions and Assumptions
- 2. Executive Summary
- 2.1. Introduction
- 3. Market Dynamics
- 3.1. Introduction
- 3.2. Market Drivers
- 3.2.1. Increasing Demand from the Packaging Industry; Surging Demand for Film and Sheets; Other Drivers
- 3.3. Market Restrains
- 3.3.1. Increasing Demand from the Packaging Industry; Surging Demand for Film and Sheets; Other Drivers
- 3.4. Market Trends
- 3.4.1. Packaging Industry to Dominate the Market
- 4. Market Factor Analysis
- 4.1. Porters Five Forces
- 4.2. Supply/Value Chain
- 4.3. PESTEL analysis
- 4.4. Market Entropy
- 4.5. Patent/Trademark Analysis
- 5. Global Low Density Polyethylene Industry Analysis, Insights and Forecast, 2019-2031
- 5.1. Market Analysis, Insights and Forecast - by Product Type
- 5.1.1. Blow Molded
- 5.1.2. Films
- 5.1.3. Injection Molded
- 5.1.4. Sheets
- 5.1.5. Other Pr
- 5.2. Market Analysis, Insights and Forecast - by End-user Industry
- 5.2.1. Agriculture
- 5.2.2. Electrical and Electronics
- 5.2.3. Packaging
- 5.2.4. Construction
- 5.2.5. Other En
- 5.3. Market Analysis, Insights and Forecast - by Region
- 5.3.1. Asia Pacific
- 5.3.2. North America
- 5.3.3. Europe
- 5.3.4. South America
- 5.3.5. Middle East and Africa
- 5.1. Market Analysis, Insights and Forecast - by Product Type
- 6. Asia Pacific Low Density Polyethylene Industry Analysis, Insights and Forecast, 2019-2031
- 6.1. Market Analysis, Insights and Forecast - by Product Type
- 6.1.1. Blow Molded
- 6.1.2. Films
- 6.1.3. Injection Molded
- 6.1.4. Sheets
- 6.1.5. Other Pr
- 6.2. Market Analysis, Insights and Forecast - by End-user Industry
- 6.2.1. Agriculture
- 6.2.2. Electrical and Electronics
- 6.2.3. Packaging
- 6.2.4. Construction
- 6.2.5. Other En
- 6.1. Market Analysis, Insights and Forecast - by Product Type
- 7. North America Low Density Polyethylene Industry Analysis, Insights and Forecast, 2019-2031
- 7.1. Market Analysis, Insights and Forecast - by Product Type
- 7.1.1. Blow Molded
- 7.1.2. Films
- 7.1.3. Injection Molded
- 7.1.4. Sheets
- 7.1.5. Other Pr
- 7.2. Market Analysis, Insights and Forecast - by End-user Industry
- 7.2.1. Agriculture
- 7.2.2. Electrical and Electronics
- 7.2.3. Packaging
- 7.2.4. Construction
- 7.2.5. Other En
- 7.1. Market Analysis, Insights and Forecast - by Product Type
- 8. Europe Low Density Polyethylene Industry Analysis, Insights and Forecast, 2019-2031
- 8.1. Market Analysis, Insights and Forecast - by Product Type
- 8.1.1. Blow Molded
- 8.1.2. Films
- 8.1.3. Injection Molded
- 8.1.4. Sheets
- 8.1.5. Other Pr
- 8.2. Market Analysis, Insights and Forecast - by End-user Industry
- 8.2.1. Agriculture
- 8.2.2. Electrical and Electronics
- 8.2.3. Packaging
- 8.2.4. Construction
- 8.2.5. Other En
- 8.1. Market Analysis, Insights and Forecast - by Product Type
- 9. South America Low Density Polyethylene Industry Analysis, Insights and Forecast, 2019-2031
- 9.1. Market Analysis, Insights and Forecast - by Product Type
- 9.1.1. Blow Molded
- 9.1.2. Films
- 9.1.3. Injection Molded
- 9.1.4. Sheets
- 9.1.5. Other Pr
- 9.2. Market Analysis, Insights and Forecast - by End-user Industry
- 9.2.1. Agriculture
- 9.2.2. Electrical and Electronics
- 9.2.3. Packaging
- 9.2.4. Construction
- 9.2.5. Other En
- 9.1. Market Analysis, Insights and Forecast - by Product Type
- 10. Middle East and Africa Low Density Polyethylene Industry Analysis, Insights and Forecast, 2019-2031
- 10.1. Market Analysis, Insights and Forecast - by Product Type
- 10.1.1. Blow Molded
- 10.1.2. Films
- 10.1.3. Injection Molded
- 10.1.4. Sheets
- 10.1.5. Other Pr
- 10.2. Market Analysis, Insights and Forecast - by End-user Industry
- 10.2.1. Agriculture
- 10.2.2. Electrical and Electronics
- 10.2.3. Packaging
- 10.2.4. Construction
- 10.2.5. Other En
- 10.1. Market Analysis, Insights and Forecast - by Product Type
- 11. Competitive Analysis
- 11.1. Global Market Share Analysis 2024
- 11.2. Company Profiles
- 11.2.1 Chevron Phillips Chemical Company LLC
- 11.2.1.1. Overview
- 11.2.1.2. Products
- 11.2.1.3. SWOT Analysis
- 11.2.1.4. Recent Developments
- 11.2.1.5. Financials (Based on Availability)
- 11.2.2 Dow
- 11.2.2.1. Overview
- 11.2.2.2. Products
- 11.2.2.3. SWOT Analysis
- 11.2.2.4. Recent Developments
- 11.2.2.5. Financials (Based on Availability)
- 11.2.3 ExxonMobil Corporation
- 11.2.3.1. Overview
- 11.2.3.2. Products
- 11.2.3.3. SWOT Analysis
- 11.2.3.4. Recent Developments
- 11.2.3.5. Financials (Based on Availability)
- 11.2.4 Formosa Plastics Corporation
- 11.2.4.1. Overview
- 11.2.4.2. Products
- 11.2.4.3. SWOT Analysis
- 11.2.4.4. Recent Developments
- 11.2.4.5. Financials (Based on Availability)
- 11.2.5 LG Chem
- 11.2.5.1. Overview
- 11.2.5.2. Products
- 11.2.5.3. SWOT Analysis
- 11.2.5.4. Recent Developments
- 11.2.5.5. Financials (Based on Availability)
- 11.2.6 LyondellBasell Industries Holdings BV
- 11.2.6.1. Overview
- 11.2.6.2. Products
- 11.2.6.3. SWOT Analysis
- 11.2.6.4. Recent Developments
- 11.2.6.5. Financials (Based on Availability)
- 11.2.7 NOVA Chemicals Corporate
- 11.2.7.1. Overview
- 11.2.7.2. Products
- 11.2.7.3. SWOT Analysis
- 11.2.7.4. Recent Developments
- 11.2.7.5. Financials (Based on Availability)
- 11.2.8 PetroChina
- 11.2.8.1. Overview
- 11.2.8.2. Products
- 11.2.8.3. SWOT Analysis
- 11.2.8.4. Recent Developments
- 11.2.8.5. Financials (Based on Availability)
- 11.2.9 Reliance Industries Limited
- 11.2.9.1. Overview
- 11.2.9.2. Products
- 11.2.9.3. SWOT Analysis
- 11.2.9.4. Recent Developments
- 11.2.9.5. Financials (Based on Availability)
- 11.2.10 Westlake Corporation*List Not Exhaustive
- 11.2.10.1. Overview
- 11.2.10.2. Products
- 11.2.10.3. SWOT Analysis
- 11.2.10.4. Recent Developments
- 11.2.10.5. Financials (Based on Availability)
- 11.2.1 Chevron Phillips Chemical Company LLC
List of Figures
- Figure 1: Global Low Density Polyethylene Industry Revenue Breakdown (Million, %) by Region 2024 & 2032
- Figure 2: Asia Pacific Low Density Polyethylene Industry Revenue (Million), by Product Type 2024 & 2032
- Figure 3: Asia Pacific Low Density Polyethylene Industry Revenue Share (%), by Product Type 2024 & 2032
- Figure 4: Asia Pacific Low Density Polyethylene Industry Revenue (Million), by End-user Industry 2024 & 2032
- Figure 5: Asia Pacific Low Density Polyethylene Industry Revenue Share (%), by End-user Industry 2024 & 2032
- Figure 6: Asia Pacific Low Density Polyethylene Industry Revenue (Million), by Country 2024 & 2032
- Figure 7: Asia Pacific Low Density Polyethylene Industry Revenue Share (%), by Country 2024 & 2032
- Figure 8: North America Low Density Polyethylene Industry Revenue (Million), by Product Type 2024 & 2032
- Figure 9: North America Low Density Polyethylene Industry Revenue Share (%), by Product Type 2024 & 2032
- Figure 10: North America Low Density Polyethylene Industry Revenue (Million), by End-user Industry 2024 & 2032
- Figure 11: North America Low Density Polyethylene Industry Revenue Share (%), by End-user Industry 2024 & 2032
- Figure 12: North America Low Density Polyethylene Industry Revenue (Million), by Country 2024 & 2032
- Figure 13: North America Low Density Polyethylene Industry Revenue Share (%), by Country 2024 & 2032
- Figure 14: Europe Low Density Polyethylene Industry Revenue (Million), by Product Type 2024 & 2032
- Figure 15: Europe Low Density Polyethylene Industry Revenue Share (%), by Product Type 2024 & 2032
- Figure 16: Europe Low Density Polyethylene Industry Revenue (Million), by End-user Industry 2024 & 2032
- Figure 17: Europe Low Density Polyethylene Industry Revenue Share (%), by End-user Industry 2024 & 2032
- Figure 18: Europe Low Density Polyethylene Industry Revenue (Million), by Country 2024 & 2032
- Figure 19: Europe Low Density Polyethylene Industry Revenue Share (%), by Country 2024 & 2032
- Figure 20: South America Low Density Polyethylene Industry Revenue (Million), by Product Type 2024 & 2032
- Figure 21: South America Low Density Polyethylene Industry Revenue Share (%), by Product Type 2024 & 2032
- Figure 22: South America Low Density Polyethylene Industry Revenue (Million), by End-user Industry 2024 & 2032
- Figure 23: South America Low Density Polyethylene Industry Revenue Share (%), by End-user Industry 2024 & 2032
- Figure 24: South America Low Density Polyethylene Industry Revenue (Million), by Country 2024 & 2032
- Figure 25: South America Low Density Polyethylene Industry Revenue Share (%), by Country 2024 & 2032
- Figure 26: Middle East and Africa Low Density Polyethylene Industry Revenue (Million), by Product Type 2024 & 2032
- Figure 27: Middle East and Africa Low Density Polyethylene Industry Revenue Share (%), by Product Type 2024 & 2032
- Figure 28: Middle East and Africa Low Density Polyethylene Industry Revenue (Million), by End-user Industry 2024 & 2032
- Figure 29: Middle East and Africa Low Density Polyethylene Industry Revenue Share (%), by End-user Industry 2024 & 2032
- Figure 30: Middle East and Africa Low Density Polyethylene Industry Revenue (Million), by Country 2024 & 2032
- Figure 31: Middle East and Africa Low Density Polyethylene Industry Revenue Share (%), by Country 2024 & 2032
List of Tables
- Table 1: Global Low Density Polyethylene Industry Revenue Million Forecast, by Region 2019 & 2032
- Table 2: Global Low Density Polyethylene Industry Revenue Million Forecast, by Product Type 2019 & 2032
- Table 3: Global Low Density Polyethylene Industry Revenue Million Forecast, by End-user Industry 2019 & 2032
- Table 4: Global Low Density Polyethylene Industry Revenue Million Forecast, by Region 2019 & 2032
- Table 5: Global Low Density Polyethylene Industry Revenue Million Forecast, by Product Type 2019 & 2032
- Table 6: Global Low Density Polyethylene Industry Revenue Million Forecast, by End-user Industry 2019 & 2032
- Table 7: Global Low Density Polyethylene Industry Revenue Million Forecast, by Country 2019 & 2032
- Table 8: China Low Density Polyethylene Industry Revenue (Million) Forecast, by Application 2019 & 2032
- Table 9: India Low Density Polyethylene Industry Revenue (Million) Forecast, by Application 2019 & 2032
- Table 10: Japan Low Density Polyethylene Industry Revenue (Million) Forecast, by Application 2019 & 2032
- Table 11: South Korea Low Density Polyethylene Industry Revenue (Million) Forecast, by Application 2019 & 2032
- Table 12: Malaysia Low Density Polyethylene Industry Revenue (Million) Forecast, by Application 2019 & 2032
- Table 13: Thailand Low Density Polyethylene Industry Revenue (Million) Forecast, by Application 2019 & 2032
- Table 14: Indonesia Low Density Polyethylene Industry Revenue (Million) Forecast, by Application 2019 & 2032
- Table 15: Vietnam Low Density Polyethylene Industry Revenue (Million) Forecast, by Application 2019 & 2032
- Table 16: Rest of Asia Pacific Low Density Polyethylene Industry Revenue (Million) Forecast, by Application 2019 & 2032
- Table 17: Global Low Density Polyethylene Industry Revenue Million Forecast, by Product Type 2019 & 2032
- Table 18: Global Low Density Polyethylene Industry Revenue Million Forecast, by End-user Industry 2019 & 2032
- Table 19: Global Low Density Polyethylene Industry Revenue Million Forecast, by Country 2019 & 2032
- Table 20: United States Low Density Polyethylene Industry Revenue (Million) Forecast, by Application 2019 & 2032
- Table 21: Canada Low Density Polyethylene Industry Revenue (Million) Forecast, by Application 2019 & 2032
- Table 22: Mexico Low Density Polyethylene Industry Revenue (Million) Forecast, by Application 2019 & 2032
- Table 23: Global Low Density Polyethylene Industry Revenue Million Forecast, by Product Type 2019 & 2032
- Table 24: Global Low Density Polyethylene Industry Revenue Million Forecast, by End-user Industry 2019 & 2032
- Table 25: Global Low Density Polyethylene Industry Revenue Million Forecast, by Country 2019 & 2032
- Table 26: Germany Low Density Polyethylene Industry Revenue (Million) Forecast, by Application 2019 & 2032
- Table 27: United Kingdom Low Density Polyethylene Industry Revenue (Million) Forecast, by Application 2019 & 2032
- Table 28: France Low Density Polyethylene Industry Revenue (Million) Forecast, by Application 2019 & 2032
- Table 29: Italy Low Density Polyethylene Industry Revenue (Million) Forecast, by Application 2019 & 2032
- Table 30: Spain Low Density Polyethylene Industry Revenue (Million) Forecast, by Application 2019 & 2032
- Table 31: NORDIC Countries Low Density Polyethylene Industry Revenue (Million) Forecast, by Application 2019 & 2032
- Table 32: Turkey Low Density Polyethylene Industry Revenue (Million) Forecast, by Application 2019 & 2032
- Table 33: Russia Low Density Polyethylene Industry Revenue (Million) Forecast, by Application 2019 & 2032
- Table 34: Rest of Europe Low Density Polyethylene Industry Revenue (Million) Forecast, by Application 2019 & 2032
- Table 35: Global Low Density Polyethylene Industry Revenue Million Forecast, by Product Type 2019 & 2032
- Table 36: Global Low Density Polyethylene Industry Revenue Million Forecast, by End-user Industry 2019 & 2032
- Table 37: Global Low Density Polyethylene Industry Revenue Million Forecast, by Country 2019 & 2032
- Table 38: Brazil Low Density Polyethylene Industry Revenue (Million) Forecast, by Application 2019 & 2032
- Table 39: Argentina Low Density Polyethylene Industry Revenue (Million) Forecast, by Application 2019 & 2032
- Table 40: Colombia Low Density Polyethylene Industry Revenue (Million) Forecast, by Application 2019 & 2032
- Table 41: Rest of South America Low Density Polyethylene Industry Revenue (Million) Forecast, by Application 2019 & 2032
- Table 42: Global Low Density Polyethylene Industry Revenue Million Forecast, by Product Type 2019 & 2032
- Table 43: Global Low Density Polyethylene Industry Revenue Million Forecast, by End-user Industry 2019 & 2032
- Table 44: Global Low Density Polyethylene Industry Revenue Million Forecast, by Country 2019 & 2032
- Table 45: Saudi Arabia Low Density Polyethylene Industry Revenue (Million) Forecast, by Application 2019 & 2032
- Table 46: Qatar Low Density Polyethylene Industry Revenue (Million) Forecast, by Application 2019 & 2032
- Table 47: United Arab Emirates Low Density Polyethylene Industry Revenue (Million) Forecast, by Application 2019 & 2032
- Table 48: Nigeria Low Density Polyethylene Industry Revenue (Million) Forecast, by Application 2019 & 2032
- Table 49: Egypt Low Density Polyethylene Industry Revenue (Million) Forecast, by Application 2019 & 2032
- Table 50: South Africa Low Density Polyethylene Industry Revenue (Million) Forecast, by Application 2019 & 2032
- Table 51: Rest of Middle East and Africa Low Density Polyethylene Industry Revenue (Million) Forecast, by Application 2019 & 2032
Frequently Asked Questions
1. What is the projected Compound Annual Growth Rate (CAGR) of the Low Density Polyethylene Industry?
The projected CAGR is approximately > 3.00%.
2. Which companies are prominent players in the Low Density Polyethylene Industry?
Key companies in the market include Chevron Phillips Chemical Company LLC, Dow, ExxonMobil Corporation, Formosa Plastics Corporation, LG Chem, LyondellBasell Industries Holdings BV, NOVA Chemicals Corporate, PetroChina, Reliance Industries Limited, Westlake Corporation*List Not Exhaustive.
3. What are the main segments of the Low Density Polyethylene Industry?
The market segments include Product Type, End-user Industry.
4. Can you provide details about the market size?
The market size is estimated to be USD XX Million as of 2022.
5. What are some drivers contributing to market growth?
Increasing Demand from the Packaging Industry; Surging Demand for Film and Sheets; Other Drivers.
6. What are the notable trends driving market growth?
Packaging Industry to Dominate the Market.
7. Are there any restraints impacting market growth?
Increasing Demand from the Packaging Industry; Surging Demand for Film and Sheets; Other Drivers.
8. Can you provide examples of recent developments in the market?
October 2023: LyondellBasell acquired a 50% stake in Rodepa Vastgoed BV, the holding company of De Paauw Sustainable Resources (DPSR). DPSR specializes in sourcing, processing, and trading plastic packaging waste, transforming it into recycled polypropylene (PP) and low-density polyethylene (LDPE) materials. This partnership enables LyondellBasell to broaden its CirculenRecover portfolio of mechanically recycled polymers, enhancing the solutions offered to its customers.November 2022: Shell Chemical Appalachia LLC, a subsidiary of Shell PLC, commenced operations at its Pennsylvania Chemical project, known as Shell Polymers Monaca (SPM). This facility marks the Northeastern United States' inaugural major polyethylene manufacturing complex, boasting a designed annual output of 1.6 million tonnes. The commencement of operations at Shell Polymers Monaca underscored Shell's commitment to expanding its chemicals business, aligning with its overarching Powering Progress strategy.January 2022: ExxonMobil and SABIC launched a new venture, Gulf Coast Growth Ventures, by setting up a manufacturing facility in San Patricio County, Texas. The facility was planned to house two polyethylene units, boasting a combined production capacity of 1.3 million tonnes annually. This strategic move positioned the companies to cater to the rising global demand for performance products and underscored their significant investment in the US Gulf Coast.
9. What pricing options are available for accessing the report?
Pricing options include single-user, multi-user, and enterprise licenses priced at USD 4750, USD 5250, and USD 8750 respectively.
10. Is the market size provided in terms of value or volume?
The market size is provided in terms of value, measured in Million.
11. Are there any specific market keywords associated with the report?
Yes, the market keyword associated with the report is "Low Density Polyethylene Industry," which aids in identifying and referencing the specific market segment covered.
12. How do I determine which pricing option suits my needs best?
The pricing options vary based on user requirements and access needs. Individual users may opt for single-user licenses, while businesses requiring broader access may choose multi-user or enterprise licenses for cost-effective access to the report.
13. Are there any additional resources or data provided in the Low Density Polyethylene Industry report?
While the report offers comprehensive insights, it's advisable to review the specific contents or supplementary materials provided to ascertain if additional resources or data are available.
14. How can I stay updated on further developments or reports in the Low Density Polyethylene Industry?
To stay informed about further developments, trends, and reports in the Low Density Polyethylene Industry, consider subscribing to industry newsletters, following relevant companies and organizations, or regularly checking reputable industry news sources and publications.
Methodology
Step 1 - Identification of Relevant Samples Size from Population Database


Step 2 - Approaches for Defining Global Market Size (Value, Volume* & Price*)

Note*: In applicable scenarios
Step 3 - Data Sources
Primary Research
- Web Analytics
- Survey Reports
- Research Institute
- Latest Research Reports
- Opinion Leaders
Secondary Research
- Annual Reports
- White Paper
- Latest Press Release
- Industry Association
- Paid Database
- Investor Presentations

Step 4 - Data Triangulation
Involves using different sources of information in order to increase the validity of a study
These sources are likely to be stakeholders in a program - participants, other researchers, program staff, other community members, and so on.
Then we put all data in single framework & apply various statistical tools to find out the dynamic on the market.
During the analysis stage, feedback from the stakeholder groups would be compared to determine areas of agreement as well as areas of divergence


