
Key Insights
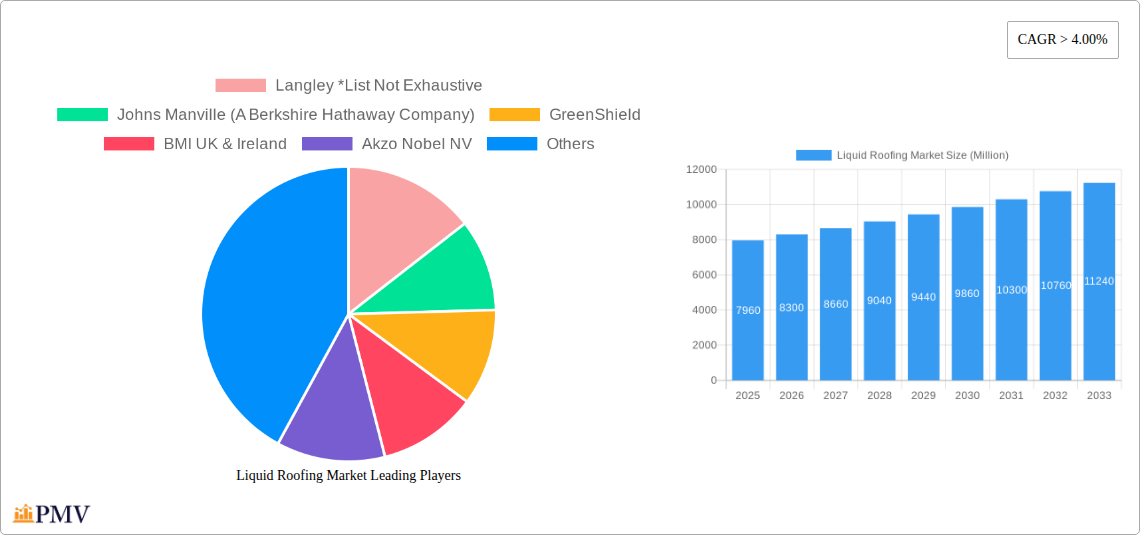
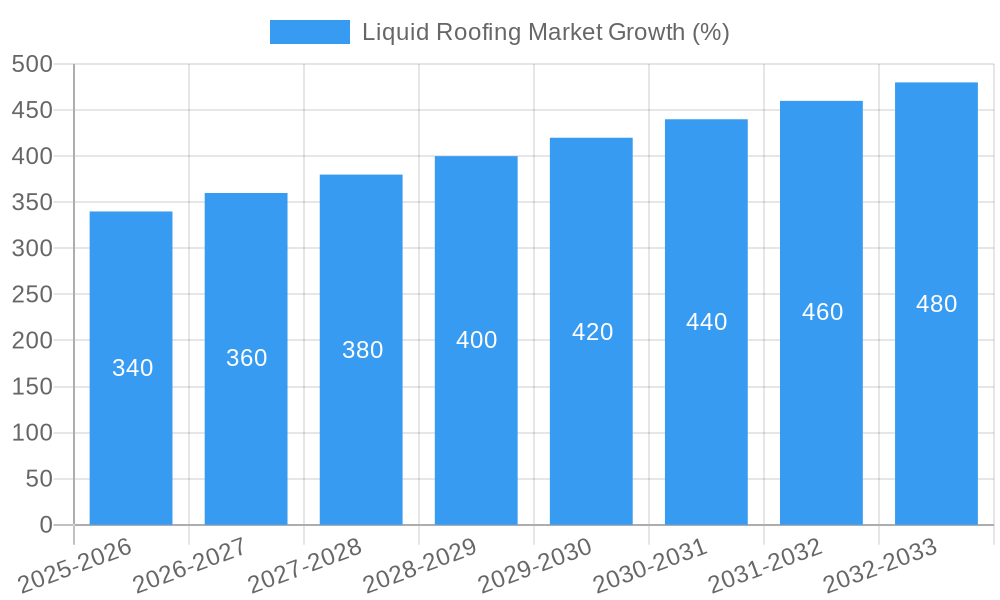
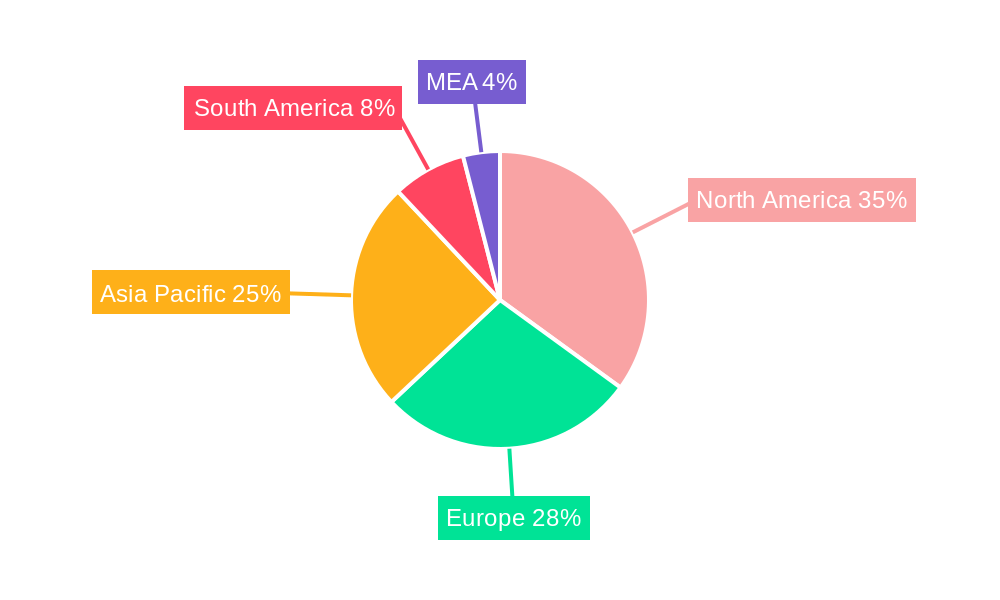
The global liquid roofing market, valued at approximately $7.96 billion in 2025, is projected to experience robust growth, exhibiting a Compound Annual Growth Rate (CAGR) exceeding 4% from 2025 to 2033. This expansion is fueled by several key drivers. The increasing demand for sustainable and eco-friendly building materials is pushing adoption of liquid roofing systems, known for their energy efficiency and reduced environmental impact compared to traditional roofing methods. Furthermore, the rising prevalence of green building initiatives and stringent building codes in developed nations are stimulating market growth. The ease and speed of application, cost-effectiveness for large-scale projects, and superior waterproofing capabilities of liquid roofing solutions are also contributing significantly to market expansion. Specific applications, like flat roofs and domed roofs in commercial and industrial sectors, represent significant growth segments. The market's segmentation by coating type reveals a diverse landscape, with polyurethane, acrylic, and bitumen coatings holding significant market share, although the demand for more specialized coatings, such as silicone and epoxy, is growing due to their superior performance attributes in extreme weather conditions and specific industrial applications. The geographic spread shows strong growth potential in rapidly developing economies across Asia Pacific and South America, driven by urbanization and substantial infrastructural development projects.
The competitive landscape is marked by both large multinational corporations and specialized regional players. Key market participants, including Langley, Johns Manville, GreenShield, BMI UK & Ireland, and Akzo Nobel, are investing heavily in research and development to introduce innovative products with enhanced durability, longevity, and sustainable attributes. Strategic partnerships, mergers, and acquisitions are shaping the competitive dynamic, with companies seeking to expand their geographic reach and product portfolios. However, challenges such as fluctuating raw material prices, stringent regulatory compliance requirements, and the need for skilled labor for installation may present limitations to the market's overall growth trajectory. Nevertheless, the long-term outlook remains positive, driven by consistent growth in construction activities worldwide and the inherent advantages of liquid roofing solutions.
Liquid Roofing Market: A Comprehensive Analysis (2019-2033)
This detailed report provides a comprehensive analysis of the global liquid roofing market, encompassing market size, segmentation, competitive landscape, and future growth projections from 2019 to 2033. The study covers key aspects, including market structure, industry trends, dominant segments, product innovations, and challenges, offering actionable insights for stakeholders across the value chain. The base year for this analysis is 2025, with estimates extending to 2033 and historical data covering 2019-2024. The market is valued at xx Million in 2025 and is projected to reach xx Million by 2033, exhibiting a CAGR of xx%.
Liquid Roofing Market Market Structure & Competitive Dynamics
The global liquid roofing market is characterized by a moderately concentrated structure, with several key players holding significant market share. The market exhibits a dynamic competitive landscape with continuous innovation in product offerings and technologies. Regulatory frameworks, varying by region, influence market access and product compliance. Product substitutes, such as traditional roofing materials, exert competitive pressure. End-user trends, particularly towards sustainable and cost-effective solutions, are shaping market demand. M&A activities, while not extremely frequent, play a role in consolidating market share and expanding product portfolios. For example, the value of M&A deals in the liquid roofing sector in 2024 was estimated at xx Million. Leading companies, such as Langley, Johns Manville, and Sika AG, maintain substantial market share through brand recognition, extensive distribution networks, and continuous product development. The market share of the top five players is approximately xx%.
Liquid Roofing Market Industry Trends & Insights
The liquid roofing market is experiencing robust growth driven by several key factors. Increased infrastructure development, particularly in emerging economies, fuels demand for durable and cost-effective roofing solutions. The rising adoption of sustainable building practices is further boosting the market as liquid roofing systems offer improved energy efficiency and reduced environmental impact compared to traditional methods. Technological advancements, such as the development of high-performance coatings with enhanced durability and longevity, are contributing to market expansion. The increasing preference for aesthetically pleasing and customizable roofing options is also driving demand for liquid roofing systems. The market penetration of liquid roofing solutions in the residential sector is expected to increase from xx% in 2025 to xx% by 2033. The CAGR for the overall market during the forecast period is projected to be xx%. Intense competition among manufacturers is leading to innovations in product features, pricing strategies, and customer service.
Dominant Markets & Segments in Liquid Roofing Market
The global liquid roofing market shows regional variations in dominance. Currently, North America and Europe command significant market share, driven by established infrastructure and high construction activity. However, the Asia-Pacific region is exhibiting the fastest growth rate, fueled by rapid urbanization and industrialization. Within market segments:
- End-user Industry: The commercial sector currently dominates the market, followed by industrial/institutional and residential sectors. Key drivers for commercial dominance include the need for durable and long-lasting roofing solutions in large-scale buildings. Infrastructure projects also represent a significant growth segment.
- Type: Polyurethane coatings currently hold the largest market share due to their excellent waterproofing properties and flexibility. However, silicone and acrylic coatings are gaining traction due to their ease of application and environmentally friendly attributes. The "Other Types" segment is also growing steadily due to the introduction of innovative materials with enhanced performance characteristics.
- Application: Flat roofs represent the largest application segment due to the widespread use of flat roofs in commercial and industrial buildings. However, pitched roofs and domed roofs represent significant opportunities for growth. Key drivers in each segment include: favorable economic policies, increasing infrastructure spending, and stringent building codes.
Liquid Roofing Market Product Innovations
Recent years have witnessed significant advancements in liquid roofing technology. Manufacturers are focusing on developing high-performance coatings with improved durability, weather resistance, and energy efficiency. The introduction of self-healing coatings and systems with integrated solar panels exemplifies the ongoing innovation. These advancements are improving the market fit of liquid roofing systems by addressing concerns about longevity and sustainability.
Report Segmentation & Scope
This report provides a granular segmentation of the liquid roofing market across various parameters:
- End-user Industry: Residential, Commercial, Industrial/Institutional, Infrastructure. Each segment's growth trajectory is analyzed based on factors specific to that sector.
- Type: Polyurethane Coatings, Acrylic Coatings, Bituminous Coatings, Silicone Coatings, Epoxy Coatings, Other Types (Modified Silane Polymers, EPDM Rubbers, Elastomeric Membranes, Cementitious Membranes, and Epoxy Coatings). Market size and growth projections are detailed for each coating type.
- Application: Domed Roofs, Pitched Roof, Flat Roofed. The report evaluates the market potential of each application segment based on regional trends and building design preferences.
Key Drivers of Liquid Roofing Market Growth
The liquid roofing market's expansion is propelled by several key factors: the increasing demand for sustainable and energy-efficient building solutions, the growing need for durable and long-lasting roofing materials in diverse climates, and government initiatives promoting green building practices. Technological advancements, such as the development of self-healing and solar-integrated coatings, further stimulate growth. The expanding construction sector, particularly in emerging economies, represents a substantial driver.
Challenges in the Liquid Roofing Market Sector
Despite significant growth potential, the liquid roofing market faces certain challenges. Fluctuations in raw material prices can impact profitability. Stringent regulatory requirements and environmental concerns impose compliance costs. Intense competition from traditional roofing materials and other emerging technologies necessitates continuous innovation and cost optimization. Supply chain disruptions can also impact production and delivery timelines, potentially affecting market growth.
Leading Players in the Liquid Roofing Market Market
- Langley
- Johns Manville (A Berkshire Hathaway Company)
- GreenShield
- BMI UK & Ireland
- Akzo Nobel NV
- Alumasc Building Products
- Liquid Roofing Systems LTD
- SIG Design and Technology (Part of SIG PLC)
- BASF SE
- Laydex
- GAF
- Sika AG
- Kemper System Ltd
- Saint-Gobain Weber
Key Developments in Liquid Roofing Market Sector
- October 2023: Langley introduced a new Langley PU Liquid Waterproofing system, offering a 25-year system with a two-coat application, significantly reducing installation time.
- October 2023: BASF partnered with Oriental Yuhong to develop solar roofing membranes, targeting China's growing demand for rooftop solar panels.
Strategic Liquid Roofing Market Market Outlook
The future of the liquid roofing market appears promising, driven by ongoing technological innovations, increasing awareness of sustainable building practices, and the continued expansion of the global construction industry. Strategic opportunities exist for manufacturers to invest in research and development, expand their product portfolios, and explore new market segments. Companies focusing on sustainable and cost-effective solutions are expected to gain a competitive advantage. The market's growth will be particularly influenced by the adoption of these technologies in emerging markets.
Liquid Roofing Market Segmentation
-
1. Type
- 1.1. Polyurethane Coatings
- 1.2. Acrylic Coatings
- 1.3. Bituminous Coatings
- 1.4. Silicone Coatings
- 1.5. Epoxy Coatings
- 1.6. Other Ty
-
2. Application
- 2.1. Domed Roofs
- 2.2. Pitched Roof
- 2.3. Flat Roofed
-
3. End-user Industry
- 3.1. Residential
- 3.2. Commercial
- 3.3. Industrial/Institutional
- 3.4. Infrastructure
Liquid Roofing Market Segmentation By Geography
-
1. Asia Pacific
- 1.1. China
- 1.2. India
- 1.3. Japan
- 1.4. South Korea
- 1.5. Malaysia
- 1.6. Thailand
- 1.7. Indonesia
- 1.8. Vietnam
- 1.9. Rest of Asia Pacific
-
2. North America
- 2.1. United States
- 2.2. Canada
- 2.3. Mexico
-
3. Europe
- 3.1. Germany
- 3.2. United Kingdom
- 3.3. France
- 3.4. Italy
- 3.5. Spain
- 3.6. NORDIC
- 3.7. Turkey
- 3.8. Russia
- 3.9. Rest of Europe
-
4. South America
- 4.1. Brazil
- 4.2. Argentina
- 4.3. Colombia
- 4.4. Rest of South America
-
5. Middle East and Africa
- 5.1. Saudi Arabia
- 5.2. South Africa
- 5.3. Nigeria
- 5.4. Qatar
- 5.5. Egypt
- 5.6. UAE
- 5.7. Rest of Middle East and Africa
Liquid Roofing Market REPORT HIGHLIGHTS
| Aspects | Details |
|---|---|
| Study Period | 2019-2033 |
| Base Year | 2024 |
| Estimated Year | 2025 |
| Forecast Period | 2025-2033 |
| Historical Period | 2019-2024 |
| Growth Rate | CAGR of > 4.00% from 2019-2033 |
| Segmentation |
|
Table of Contents
- 1. Introduction
- 1.1. Research Scope
- 1.2. Market Segmentation
- 1.3. Research Methodology
- 1.4. Definitions and Assumptions
- 2. Executive Summary
- 2.1. Introduction
- 3. Market Dynamics
- 3.1. Introduction
- 3.2. Market Drivers
- 3.2.1. Growing Residential Segment; Increasing Consumer Awareness for Liquid Roofing; Other Drivers
- 3.3. Market Restrains
- 3.3.1. Unfavorable Conditions Arising Due to COVID-19 Outbreak; Other Restraints
- 3.4. Market Trends
- 3.4.1. Residential Segment to Dominate the Market
- 4. Market Factor Analysis
- 4.1. Porters Five Forces
- 4.2. Supply/Value Chain
- 4.3. PESTEL analysis
- 4.4. Market Entropy
- 4.5. Patent/Trademark Analysis
- 5. Global Liquid Roofing Market Analysis, Insights and Forecast, 2019-2031
- 5.1. Market Analysis, Insights and Forecast - by Type
- 5.1.1. Polyurethane Coatings
- 5.1.2. Acrylic Coatings
- 5.1.3. Bituminous Coatings
- 5.1.4. Silicone Coatings
- 5.1.5. Epoxy Coatings
- 5.1.6. Other Ty
- 5.2. Market Analysis, Insights and Forecast - by Application
- 5.2.1. Domed Roofs
- 5.2.2. Pitched Roof
- 5.2.3. Flat Roofed
- 5.3. Market Analysis, Insights and Forecast - by End-user Industry
- 5.3.1. Residential
- 5.3.2. Commercial
- 5.3.3. Industrial/Institutional
- 5.3.4. Infrastructure
- 5.4. Market Analysis, Insights and Forecast - by Region
- 5.4.1. Asia Pacific
- 5.4.2. North America
- 5.4.3. Europe
- 5.4.4. South America
- 5.4.5. Middle East and Africa
- 5.1. Market Analysis, Insights and Forecast - by Type
- 6. Asia Pacific Liquid Roofing Market Analysis, Insights and Forecast, 2019-2031
- 6.1. Market Analysis, Insights and Forecast - by Type
- 6.1.1. Polyurethane Coatings
- 6.1.2. Acrylic Coatings
- 6.1.3. Bituminous Coatings
- 6.1.4. Silicone Coatings
- 6.1.5. Epoxy Coatings
- 6.1.6. Other Ty
- 6.2. Market Analysis, Insights and Forecast - by Application
- 6.2.1. Domed Roofs
- 6.2.2. Pitched Roof
- 6.2.3. Flat Roofed
- 6.3. Market Analysis, Insights and Forecast - by End-user Industry
- 6.3.1. Residential
- 6.3.2. Commercial
- 6.3.3. Industrial/Institutional
- 6.3.4. Infrastructure
- 6.1. Market Analysis, Insights and Forecast - by Type
- 7. North America Liquid Roofing Market Analysis, Insights and Forecast, 2019-2031
- 7.1. Market Analysis, Insights and Forecast - by Type
- 7.1.1. Polyurethane Coatings
- 7.1.2. Acrylic Coatings
- 7.1.3. Bituminous Coatings
- 7.1.4. Silicone Coatings
- 7.1.5. Epoxy Coatings
- 7.1.6. Other Ty
- 7.2. Market Analysis, Insights and Forecast - by Application
- 7.2.1. Domed Roofs
- 7.2.2. Pitched Roof
- 7.2.3. Flat Roofed
- 7.3. Market Analysis, Insights and Forecast - by End-user Industry
- 7.3.1. Residential
- 7.3.2. Commercial
- 7.3.3. Industrial/Institutional
- 7.3.4. Infrastructure
- 7.1. Market Analysis, Insights and Forecast - by Type
- 8. Europe Liquid Roofing Market Analysis, Insights and Forecast, 2019-2031
- 8.1. Market Analysis, Insights and Forecast - by Type
- 8.1.1. Polyurethane Coatings
- 8.1.2. Acrylic Coatings
- 8.1.3. Bituminous Coatings
- 8.1.4. Silicone Coatings
- 8.1.5. Epoxy Coatings
- 8.1.6. Other Ty
- 8.2. Market Analysis, Insights and Forecast - by Application
- 8.2.1. Domed Roofs
- 8.2.2. Pitched Roof
- 8.2.3. Flat Roofed
- 8.3. Market Analysis, Insights and Forecast - by End-user Industry
- 8.3.1. Residential
- 8.3.2. Commercial
- 8.3.3. Industrial/Institutional
- 8.3.4. Infrastructure
- 8.1. Market Analysis, Insights and Forecast - by Type
- 9. South America Liquid Roofing Market Analysis, Insights and Forecast, 2019-2031
- 9.1. Market Analysis, Insights and Forecast - by Type
- 9.1.1. Polyurethane Coatings
- 9.1.2. Acrylic Coatings
- 9.1.3. Bituminous Coatings
- 9.1.4. Silicone Coatings
- 9.1.5. Epoxy Coatings
- 9.1.6. Other Ty
- 9.2. Market Analysis, Insights and Forecast - by Application
- 9.2.1. Domed Roofs
- 9.2.2. Pitched Roof
- 9.2.3. Flat Roofed
- 9.3. Market Analysis, Insights and Forecast - by End-user Industry
- 9.3.1. Residential
- 9.3.2. Commercial
- 9.3.3. Industrial/Institutional
- 9.3.4. Infrastructure
- 9.1. Market Analysis, Insights and Forecast - by Type
- 10. Middle East and Africa Liquid Roofing Market Analysis, Insights and Forecast, 2019-2031
- 10.1. Market Analysis, Insights and Forecast - by Type
- 10.1.1. Polyurethane Coatings
- 10.1.2. Acrylic Coatings
- 10.1.3. Bituminous Coatings
- 10.1.4. Silicone Coatings
- 10.1.5. Epoxy Coatings
- 10.1.6. Other Ty
- 10.2. Market Analysis, Insights and Forecast - by Application
- 10.2.1. Domed Roofs
- 10.2.2. Pitched Roof
- 10.2.3. Flat Roofed
- 10.3. Market Analysis, Insights and Forecast - by End-user Industry
- 10.3.1. Residential
- 10.3.2. Commercial
- 10.3.3. Industrial/Institutional
- 10.3.4. Infrastructure
- 10.1. Market Analysis, Insights and Forecast - by Type
- 11. North America Liquid Roofing Market Analysis, Insights and Forecast, 2019-2031
- 11.1. Market Analysis, Insights and Forecast - By Country/Sub-region
- 11.1.1 United States
- 11.1.2 Canada
- 11.1.3 Mexico
- 12. Europe Liquid Roofing Market Analysis, Insights and Forecast, 2019-2031
- 12.1. Market Analysis, Insights and Forecast - By Country/Sub-region
- 12.1.1 Germany
- 12.1.2 United Kingdom
- 12.1.3 France
- 12.1.4 Spain
- 12.1.5 Italy
- 12.1.6 Spain
- 12.1.7 Belgium
- 12.1.8 Netherland
- 12.1.9 Nordics
- 12.1.10 Rest of Europe
- 13. Asia Pacific Liquid Roofing Market Analysis, Insights and Forecast, 2019-2031
- 13.1. Market Analysis, Insights and Forecast - By Country/Sub-region
- 13.1.1 China
- 13.1.2 Japan
- 13.1.3 India
- 13.1.4 South Korea
- 13.1.5 Southeast Asia
- 13.1.6 Australia
- 13.1.7 Indonesia
- 13.1.8 Phillipes
- 13.1.9 Singapore
- 13.1.10 Thailandc
- 13.1.11 Rest of Asia Pacific
- 14. South America Liquid Roofing Market Analysis, Insights and Forecast, 2019-2031
- 14.1. Market Analysis, Insights and Forecast - By Country/Sub-region
- 14.1.1 Brazil
- 14.1.2 Argentina
- 14.1.3 Peru
- 14.1.4 Chile
- 14.1.5 Colombia
- 14.1.6 Ecuador
- 14.1.7 Venezuela
- 14.1.8 Rest of South America
- 15. North America Liquid Roofing Market Analysis, Insights and Forecast, 2019-2031
- 15.1. Market Analysis, Insights and Forecast - By Country/Sub-region
- 15.1.1 United States
- 15.1.2 Canada
- 15.1.3 Mexico
- 16. MEA Liquid Roofing Market Analysis, Insights and Forecast, 2019-2031
- 16.1. Market Analysis, Insights and Forecast - By Country/Sub-region
- 16.1.1 United Arab Emirates
- 16.1.2 Saudi Arabia
- 16.1.3 South Africa
- 16.1.4 Rest of Middle East and Africa
- 17. Competitive Analysis
- 17.1. Global Market Share Analysis 2024
- 17.2. Company Profiles
- 17.2.1 Langley *List Not Exhaustive
- 17.2.1.1. Overview
- 17.2.1.2. Products
- 17.2.1.3. SWOT Analysis
- 17.2.1.4. Recent Developments
- 17.2.1.5. Financials (Based on Availability)
- 17.2.2 Johns Manville (A Berkshire Hathaway Company)
- 17.2.2.1. Overview
- 17.2.2.2. Products
- 17.2.2.3. SWOT Analysis
- 17.2.2.4. Recent Developments
- 17.2.2.5. Financials (Based on Availability)
- 17.2.3 GreenShield
- 17.2.3.1. Overview
- 17.2.3.2. Products
- 17.2.3.3. SWOT Analysis
- 17.2.3.4. Recent Developments
- 17.2.3.5. Financials (Based on Availability)
- 17.2.4 BMI UK & Ireland
- 17.2.4.1. Overview
- 17.2.4.2. Products
- 17.2.4.3. SWOT Analysis
- 17.2.4.4. Recent Developments
- 17.2.4.5. Financials (Based on Availability)
- 17.2.5 Akzo Nobel NV
- 17.2.5.1. Overview
- 17.2.5.2. Products
- 17.2.5.3. SWOT Analysis
- 17.2.5.4. Recent Developments
- 17.2.5.5. Financials (Based on Availability)
- 17.2.6 Alumasc Building Products
- 17.2.6.1. Overview
- 17.2.6.2. Products
- 17.2.6.3. SWOT Analysis
- 17.2.6.4. Recent Developments
- 17.2.6.5. Financials (Based on Availability)
- 17.2.7 Liquid Roofing Systems LTD
- 17.2.7.1. Overview
- 17.2.7.2. Products
- 17.2.7.3. SWOT Analysis
- 17.2.7.4. Recent Developments
- 17.2.7.5. Financials (Based on Availability)
- 17.2.8 SIG Design and Technology (Part of SIG PLC)
- 17.2.8.1. Overview
- 17.2.8.2. Products
- 17.2.8.3. SWOT Analysis
- 17.2.8.4. Recent Developments
- 17.2.8.5. Financials (Based on Availability)
- 17.2.9 BASF SE
- 17.2.9.1. Overview
- 17.2.9.2. Products
- 17.2.9.3. SWOT Analysis
- 17.2.9.4. Recent Developments
- 17.2.9.5. Financials (Based on Availability)
- 17.2.10 Laydex
- 17.2.10.1. Overview
- 17.2.10.2. Products
- 17.2.10.3. SWOT Analysis
- 17.2.10.4. Recent Developments
- 17.2.10.5. Financials (Based on Availability)
- 17.2.11 GAF
- 17.2.11.1. Overview
- 17.2.11.2. Products
- 17.2.11.3. SWOT Analysis
- 17.2.11.4. Recent Developments
- 17.2.11.5. Financials (Based on Availability)
- 17.2.12 Sika AG
- 17.2.12.1. Overview
- 17.2.12.2. Products
- 17.2.12.3. SWOT Analysis
- 17.2.12.4. Recent Developments
- 17.2.12.5. Financials (Based on Availability)
- 17.2.13 Kemper System Ltd
- 17.2.13.1. Overview
- 17.2.13.2. Products
- 17.2.13.3. SWOT Analysis
- 17.2.13.4. Recent Developments
- 17.2.13.5. Financials (Based on Availability)
- 17.2.14 Saint-Gobain Weber
- 17.2.14.1. Overview
- 17.2.14.2. Products
- 17.2.14.3. SWOT Analysis
- 17.2.14.4. Recent Developments
- 17.2.14.5. Financials (Based on Availability)
- 17.2.1 Langley *List Not Exhaustive
List of Figures
- Figure 1: Global Liquid Roofing Market Revenue Breakdown (Million, %) by Region 2024 & 2032
- Figure 2: Global Liquid Roofing Market Volume Breakdown (liter , %) by Region 2024 & 2032
- Figure 3: North America Liquid Roofing Market Revenue (Million), by Country 2024 & 2032
- Figure 4: North America Liquid Roofing Market Volume (liter ), by Country 2024 & 2032
- Figure 5: North America Liquid Roofing Market Revenue Share (%), by Country 2024 & 2032
- Figure 6: North America Liquid Roofing Market Volume Share (%), by Country 2024 & 2032
- Figure 7: Europe Liquid Roofing Market Revenue (Million), by Country 2024 & 2032
- Figure 8: Europe Liquid Roofing Market Volume (liter ), by Country 2024 & 2032
- Figure 9: Europe Liquid Roofing Market Revenue Share (%), by Country 2024 & 2032
- Figure 10: Europe Liquid Roofing Market Volume Share (%), by Country 2024 & 2032
- Figure 11: Asia Pacific Liquid Roofing Market Revenue (Million), by Country 2024 & 2032
- Figure 12: Asia Pacific Liquid Roofing Market Volume (liter ), by Country 2024 & 2032
- Figure 13: Asia Pacific Liquid Roofing Market Revenue Share (%), by Country 2024 & 2032
- Figure 14: Asia Pacific Liquid Roofing Market Volume Share (%), by Country 2024 & 2032
- Figure 15: South America Liquid Roofing Market Revenue (Million), by Country 2024 & 2032
- Figure 16: South America Liquid Roofing Market Volume (liter ), by Country 2024 & 2032
- Figure 17: South America Liquid Roofing Market Revenue Share (%), by Country 2024 & 2032
- Figure 18: South America Liquid Roofing Market Volume Share (%), by Country 2024 & 2032
- Figure 19: North America Liquid Roofing Market Revenue (Million), by Country 2024 & 2032
- Figure 20: North America Liquid Roofing Market Volume (liter ), by Country 2024 & 2032
- Figure 21: North America Liquid Roofing Market Revenue Share (%), by Country 2024 & 2032
- Figure 22: North America Liquid Roofing Market Volume Share (%), by Country 2024 & 2032
- Figure 23: MEA Liquid Roofing Market Revenue (Million), by Country 2024 & 2032
- Figure 24: MEA Liquid Roofing Market Volume (liter ), by Country 2024 & 2032
- Figure 25: MEA Liquid Roofing Market Revenue Share (%), by Country 2024 & 2032
- Figure 26: MEA Liquid Roofing Market Volume Share (%), by Country 2024 & 2032
- Figure 27: Asia Pacific Liquid Roofing Market Revenue (Million), by Type 2024 & 2032
- Figure 28: Asia Pacific Liquid Roofing Market Volume (liter ), by Type 2024 & 2032
- Figure 29: Asia Pacific Liquid Roofing Market Revenue Share (%), by Type 2024 & 2032
- Figure 30: Asia Pacific Liquid Roofing Market Volume Share (%), by Type 2024 & 2032
- Figure 31: Asia Pacific Liquid Roofing Market Revenue (Million), by Application 2024 & 2032
- Figure 32: Asia Pacific Liquid Roofing Market Volume (liter ), by Application 2024 & 2032
- Figure 33: Asia Pacific Liquid Roofing Market Revenue Share (%), by Application 2024 & 2032
- Figure 34: Asia Pacific Liquid Roofing Market Volume Share (%), by Application 2024 & 2032
- Figure 35: Asia Pacific Liquid Roofing Market Revenue (Million), by End-user Industry 2024 & 2032
- Figure 36: Asia Pacific Liquid Roofing Market Volume (liter ), by End-user Industry 2024 & 2032
- Figure 37: Asia Pacific Liquid Roofing Market Revenue Share (%), by End-user Industry 2024 & 2032
- Figure 38: Asia Pacific Liquid Roofing Market Volume Share (%), by End-user Industry 2024 & 2032
- Figure 39: Asia Pacific Liquid Roofing Market Revenue (Million), by Country 2024 & 2032
- Figure 40: Asia Pacific Liquid Roofing Market Volume (liter ), by Country 2024 & 2032
- Figure 41: Asia Pacific Liquid Roofing Market Revenue Share (%), by Country 2024 & 2032
- Figure 42: Asia Pacific Liquid Roofing Market Volume Share (%), by Country 2024 & 2032
- Figure 43: North America Liquid Roofing Market Revenue (Million), by Type 2024 & 2032
- Figure 44: North America Liquid Roofing Market Volume (liter ), by Type 2024 & 2032
- Figure 45: North America Liquid Roofing Market Revenue Share (%), by Type 2024 & 2032
- Figure 46: North America Liquid Roofing Market Volume Share (%), by Type 2024 & 2032
- Figure 47: North America Liquid Roofing Market Revenue (Million), by Application 2024 & 2032
- Figure 48: North America Liquid Roofing Market Volume (liter ), by Application 2024 & 2032
- Figure 49: North America Liquid Roofing Market Revenue Share (%), by Application 2024 & 2032
- Figure 50: North America Liquid Roofing Market Volume Share (%), by Application 2024 & 2032
- Figure 51: North America Liquid Roofing Market Revenue (Million), by End-user Industry 2024 & 2032
- Figure 52: North America Liquid Roofing Market Volume (liter ), by End-user Industry 2024 & 2032
- Figure 53: North America Liquid Roofing Market Revenue Share (%), by End-user Industry 2024 & 2032
- Figure 54: North America Liquid Roofing Market Volume Share (%), by End-user Industry 2024 & 2032
- Figure 55: North America Liquid Roofing Market Revenue (Million), by Country 2024 & 2032
- Figure 56: North America Liquid Roofing Market Volume (liter ), by Country 2024 & 2032
- Figure 57: North America Liquid Roofing Market Revenue Share (%), by Country 2024 & 2032
- Figure 58: North America Liquid Roofing Market Volume Share (%), by Country 2024 & 2032
- Figure 59: Europe Liquid Roofing Market Revenue (Million), by Type 2024 & 2032
- Figure 60: Europe Liquid Roofing Market Volume (liter ), by Type 2024 & 2032
- Figure 61: Europe Liquid Roofing Market Revenue Share (%), by Type 2024 & 2032
- Figure 62: Europe Liquid Roofing Market Volume Share (%), by Type 2024 & 2032
- Figure 63: Europe Liquid Roofing Market Revenue (Million), by Application 2024 & 2032
- Figure 64: Europe Liquid Roofing Market Volume (liter ), by Application 2024 & 2032
- Figure 65: Europe Liquid Roofing Market Revenue Share (%), by Application 2024 & 2032
- Figure 66: Europe Liquid Roofing Market Volume Share (%), by Application 2024 & 2032
- Figure 67: Europe Liquid Roofing Market Revenue (Million), by End-user Industry 2024 & 2032
- Figure 68: Europe Liquid Roofing Market Volume (liter ), by End-user Industry 2024 & 2032
- Figure 69: Europe Liquid Roofing Market Revenue Share (%), by End-user Industry 2024 & 2032
- Figure 70: Europe Liquid Roofing Market Volume Share (%), by End-user Industry 2024 & 2032
- Figure 71: Europe Liquid Roofing Market Revenue (Million), by Country 2024 & 2032
- Figure 72: Europe Liquid Roofing Market Volume (liter ), by Country 2024 & 2032
- Figure 73: Europe Liquid Roofing Market Revenue Share (%), by Country 2024 & 2032
- Figure 74: Europe Liquid Roofing Market Volume Share (%), by Country 2024 & 2032
- Figure 75: South America Liquid Roofing Market Revenue (Million), by Type 2024 & 2032
- Figure 76: South America Liquid Roofing Market Volume (liter ), by Type 2024 & 2032
- Figure 77: South America Liquid Roofing Market Revenue Share (%), by Type 2024 & 2032
- Figure 78: South America Liquid Roofing Market Volume Share (%), by Type 2024 & 2032
- Figure 79: South America Liquid Roofing Market Revenue (Million), by Application 2024 & 2032
- Figure 80: South America Liquid Roofing Market Volume (liter ), by Application 2024 & 2032
- Figure 81: South America Liquid Roofing Market Revenue Share (%), by Application 2024 & 2032
- Figure 82: South America Liquid Roofing Market Volume Share (%), by Application 2024 & 2032
- Figure 83: South America Liquid Roofing Market Revenue (Million), by End-user Industry 2024 & 2032
- Figure 84: South America Liquid Roofing Market Volume (liter ), by End-user Industry 2024 & 2032
- Figure 85: South America Liquid Roofing Market Revenue Share (%), by End-user Industry 2024 & 2032
- Figure 86: South America Liquid Roofing Market Volume Share (%), by End-user Industry 2024 & 2032
- Figure 87: South America Liquid Roofing Market Revenue (Million), by Country 2024 & 2032
- Figure 88: South America Liquid Roofing Market Volume (liter ), by Country 2024 & 2032
- Figure 89: South America Liquid Roofing Market Revenue Share (%), by Country 2024 & 2032
- Figure 90: South America Liquid Roofing Market Volume Share (%), by Country 2024 & 2032
- Figure 91: Middle East and Africa Liquid Roofing Market Revenue (Million), by Type 2024 & 2032
- Figure 92: Middle East and Africa Liquid Roofing Market Volume (liter ), by Type 2024 & 2032
- Figure 93: Middle East and Africa Liquid Roofing Market Revenue Share (%), by Type 2024 & 2032
- Figure 94: Middle East and Africa Liquid Roofing Market Volume Share (%), by Type 2024 & 2032
- Figure 95: Middle East and Africa Liquid Roofing Market Revenue (Million), by Application 2024 & 2032
- Figure 96: Middle East and Africa Liquid Roofing Market Volume (liter ), by Application 2024 & 2032
- Figure 97: Middle East and Africa Liquid Roofing Market Revenue Share (%), by Application 2024 & 2032
- Figure 98: Middle East and Africa Liquid Roofing Market Volume Share (%), by Application 2024 & 2032
- Figure 99: Middle East and Africa Liquid Roofing Market Revenue (Million), by End-user Industry 2024 & 2032
- Figure 100: Middle East and Africa Liquid Roofing Market Volume (liter ), by End-user Industry 2024 & 2032
- Figure 101: Middle East and Africa Liquid Roofing Market Revenue Share (%), by End-user Industry 2024 & 2032
- Figure 102: Middle East and Africa Liquid Roofing Market Volume Share (%), by End-user Industry 2024 & 2032
- Figure 103: Middle East and Africa Liquid Roofing Market Revenue (Million), by Country 2024 & 2032
- Figure 104: Middle East and Africa Liquid Roofing Market Volume (liter ), by Country 2024 & 2032
- Figure 105: Middle East and Africa Liquid Roofing Market Revenue Share (%), by Country 2024 & 2032
- Figure 106: Middle East and Africa Liquid Roofing Market Volume Share (%), by Country 2024 & 2032
List of Tables
- Table 1: Global Liquid Roofing Market Revenue Million Forecast, by Region 2019 & 2032
- Table 2: Global Liquid Roofing Market Volume liter Forecast, by Region 2019 & 2032
- Table 3: Global Liquid Roofing Market Revenue Million Forecast, by Type 2019 & 2032
- Table 4: Global Liquid Roofing Market Volume liter Forecast, by Type 2019 & 2032
- Table 5: Global Liquid Roofing Market Revenue Million Forecast, by Application 2019 & 2032
- Table 6: Global Liquid Roofing Market Volume liter Forecast, by Application 2019 & 2032
- Table 7: Global Liquid Roofing Market Revenue Million Forecast, by End-user Industry 2019 & 2032
- Table 8: Global Liquid Roofing Market Volume liter Forecast, by End-user Industry 2019 & 2032
- Table 9: Global Liquid Roofing Market Revenue Million Forecast, by Region 2019 & 2032
- Table 10: Global Liquid Roofing Market Volume liter Forecast, by Region 2019 & 2032
- Table 11: Global Liquid Roofing Market Revenue Million Forecast, by Country 2019 & 2032
- Table 12: Global Liquid Roofing Market Volume liter Forecast, by Country 2019 & 2032
- Table 13: United States Liquid Roofing Market Revenue (Million) Forecast, by Application 2019 & 2032
- Table 14: United States Liquid Roofing Market Volume (liter ) Forecast, by Application 2019 & 2032
- Table 15: Canada Liquid Roofing Market Revenue (Million) Forecast, by Application 2019 & 2032
- Table 16: Canada Liquid Roofing Market Volume (liter ) Forecast, by Application 2019 & 2032
- Table 17: Mexico Liquid Roofing Market Revenue (Million) Forecast, by Application 2019 & 2032
- Table 18: Mexico Liquid Roofing Market Volume (liter ) Forecast, by Application 2019 & 2032
- Table 19: Global Liquid Roofing Market Revenue Million Forecast, by Country 2019 & 2032
- Table 20: Global Liquid Roofing Market Volume liter Forecast, by Country 2019 & 2032
- Table 21: Germany Liquid Roofing Market Revenue (Million) Forecast, by Application 2019 & 2032
- Table 22: Germany Liquid Roofing Market Volume (liter ) Forecast, by Application 2019 & 2032
- Table 23: United Kingdom Liquid Roofing Market Revenue (Million) Forecast, by Application 2019 & 2032
- Table 24: United Kingdom Liquid Roofing Market Volume (liter ) Forecast, by Application 2019 & 2032
- Table 25: France Liquid Roofing Market Revenue (Million) Forecast, by Application 2019 & 2032
- Table 26: France Liquid Roofing Market Volume (liter ) Forecast, by Application 2019 & 2032
- Table 27: Spain Liquid Roofing Market Revenue (Million) Forecast, by Application 2019 & 2032
- Table 28: Spain Liquid Roofing Market Volume (liter ) Forecast, by Application 2019 & 2032
- Table 29: Italy Liquid Roofing Market Revenue (Million) Forecast, by Application 2019 & 2032
- Table 30: Italy Liquid Roofing Market Volume (liter ) Forecast, by Application 2019 & 2032
- Table 31: Spain Liquid Roofing Market Revenue (Million) Forecast, by Application 2019 & 2032
- Table 32: Spain Liquid Roofing Market Volume (liter ) Forecast, by Application 2019 & 2032
- Table 33: Belgium Liquid Roofing Market Revenue (Million) Forecast, by Application 2019 & 2032
- Table 34: Belgium Liquid Roofing Market Volume (liter ) Forecast, by Application 2019 & 2032
- Table 35: Netherland Liquid Roofing Market Revenue (Million) Forecast, by Application 2019 & 2032
- Table 36: Netherland Liquid Roofing Market Volume (liter ) Forecast, by Application 2019 & 2032
- Table 37: Nordics Liquid Roofing Market Revenue (Million) Forecast, by Application 2019 & 2032
- Table 38: Nordics Liquid Roofing Market Volume (liter ) Forecast, by Application 2019 & 2032
- Table 39: Rest of Europe Liquid Roofing Market Revenue (Million) Forecast, by Application 2019 & 2032
- Table 40: Rest of Europe Liquid Roofing Market Volume (liter ) Forecast, by Application 2019 & 2032
- Table 41: Global Liquid Roofing Market Revenue Million Forecast, by Country 2019 & 2032
- Table 42: Global Liquid Roofing Market Volume liter Forecast, by Country 2019 & 2032
- Table 43: China Liquid Roofing Market Revenue (Million) Forecast, by Application 2019 & 2032
- Table 44: China Liquid Roofing Market Volume (liter ) Forecast, by Application 2019 & 2032
- Table 45: Japan Liquid Roofing Market Revenue (Million) Forecast, by Application 2019 & 2032
- Table 46: Japan Liquid Roofing Market Volume (liter ) Forecast, by Application 2019 & 2032
- Table 47: India Liquid Roofing Market Revenue (Million) Forecast, by Application 2019 & 2032
- Table 48: India Liquid Roofing Market Volume (liter ) Forecast, by Application 2019 & 2032
- Table 49: South Korea Liquid Roofing Market Revenue (Million) Forecast, by Application 2019 & 2032
- Table 50: South Korea Liquid Roofing Market Volume (liter ) Forecast, by Application 2019 & 2032
- Table 51: Southeast Asia Liquid Roofing Market Revenue (Million) Forecast, by Application 2019 & 2032
- Table 52: Southeast Asia Liquid Roofing Market Volume (liter ) Forecast, by Application 2019 & 2032
- Table 53: Australia Liquid Roofing Market Revenue (Million) Forecast, by Application 2019 & 2032
- Table 54: Australia Liquid Roofing Market Volume (liter ) Forecast, by Application 2019 & 2032
- Table 55: Indonesia Liquid Roofing Market Revenue (Million) Forecast, by Application 2019 & 2032
- Table 56: Indonesia Liquid Roofing Market Volume (liter ) Forecast, by Application 2019 & 2032
- Table 57: Phillipes Liquid Roofing Market Revenue (Million) Forecast, by Application 2019 & 2032
- Table 58: Phillipes Liquid Roofing Market Volume (liter ) Forecast, by Application 2019 & 2032
- Table 59: Singapore Liquid Roofing Market Revenue (Million) Forecast, by Application 2019 & 2032
- Table 60: Singapore Liquid Roofing Market Volume (liter ) Forecast, by Application 2019 & 2032
- Table 61: Thailandc Liquid Roofing Market Revenue (Million) Forecast, by Application 2019 & 2032
- Table 62: Thailandc Liquid Roofing Market Volume (liter ) Forecast, by Application 2019 & 2032
- Table 63: Rest of Asia Pacific Liquid Roofing Market Revenue (Million) Forecast, by Application 2019 & 2032
- Table 64: Rest of Asia Pacific Liquid Roofing Market Volume (liter ) Forecast, by Application 2019 & 2032
- Table 65: Global Liquid Roofing Market Revenue Million Forecast, by Country 2019 & 2032
- Table 66: Global Liquid Roofing Market Volume liter Forecast, by Country 2019 & 2032
- Table 67: Brazil Liquid Roofing Market Revenue (Million) Forecast, by Application 2019 & 2032
- Table 68: Brazil Liquid Roofing Market Volume (liter ) Forecast, by Application 2019 & 2032
- Table 69: Argentina Liquid Roofing Market Revenue (Million) Forecast, by Application 2019 & 2032
- Table 70: Argentina Liquid Roofing Market Volume (liter ) Forecast, by Application 2019 & 2032
- Table 71: Peru Liquid Roofing Market Revenue (Million) Forecast, by Application 2019 & 2032
- Table 72: Peru Liquid Roofing Market Volume (liter ) Forecast, by Application 2019 & 2032
- Table 73: Chile Liquid Roofing Market Revenue (Million) Forecast, by Application 2019 & 2032
- Table 74: Chile Liquid Roofing Market Volume (liter ) Forecast, by Application 2019 & 2032
- Table 75: Colombia Liquid Roofing Market Revenue (Million) Forecast, by Application 2019 & 2032
- Table 76: Colombia Liquid Roofing Market Volume (liter ) Forecast, by Application 2019 & 2032
- Table 77: Ecuador Liquid Roofing Market Revenue (Million) Forecast, by Application 2019 & 2032
- Table 78: Ecuador Liquid Roofing Market Volume (liter ) Forecast, by Application 2019 & 2032
- Table 79: Venezuela Liquid Roofing Market Revenue (Million) Forecast, by Application 2019 & 2032
- Table 80: Venezuela Liquid Roofing Market Volume (liter ) Forecast, by Application 2019 & 2032
- Table 81: Rest of South America Liquid Roofing Market Revenue (Million) Forecast, by Application 2019 & 2032
- Table 82: Rest of South America Liquid Roofing Market Volume (liter ) Forecast, by Application 2019 & 2032
- Table 83: Global Liquid Roofing Market Revenue Million Forecast, by Country 2019 & 2032
- Table 84: Global Liquid Roofing Market Volume liter Forecast, by Country 2019 & 2032
- Table 85: United States Liquid Roofing Market Revenue (Million) Forecast, by Application 2019 & 2032
- Table 86: United States Liquid Roofing Market Volume (liter ) Forecast, by Application 2019 & 2032
- Table 87: Canada Liquid Roofing Market Revenue (Million) Forecast, by Application 2019 & 2032
- Table 88: Canada Liquid Roofing Market Volume (liter ) Forecast, by Application 2019 & 2032
- Table 89: Mexico Liquid Roofing Market Revenue (Million) Forecast, by Application 2019 & 2032
- Table 90: Mexico Liquid Roofing Market Volume (liter ) Forecast, by Application 2019 & 2032
- Table 91: Global Liquid Roofing Market Revenue Million Forecast, by Country 2019 & 2032
- Table 92: Global Liquid Roofing Market Volume liter Forecast, by Country 2019 & 2032
- Table 93: United Arab Emirates Liquid Roofing Market Revenue (Million) Forecast, by Application 2019 & 2032
- Table 94: United Arab Emirates Liquid Roofing Market Volume (liter ) Forecast, by Application 2019 & 2032
- Table 95: Saudi Arabia Liquid Roofing Market Revenue (Million) Forecast, by Application 2019 & 2032
- Table 96: Saudi Arabia Liquid Roofing Market Volume (liter ) Forecast, by Application 2019 & 2032
- Table 97: South Africa Liquid Roofing Market Revenue (Million) Forecast, by Application 2019 & 2032
- Table 98: South Africa Liquid Roofing Market Volume (liter ) Forecast, by Application 2019 & 2032
- Table 99: Rest of Middle East and Africa Liquid Roofing Market Revenue (Million) Forecast, by Application 2019 & 2032
- Table 100: Rest of Middle East and Africa Liquid Roofing Market Volume (liter ) Forecast, by Application 2019 & 2032
- Table 101: Global Liquid Roofing Market Revenue Million Forecast, by Type 2019 & 2032
- Table 102: Global Liquid Roofing Market Volume liter Forecast, by Type 2019 & 2032
- Table 103: Global Liquid Roofing Market Revenue Million Forecast, by Application 2019 & 2032
- Table 104: Global Liquid Roofing Market Volume liter Forecast, by Application 2019 & 2032
- Table 105: Global Liquid Roofing Market Revenue Million Forecast, by End-user Industry 2019 & 2032
- Table 106: Global Liquid Roofing Market Volume liter Forecast, by End-user Industry 2019 & 2032
- Table 107: Global Liquid Roofing Market Revenue Million Forecast, by Country 2019 & 2032
- Table 108: Global Liquid Roofing Market Volume liter Forecast, by Country 2019 & 2032
- Table 109: China Liquid Roofing Market Revenue (Million) Forecast, by Application 2019 & 2032
- Table 110: China Liquid Roofing Market Volume (liter ) Forecast, by Application 2019 & 2032
- Table 111: India Liquid Roofing Market Revenue (Million) Forecast, by Application 2019 & 2032
- Table 112: India Liquid Roofing Market Volume (liter ) Forecast, by Application 2019 & 2032
- Table 113: Japan Liquid Roofing Market Revenue (Million) Forecast, by Application 2019 & 2032
- Table 114: Japan Liquid Roofing Market Volume (liter ) Forecast, by Application 2019 & 2032
- Table 115: South Korea Liquid Roofing Market Revenue (Million) Forecast, by Application 2019 & 2032
- Table 116: South Korea Liquid Roofing Market Volume (liter ) Forecast, by Application 2019 & 2032
- Table 117: Malaysia Liquid Roofing Market Revenue (Million) Forecast, by Application 2019 & 2032
- Table 118: Malaysia Liquid Roofing Market Volume (liter ) Forecast, by Application 2019 & 2032
- Table 119: Thailand Liquid Roofing Market Revenue (Million) Forecast, by Application 2019 & 2032
- Table 120: Thailand Liquid Roofing Market Volume (liter ) Forecast, by Application 2019 & 2032
- Table 121: Indonesia Liquid Roofing Market Revenue (Million) Forecast, by Application 2019 & 2032
- Table 122: Indonesia Liquid Roofing Market Volume (liter ) Forecast, by Application 2019 & 2032
- Table 123: Vietnam Liquid Roofing Market Revenue (Million) Forecast, by Application 2019 & 2032
- Table 124: Vietnam Liquid Roofing Market Volume (liter ) Forecast, by Application 2019 & 2032
- Table 125: Rest of Asia Pacific Liquid Roofing Market Revenue (Million) Forecast, by Application 2019 & 2032
- Table 126: Rest of Asia Pacific Liquid Roofing Market Volume (liter ) Forecast, by Application 2019 & 2032
- Table 127: Global Liquid Roofing Market Revenue Million Forecast, by Type 2019 & 2032
- Table 128: Global Liquid Roofing Market Volume liter Forecast, by Type 2019 & 2032
- Table 129: Global Liquid Roofing Market Revenue Million Forecast, by Application 2019 & 2032
- Table 130: Global Liquid Roofing Market Volume liter Forecast, by Application 2019 & 2032
- Table 131: Global Liquid Roofing Market Revenue Million Forecast, by End-user Industry 2019 & 2032
- Table 132: Global Liquid Roofing Market Volume liter Forecast, by End-user Industry 2019 & 2032
- Table 133: Global Liquid Roofing Market Revenue Million Forecast, by Country 2019 & 2032
- Table 134: Global Liquid Roofing Market Volume liter Forecast, by Country 2019 & 2032
- Table 135: United States Liquid Roofing Market Revenue (Million) Forecast, by Application 2019 & 2032
- Table 136: United States Liquid Roofing Market Volume (liter ) Forecast, by Application 2019 & 2032
- Table 137: Canada Liquid Roofing Market Revenue (Million) Forecast, by Application 2019 & 2032
- Table 138: Canada Liquid Roofing Market Volume (liter ) Forecast, by Application 2019 & 2032
- Table 139: Mexico Liquid Roofing Market Revenue (Million) Forecast, by Application 2019 & 2032
- Table 140: Mexico Liquid Roofing Market Volume (liter ) Forecast, by Application 2019 & 2032
- Table 141: Global Liquid Roofing Market Revenue Million Forecast, by Type 2019 & 2032
- Table 142: Global Liquid Roofing Market Volume liter Forecast, by Type 2019 & 2032
- Table 143: Global Liquid Roofing Market Revenue Million Forecast, by Application 2019 & 2032
- Table 144: Global Liquid Roofing Market Volume liter Forecast, by Application 2019 & 2032
- Table 145: Global Liquid Roofing Market Revenue Million Forecast, by End-user Industry 2019 & 2032
- Table 146: Global Liquid Roofing Market Volume liter Forecast, by End-user Industry 2019 & 2032
- Table 147: Global Liquid Roofing Market Revenue Million Forecast, by Country 2019 & 2032
- Table 148: Global Liquid Roofing Market Volume liter Forecast, by Country 2019 & 2032
- Table 149: Germany Liquid Roofing Market Revenue (Million) Forecast, by Application 2019 & 2032
- Table 150: Germany Liquid Roofing Market Volume (liter ) Forecast, by Application 2019 & 2032
- Table 151: United Kingdom Liquid Roofing Market Revenue (Million) Forecast, by Application 2019 & 2032
- Table 152: United Kingdom Liquid Roofing Market Volume (liter ) Forecast, by Application 2019 & 2032
- Table 153: France Liquid Roofing Market Revenue (Million) Forecast, by Application 2019 & 2032
- Table 154: France Liquid Roofing Market Volume (liter ) Forecast, by Application 2019 & 2032
- Table 155: Italy Liquid Roofing Market Revenue (Million) Forecast, by Application 2019 & 2032
- Table 156: Italy Liquid Roofing Market Volume (liter ) Forecast, by Application 2019 & 2032
- Table 157: Spain Liquid Roofing Market Revenue (Million) Forecast, by Application 2019 & 2032
- Table 158: Spain Liquid Roofing Market Volume (liter ) Forecast, by Application 2019 & 2032
- Table 159: NORDIC Liquid Roofing Market Revenue (Million) Forecast, by Application 2019 & 2032
- Table 160: NORDIC Liquid Roofing Market Volume (liter ) Forecast, by Application 2019 & 2032
- Table 161: Turkey Liquid Roofing Market Revenue (Million) Forecast, by Application 2019 & 2032
- Table 162: Turkey Liquid Roofing Market Volume (liter ) Forecast, by Application 2019 & 2032
- Table 163: Russia Liquid Roofing Market Revenue (Million) Forecast, by Application 2019 & 2032
- Table 164: Russia Liquid Roofing Market Volume (liter ) Forecast, by Application 2019 & 2032
- Table 165: Rest of Europe Liquid Roofing Market Revenue (Million) Forecast, by Application 2019 & 2032
- Table 166: Rest of Europe Liquid Roofing Market Volume (liter ) Forecast, by Application 2019 & 2032
- Table 167: Global Liquid Roofing Market Revenue Million Forecast, by Type 2019 & 2032
- Table 168: Global Liquid Roofing Market Volume liter Forecast, by Type 2019 & 2032
- Table 169: Global Liquid Roofing Market Revenue Million Forecast, by Application 2019 & 2032
- Table 170: Global Liquid Roofing Market Volume liter Forecast, by Application 2019 & 2032
- Table 171: Global Liquid Roofing Market Revenue Million Forecast, by End-user Industry 2019 & 2032
- Table 172: Global Liquid Roofing Market Volume liter Forecast, by End-user Industry 2019 & 2032
- Table 173: Global Liquid Roofing Market Revenue Million Forecast, by Country 2019 & 2032
- Table 174: Global Liquid Roofing Market Volume liter Forecast, by Country 2019 & 2032
- Table 175: Brazil Liquid Roofing Market Revenue (Million) Forecast, by Application 2019 & 2032
- Table 176: Brazil Liquid Roofing Market Volume (liter ) Forecast, by Application 2019 & 2032
- Table 177: Argentina Liquid Roofing Market Revenue (Million) Forecast, by Application 2019 & 2032
- Table 178: Argentina Liquid Roofing Market Volume (liter ) Forecast, by Application 2019 & 2032
- Table 179: Colombia Liquid Roofing Market Revenue (Million) Forecast, by Application 2019 & 2032
- Table 180: Colombia Liquid Roofing Market Volume (liter ) Forecast, by Application 2019 & 2032
- Table 181: Rest of South America Liquid Roofing Market Revenue (Million) Forecast, by Application 2019 & 2032
- Table 182: Rest of South America Liquid Roofing Market Volume (liter ) Forecast, by Application 2019 & 2032
- Table 183: Global Liquid Roofing Market Revenue Million Forecast, by Type 2019 & 2032
- Table 184: Global Liquid Roofing Market Volume liter Forecast, by Type 2019 & 2032
- Table 185: Global Liquid Roofing Market Revenue Million Forecast, by Application 2019 & 2032
- Table 186: Global Liquid Roofing Market Volume liter Forecast, by Application 2019 & 2032
- Table 187: Global Liquid Roofing Market Revenue Million Forecast, by End-user Industry 2019 & 2032
- Table 188: Global Liquid Roofing Market Volume liter Forecast, by End-user Industry 2019 & 2032
- Table 189: Global Liquid Roofing Market Revenue Million Forecast, by Country 2019 & 2032
- Table 190: Global Liquid Roofing Market Volume liter Forecast, by Country 2019 & 2032
- Table 191: Saudi Arabia Liquid Roofing Market Revenue (Million) Forecast, by Application 2019 & 2032
- Table 192: Saudi Arabia Liquid Roofing Market Volume (liter ) Forecast, by Application 2019 & 2032
- Table 193: South Africa Liquid Roofing Market Revenue (Million) Forecast, by Application 2019 & 2032
- Table 194: South Africa Liquid Roofing Market Volume (liter ) Forecast, by Application 2019 & 2032
- Table 195: Nigeria Liquid Roofing Market Revenue (Million) Forecast, by Application 2019 & 2032
- Table 196: Nigeria Liquid Roofing Market Volume (liter ) Forecast, by Application 2019 & 2032
- Table 197: Qatar Liquid Roofing Market Revenue (Million) Forecast, by Application 2019 & 2032
- Table 198: Qatar Liquid Roofing Market Volume (liter ) Forecast, by Application 2019 & 2032
- Table 199: Egypt Liquid Roofing Market Revenue (Million) Forecast, by Application 2019 & 2032
- Table 200: Egypt Liquid Roofing Market Volume (liter ) Forecast, by Application 2019 & 2032
- Table 201: UAE Liquid Roofing Market Revenue (Million) Forecast, by Application 2019 & 2032
- Table 202: UAE Liquid Roofing Market Volume (liter ) Forecast, by Application 2019 & 2032
- Table 203: Rest of Middle East and Africa Liquid Roofing Market Revenue (Million) Forecast, by Application 2019 & 2032
- Table 204: Rest of Middle East and Africa Liquid Roofing Market Volume (liter ) Forecast, by Application 2019 & 2032
Frequently Asked Questions
1. What is the projected Compound Annual Growth Rate (CAGR) of the Liquid Roofing Market?
The projected CAGR is approximately > 4.00%.
2. Which companies are prominent players in the Liquid Roofing Market?
Key companies in the market include Langley *List Not Exhaustive, Johns Manville (A Berkshire Hathaway Company), GreenShield, BMI UK & Ireland, Akzo Nobel NV, Alumasc Building Products, Liquid Roofing Systems LTD, SIG Design and Technology (Part of SIG PLC), BASF SE, Laydex, GAF, Sika AG, Kemper System Ltd, Saint-Gobain Weber.
3. What are the main segments of the Liquid Roofing Market?
The market segments include Type, Application, End-user Industry.
4. Can you provide details about the market size?
The market size is estimated to be USD 7960 Million as of 2022.
5. What are some drivers contributing to market growth?
Growing Residential Segment; Increasing Consumer Awareness for Liquid Roofing; Other Drivers.
6. What are the notable trends driving market growth?
Residential Segment to Dominate the Market.
7. Are there any restraints impacting market growth?
Unfavorable Conditions Arising Due to COVID-19 Outbreak; Other Restraints.
8. Can you provide examples of recent developments in the market?
Oct 2023: Langley introduced a new Langley PU Liquid Waterproofing system, which allows the application of a 25-year system in just two coats. This significantly decreases install time compared to many other liquids in the market where a three-coat system is required.
9. What pricing options are available for accessing the report?
Pricing options include single-user, multi-user, and enterprise licenses priced at USD 4750, USD 5250, and USD 8750 respectively.
10. Is the market size provided in terms of value or volume?
The market size is provided in terms of value, measured in Million and volume, measured in liter .
11. Are there any specific market keywords associated with the report?
Yes, the market keyword associated with the report is "Liquid Roofing Market," which aids in identifying and referencing the specific market segment covered.
12. How do I determine which pricing option suits my needs best?
The pricing options vary based on user requirements and access needs. Individual users may opt for single-user licenses, while businesses requiring broader access may choose multi-user or enterprise licenses for cost-effective access to the report.
13. Are there any additional resources or data provided in the Liquid Roofing Market report?
While the report offers comprehensive insights, it's advisable to review the specific contents or supplementary materials provided to ascertain if additional resources or data are available.
14. How can I stay updated on further developments or reports in the Liquid Roofing Market?
To stay informed about further developments, trends, and reports in the Liquid Roofing Market, consider subscribing to industry newsletters, following relevant companies and organizations, or regularly checking reputable industry news sources and publications.
Methodology
Step 1 - Identification of Relevant Samples Size from Population Database


Step 2 - Approaches for Defining Global Market Size (Value, Volume* & Price*)

Note*: In applicable scenarios
Step 3 - Data Sources
Primary Research
- Web Analytics
- Survey Reports
- Research Institute
- Latest Research Reports
- Opinion Leaders
Secondary Research
- Annual Reports
- White Paper
- Latest Press Release
- Industry Association
- Paid Database
- Investor Presentations

Step 4 - Data Triangulation
Involves using different sources of information in order to increase the validity of a study
These sources are likely to be stakeholders in a program - participants, other researchers, program staff, other community members, and so on.
Then we put all data in single framework & apply various statistical tools to find out the dynamic on the market.
During the analysis stage, feedback from the stakeholder groups would be compared to determine areas of agreement as well as areas of divergence


