
Key Insights
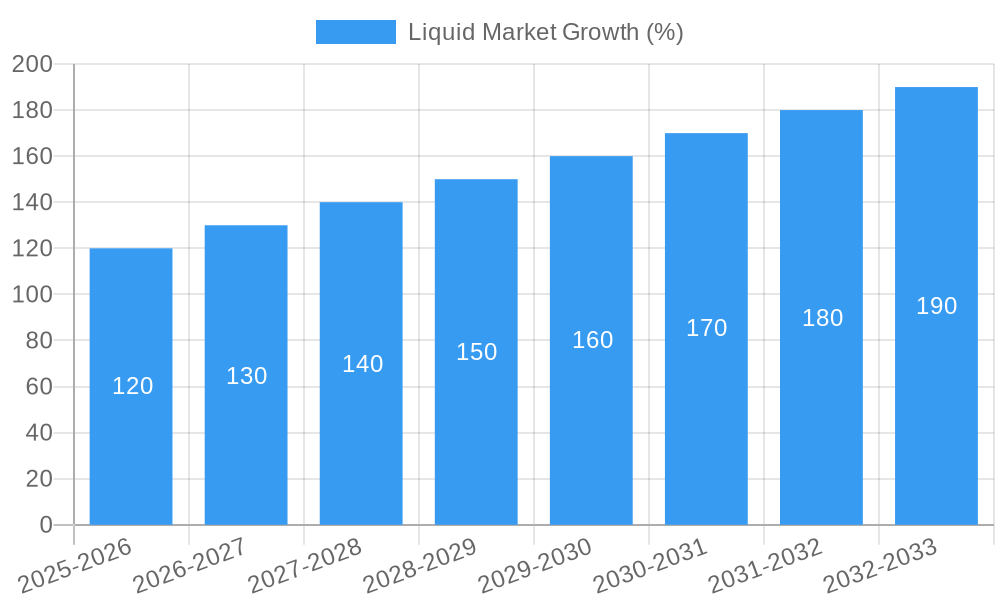
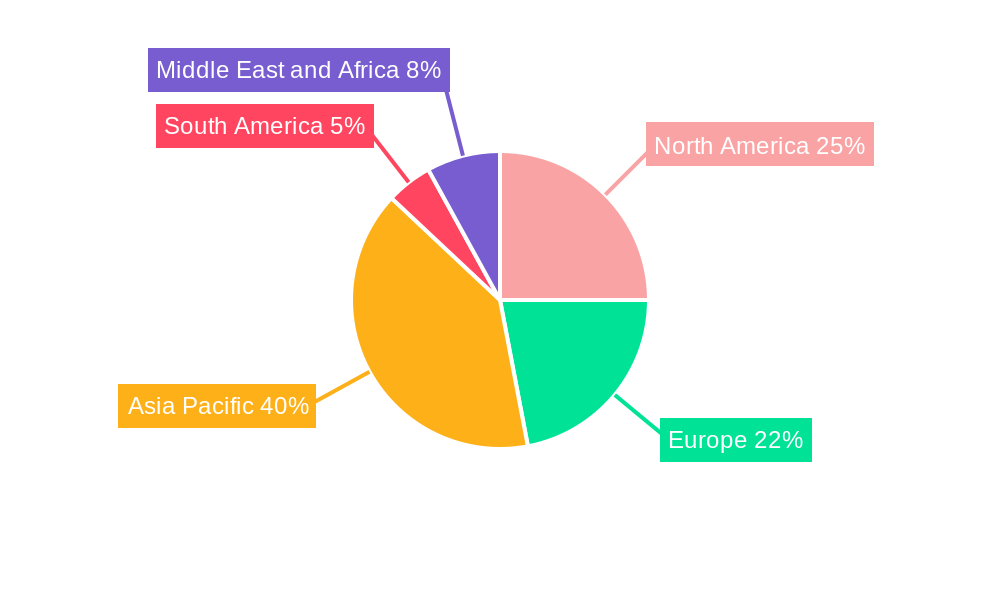
The global ionic liquids market is experiencing robust growth, projected to maintain a Compound Annual Growth Rate (CAGR) exceeding 8% from 2025 to 2033. This expansion is driven by increasing demand across diverse sectors, particularly in the solvents & catalysts, process & operating fluids, and energy storage applications. The rising adoption of sustainable and environmentally friendly chemical processes is a key factor fueling market growth. The Asia-Pacific region, especially China and India, represents a significant market share due to rapid industrialization and expanding chemical production capacities. Innovation in ionic liquid design and synthesis, coupled with advancements in their application within emerging technologies like bio-refineries, are further contributing to the market's upward trajectory. However, challenges such as high production costs and potential toxicity of certain ionic liquids pose some restraints to market growth. Nevertheless, ongoing research and development efforts aimed at improving cost-effectiveness and safety profiles are expected to mitigate these challenges and maintain strong market momentum.
The market segmentation reveals a diverse landscape, with solvents & catalysts currently dominating the application segment, reflecting the established use of ionic liquids as efficient and selective catalysts in various chemical reactions. The plastics industry is another significant consumer, leveraging the unique properties of ionic liquids in polymer processing. The energy storage sector is emerging as a key growth driver, with research focusing on ionic liquids for enhanced battery performance and lifespan. Key players like BASF, Solvay, and Tokyo Chemical Industry are investing heavily in research, development, and commercialization efforts, contributing to market competitiveness and innovation. The geographical distribution of market share reflects the established industrial bases and emerging economies, indicating a promising outlook for the ionic liquids market across various regions, even those outside of the high-growth Asia-Pacific region.
Liquid Market: A Comprehensive Analysis and Forecast (2019-2033)
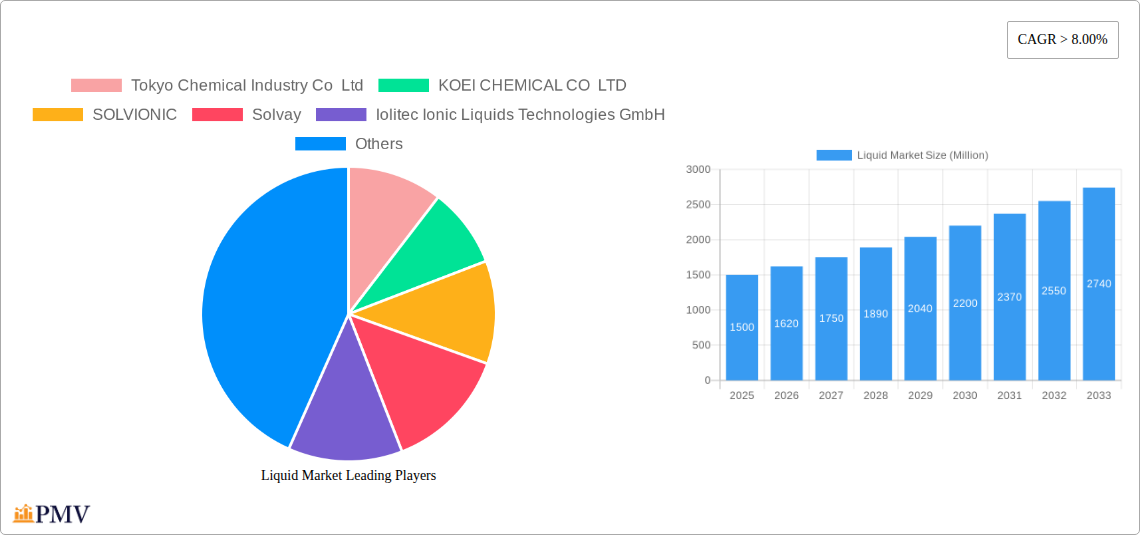
This comprehensive report provides an in-depth analysis of the global Liquid Market, offering invaluable insights for stakeholders seeking to navigate this dynamic sector. The report covers the period from 2019 to 2033, with a focus on the forecast period 2025-2033 and a base year of 2025. The market is segmented by application, encompassing Solvents & Catalysts, Process & Operating Fluids, Plastics, Energy Storage, Bio-Refineries, and Others. Leading players like Tokyo Chemical Industry Co Ltd, KOEI CHEMICAL CO LTD, SOLVIONIC, Solvay, Iolitec Ionic Liquids Technologies GmbH, Ottokemi, BASF SE, Kumidas SA, TCI America, and Reinste are analyzed in detail. The report projects a market value exceeding xx Million by 2033.
Liquid Market Market Structure & Competitive Dynamics
The Liquid Market exhibits a moderately concentrated structure, with a few major players holding significant market share. The combined market share of the top five companies is estimated to be around xx%, as of 2025. However, a vibrant ecosystem of smaller companies and startups is driving innovation, particularly in niche applications like bio-refineries and energy storage. The market is subject to stringent regulatory frameworks concerning environmental impact and safety, creating a barrier to entry for new players. Product substitutes, such as conventional solvents, pose a competitive threat, although ionic liquids' unique properties often provide a compelling advantage. Significant M&A activity has been observed in the past five years, with deal values exceeding xx Million in total. End-user trends towards sustainability and cost-effectiveness are reshaping the market landscape.
- Market Concentration: High, with top 5 companies holding xx% market share (2025).
- Innovation Ecosystem: Dynamic, with both established players and startups contributing to technological advancements.
- Regulatory Frameworks: Stringent, focusing on safety and environmental impact.
- Product Substitutes: Conventional solvents pose a competitive threat.
- M&A Activity: Significant, with over xx Million in deals (2019-2024).
- End-User Trends: Sustainability and cost-effectiveness are driving demand.
Liquid Market Industry Trends & Insights
The Liquid Market is experiencing robust growth, driven by several key factors. The rising demand for sustainable and efficient solutions across various industries, particularly in the chemical processing and energy sectors, is a major driver. Technological advancements in ionic liquid synthesis and characterization are enabling the development of novel applications, expanding the market potential. Consumer preferences are increasingly shifting towards environmentally friendly alternatives, further bolstering market growth. Competitive dynamics are shaped by ongoing innovation, strategic partnerships, and the continuous development of more efficient and cost-effective production processes. The Compound Annual Growth Rate (CAGR) is projected at xx% during the forecast period (2025-2033), with market penetration expected to reach xx% by 2033 in key segments.
Dominant Markets & Segments in Liquid Market
The Solvents & Catalysts segment currently dominates the Liquid Market, accounting for approximately xx% of the total market value in 2025. This is driven by the growing demand for high-performance solvents in various chemical processes. Asia-Pacific is the leading region, owing to robust economic growth, expanding industrialization, and increasing government support for green technologies.
- Key Drivers for Solvents & Catalysts Dominance:
- Growing demand for efficient and selective catalysts in chemical synthesis.
- Increasing adoption of green chemistry principles in industrial processes.
- Rising demand for high-performance solvents in various applications.
- Key Drivers for Asia-Pacific Regional Dominance:
- Rapid industrialization and economic growth.
- Favorable government policies promoting sustainable technologies.
- Significant investments in chemical manufacturing infrastructure.
Liquid Market Product Innovations
Recent product innovations focus on developing ionic liquids with enhanced properties, such as improved thermal stability, broader application range, and reduced toxicity. These advancements are addressing limitations of existing technologies and driving adoption in new applications, including bio-refineries and next-generation energy storage systems. Companies are investing heavily in research and development to improve the cost-effectiveness and scalability of ionic liquid production, enhancing their competitive advantages in the market.
Report Segmentation & Scope
The report segments the Liquid Market by application:
- Solvents & Catalysts: This segment is expected to experience significant growth driven by the increasing demand for sustainable solvents and catalysts in various industries.
- Process & Operating Fluids: This segment is projected to grow steadily due to the use of ionic liquids as heat transfer fluids and lubricants.
- Plastics: This segment shows potential growth, although adoption is still at early stages.
- Energy Storage: This emerging segment is expected to witness rapid growth, driven by the demand for advanced energy storage solutions.
- Bio-Refineries: This segment holds promising growth potential as the need for environmentally friendly biofuel production increases.
- Others: This segment includes various niche applications of ionic liquids.
Each segment's growth projection, market size, and competitive dynamics are detailed within the report.
Key Drivers of Liquid Market Growth
Several factors are driving the growth of the Liquid Market. Technological advancements leading to more efficient and cost-effective production methods are crucial. Stringent environmental regulations promoting sustainable alternatives are also key. Finally, the increasing demand from diverse industrial sectors, particularly chemicals, energy, and plastics, is further accelerating market expansion.
Challenges in the Liquid Market Sector
High production costs and limited scalability pose significant challenges. The availability of raw materials and the complexity of synthesis processes impact profitability. Competition from traditional solvents and regulatory hurdles concerning safety and environmental impacts also present obstacles to market expansion. These challenges are projected to limit market growth by approximately xx% in the next five years.
Leading Players in the Liquid Market Market
- Tokyo Chemical Industry Co Ltd
- KOEI CHEMICAL CO LTD
- SOLVIONIC
- Solvay
- Iolitec Ionic Liquids Technologies GmbH
- Ottokemi
- BASF SE
- Kumidas SA
- TCI America
- Reinste
Key Developments in Liquid Market Sector
- 2022-Q4: Solvay launched a new range of sustainable ionic liquids.
- 2023-Q1: BASF announced a significant investment in ionic liquid production capacity.
- 2023-Q2: A strategic partnership was formed between Tokyo Chemical Industry and a leading renewable energy company. (Further details available in the report)
Strategic Liquid Market Market Outlook
The Liquid Market is poised for significant growth, driven by ongoing technological advancements and increasing demand across various sectors. Strategic opportunities exist for companies to expand into new applications and develop innovative products with enhanced properties. Focus on sustainability and cost-effectiveness will be crucial for success in this dynamic market. The market is expected to continue its expansion, fueled by technological breakthroughs and the growing awareness of the environmental benefits of ionic liquids.
Liquid Market Segmentation
-
1. Application
- 1.1. Solvents & Catalysts
- 1.2. Process & Operating Fluids
- 1.3. Plastics
- 1.4. Energy Storage
- 1.5. Bio-Refineries
- 1.6. Others
Liquid Market Segmentation By Geography
-
1. Asia Pacific
- 1.1. China
- 1.2. India
- 1.3. Japan
- 1.4. South Korea
- 1.5. Rest of Asia Pacific
-
2. North America
- 2.1. United States
- 2.2. Canada
- 2.3. Mexico
-
3. Europe
- 3.1. Germany
- 3.2. United Kingdom
- 3.3. France
- 3.4. Italy
- 3.5. Rest of Europe
-
4. South America
- 4.1. Brazil
- 4.2. Argentina
- 4.3. Rest of South America
-
5. Middle East and Africa
- 5.1. Saudi Arabia
- 5.2. South Africa
- 5.3. Rest of Middle East and Africa
Liquid Market REPORT HIGHLIGHTS
| Aspects | Details |
|---|---|
| Study Period | 2019-2033 |
| Base Year | 2024 |
| Estimated Year | 2025 |
| Forecast Period | 2025-2033 |
| Historical Period | 2019-2024 |
| Growth Rate | CAGR of > 8.00% from 2019-2033 |
| Segmentation |
|
Table of Contents
- 1. Introduction
- 1.1. Research Scope
- 1.2. Market Segmentation
- 1.3. Research Methodology
- 1.4. Definitions and Assumptions
- 2. Executive Summary
- 2.1. Introduction
- 3. Market Dynamics
- 3.1. Introduction
- 3.2. Market Drivers
- 3.2.1. ; Increasing Use of Ionic Liquid as Industrial Solvents; Growing Consumption of Batteries
- 3.3. Market Restrains
- 3.3.1. ; Aquatic Toxicity Related to Ionic Liquid; Unfavorable Conditions Arising Due to COVID-19 Outbreak
- 3.4. Market Trends
- 3.4.1. Solvents and Catalyst to Dominate the Market
- 4. Market Factor Analysis
- 4.1. Porters Five Forces
- 4.2. Supply/Value Chain
- 4.3. PESTEL analysis
- 4.4. Market Entropy
- 4.5. Patent/Trademark Analysis
- 5. Global Liquid Market Analysis, Insights and Forecast, 2019-2031
- 5.1. Market Analysis, Insights and Forecast - by Application
- 5.1.1. Solvents & Catalysts
- 5.1.2. Process & Operating Fluids
- 5.1.3. Plastics
- 5.1.4. Energy Storage
- 5.1.5. Bio-Refineries
- 5.1.6. Others
- 5.2. Market Analysis, Insights and Forecast - by Region
- 5.2.1. Asia Pacific
- 5.2.2. North America
- 5.2.3. Europe
- 5.2.4. South America
- 5.2.5. Middle East and Africa
- 5.1. Market Analysis, Insights and Forecast - by Application
- 6. Asia Pacific Liquid Market Analysis, Insights and Forecast, 2019-2031
- 6.1. Market Analysis, Insights and Forecast - by Application
- 6.1.1. Solvents & Catalysts
- 6.1.2. Process & Operating Fluids
- 6.1.3. Plastics
- 6.1.4. Energy Storage
- 6.1.5. Bio-Refineries
- 6.1.6. Others
- 6.1. Market Analysis, Insights and Forecast - by Application
- 7. North America Liquid Market Analysis, Insights and Forecast, 2019-2031
- 7.1. Market Analysis, Insights and Forecast - by Application
- 7.1.1. Solvents & Catalysts
- 7.1.2. Process & Operating Fluids
- 7.1.3. Plastics
- 7.1.4. Energy Storage
- 7.1.5. Bio-Refineries
- 7.1.6. Others
- 7.1. Market Analysis, Insights and Forecast - by Application
- 8. Europe Liquid Market Analysis, Insights and Forecast, 2019-2031
- 8.1. Market Analysis, Insights and Forecast - by Application
- 8.1.1. Solvents & Catalysts
- 8.1.2. Process & Operating Fluids
- 8.1.3. Plastics
- 8.1.4. Energy Storage
- 8.1.5. Bio-Refineries
- 8.1.6. Others
- 8.1. Market Analysis, Insights and Forecast - by Application
- 9. South America Liquid Market Analysis, Insights and Forecast, 2019-2031
- 9.1. Market Analysis, Insights and Forecast - by Application
- 9.1.1. Solvents & Catalysts
- 9.1.2. Process & Operating Fluids
- 9.1.3. Plastics
- 9.1.4. Energy Storage
- 9.1.5. Bio-Refineries
- 9.1.6. Others
- 9.1. Market Analysis, Insights and Forecast - by Application
- 10. Middle East and Africa Liquid Market Analysis, Insights and Forecast, 2019-2031
- 10.1. Market Analysis, Insights and Forecast - by Application
- 10.1.1. Solvents & Catalysts
- 10.1.2. Process & Operating Fluids
- 10.1.3. Plastics
- 10.1.4. Energy Storage
- 10.1.5. Bio-Refineries
- 10.1.6. Others
- 10.1. Market Analysis, Insights and Forecast - by Application
- 11. Asia Pacific Liquid Market Analysis, Insights and Forecast, 2019-2031
- 11.1. Market Analysis, Insights and Forecast - By Country/Sub-region
- 11.1.1 China
- 11.1.2 India
- 11.1.3 Japan
- 11.1.4 South Korea
- 11.1.5 Rest of Asia Pacific
- 12. North America Liquid Market Analysis, Insights and Forecast, 2019-2031
- 12.1. Market Analysis, Insights and Forecast - By Country/Sub-region
- 12.1.1 United States
- 12.1.2 Canada
- 12.1.3 Mexico
- 13. Europe Liquid Market Analysis, Insights and Forecast, 2019-2031
- 13.1. Market Analysis, Insights and Forecast - By Country/Sub-region
- 13.1.1 Germany
- 13.1.2 United Kingdom
- 13.1.3 France
- 13.1.4 Italy
- 13.1.5 Rest of Europe
- 14. South America Liquid Market Analysis, Insights and Forecast, 2019-2031
- 14.1. Market Analysis, Insights and Forecast - By Country/Sub-region
- 14.1.1 Brazil
- 14.1.2 Argentina
- 14.1.3 Rest of South America
- 15. Middle East and Africa Liquid Market Analysis, Insights and Forecast, 2019-2031
- 15.1. Market Analysis, Insights and Forecast - By Country/Sub-region
- 15.1.1 Saudi Arabia
- 15.1.2 South Africa
- 15.1.3 Rest of Middle East and Africa
- 16. Competitive Analysis
- 16.1. Global Market Share Analysis 2024
- 16.2. Company Profiles
- 16.2.1 Tokyo Chemical Industry Co Ltd
- 16.2.1.1. Overview
- 16.2.1.2. Products
- 16.2.1.3. SWOT Analysis
- 16.2.1.4. Recent Developments
- 16.2.1.5. Financials (Based on Availability)
- 16.2.2 KOEI CHEMICAL CO LTD
- 16.2.2.1. Overview
- 16.2.2.2. Products
- 16.2.2.3. SWOT Analysis
- 16.2.2.4. Recent Developments
- 16.2.2.5. Financials (Based on Availability)
- 16.2.3 SOLVIONIC
- 16.2.3.1. Overview
- 16.2.3.2. Products
- 16.2.3.3. SWOT Analysis
- 16.2.3.4. Recent Developments
- 16.2.3.5. Financials (Based on Availability)
- 16.2.4 Solvay
- 16.2.4.1. Overview
- 16.2.4.2. Products
- 16.2.4.3. SWOT Analysis
- 16.2.4.4. Recent Developments
- 16.2.4.5. Financials (Based on Availability)
- 16.2.5 Iolitec Ionic Liquids Technologies GmbH
- 16.2.5.1. Overview
- 16.2.5.2. Products
- 16.2.5.3. SWOT Analysis
- 16.2.5.4. Recent Developments
- 16.2.5.5. Financials (Based on Availability)
- 16.2.6 Ottokemi
- 16.2.6.1. Overview
- 16.2.6.2. Products
- 16.2.6.3. SWOT Analysis
- 16.2.6.4. Recent Developments
- 16.2.6.5. Financials (Based on Availability)
- 16.2.7 BASF SE
- 16.2.7.1. Overview
- 16.2.7.2. Products
- 16.2.7.3. SWOT Analysis
- 16.2.7.4. Recent Developments
- 16.2.7.5. Financials (Based on Availability)
- 16.2.8 Kumidas SA
- 16.2.8.1. Overview
- 16.2.8.2. Products
- 16.2.8.3. SWOT Analysis
- 16.2.8.4. Recent Developments
- 16.2.8.5. Financials (Based on Availability)
- 16.2.9 TCI America
- 16.2.9.1. Overview
- 16.2.9.2. Products
- 16.2.9.3. SWOT Analysis
- 16.2.9.4. Recent Developments
- 16.2.9.5. Financials (Based on Availability)
- 16.2.10 Reinste
- 16.2.10.1. Overview
- 16.2.10.2. Products
- 16.2.10.3. SWOT Analysis
- 16.2.10.4. Recent Developments
- 16.2.10.5. Financials (Based on Availability)
- 16.2.1 Tokyo Chemical Industry Co Ltd
List of Figures
- Figure 1: Global Liquid Market Revenue Breakdown (Million, %) by Region 2024 & 2032
- Figure 2: Global Liquid Market Volume Breakdown (Liter, %) by Region 2024 & 2032
- Figure 3: Asia Pacific Liquid Market Revenue (Million), by Country 2024 & 2032
- Figure 4: Asia Pacific Liquid Market Volume (Liter), by Country 2024 & 2032
- Figure 5: Asia Pacific Liquid Market Revenue Share (%), by Country 2024 & 2032
- Figure 6: Asia Pacific Liquid Market Volume Share (%), by Country 2024 & 2032
- Figure 7: North America Liquid Market Revenue (Million), by Country 2024 & 2032
- Figure 8: North America Liquid Market Volume (Liter), by Country 2024 & 2032
- Figure 9: North America Liquid Market Revenue Share (%), by Country 2024 & 2032
- Figure 10: North America Liquid Market Volume Share (%), by Country 2024 & 2032
- Figure 11: Europe Liquid Market Revenue (Million), by Country 2024 & 2032
- Figure 12: Europe Liquid Market Volume (Liter), by Country 2024 & 2032
- Figure 13: Europe Liquid Market Revenue Share (%), by Country 2024 & 2032
- Figure 14: Europe Liquid Market Volume Share (%), by Country 2024 & 2032
- Figure 15: South America Liquid Market Revenue (Million), by Country 2024 & 2032
- Figure 16: South America Liquid Market Volume (Liter), by Country 2024 & 2032
- Figure 17: South America Liquid Market Revenue Share (%), by Country 2024 & 2032
- Figure 18: South America Liquid Market Volume Share (%), by Country 2024 & 2032
- Figure 19: Middle East and Africa Liquid Market Revenue (Million), by Country 2024 & 2032
- Figure 20: Middle East and Africa Liquid Market Volume (Liter), by Country 2024 & 2032
- Figure 21: Middle East and Africa Liquid Market Revenue Share (%), by Country 2024 & 2032
- Figure 22: Middle East and Africa Liquid Market Volume Share (%), by Country 2024 & 2032
- Figure 23: Asia Pacific Liquid Market Revenue (Million), by Application 2024 & 2032
- Figure 24: Asia Pacific Liquid Market Volume (Liter), by Application 2024 & 2032
- Figure 25: Asia Pacific Liquid Market Revenue Share (%), by Application 2024 & 2032
- Figure 26: Asia Pacific Liquid Market Volume Share (%), by Application 2024 & 2032
- Figure 27: Asia Pacific Liquid Market Revenue (Million), by Country 2024 & 2032
- Figure 28: Asia Pacific Liquid Market Volume (Liter), by Country 2024 & 2032
- Figure 29: Asia Pacific Liquid Market Revenue Share (%), by Country 2024 & 2032
- Figure 30: Asia Pacific Liquid Market Volume Share (%), by Country 2024 & 2032
- Figure 31: North America Liquid Market Revenue (Million), by Application 2024 & 2032
- Figure 32: North America Liquid Market Volume (Liter), by Application 2024 & 2032
- Figure 33: North America Liquid Market Revenue Share (%), by Application 2024 & 2032
- Figure 34: North America Liquid Market Volume Share (%), by Application 2024 & 2032
- Figure 35: North America Liquid Market Revenue (Million), by Country 2024 & 2032
- Figure 36: North America Liquid Market Volume (Liter), by Country 2024 & 2032
- Figure 37: North America Liquid Market Revenue Share (%), by Country 2024 & 2032
- Figure 38: North America Liquid Market Volume Share (%), by Country 2024 & 2032
- Figure 39: Europe Liquid Market Revenue (Million), by Application 2024 & 2032
- Figure 40: Europe Liquid Market Volume (Liter), by Application 2024 & 2032
- Figure 41: Europe Liquid Market Revenue Share (%), by Application 2024 & 2032
- Figure 42: Europe Liquid Market Volume Share (%), by Application 2024 & 2032
- Figure 43: Europe Liquid Market Revenue (Million), by Country 2024 & 2032
- Figure 44: Europe Liquid Market Volume (Liter), by Country 2024 & 2032
- Figure 45: Europe Liquid Market Revenue Share (%), by Country 2024 & 2032
- Figure 46: Europe Liquid Market Volume Share (%), by Country 2024 & 2032
- Figure 47: South America Liquid Market Revenue (Million), by Application 2024 & 2032
- Figure 48: South America Liquid Market Volume (Liter), by Application 2024 & 2032
- Figure 49: South America Liquid Market Revenue Share (%), by Application 2024 & 2032
- Figure 50: South America Liquid Market Volume Share (%), by Application 2024 & 2032
- Figure 51: South America Liquid Market Revenue (Million), by Country 2024 & 2032
- Figure 52: South America Liquid Market Volume (Liter), by Country 2024 & 2032
- Figure 53: South America Liquid Market Revenue Share (%), by Country 2024 & 2032
- Figure 54: South America Liquid Market Volume Share (%), by Country 2024 & 2032
- Figure 55: Middle East and Africa Liquid Market Revenue (Million), by Application 2024 & 2032
- Figure 56: Middle East and Africa Liquid Market Volume (Liter), by Application 2024 & 2032
- Figure 57: Middle East and Africa Liquid Market Revenue Share (%), by Application 2024 & 2032
- Figure 58: Middle East and Africa Liquid Market Volume Share (%), by Application 2024 & 2032
- Figure 59: Middle East and Africa Liquid Market Revenue (Million), by Country 2024 & 2032
- Figure 60: Middle East and Africa Liquid Market Volume (Liter), by Country 2024 & 2032
- Figure 61: Middle East and Africa Liquid Market Revenue Share (%), by Country 2024 & 2032
- Figure 62: Middle East and Africa Liquid Market Volume Share (%), by Country 2024 & 2032
List of Tables
- Table 1: Global Liquid Market Revenue Million Forecast, by Region 2019 & 2032
- Table 2: Global Liquid Market Volume Liter Forecast, by Region 2019 & 2032
- Table 3: Global Liquid Market Revenue Million Forecast, by Application 2019 & 2032
- Table 4: Global Liquid Market Volume Liter Forecast, by Application 2019 & 2032
- Table 5: Global Liquid Market Revenue Million Forecast, by Region 2019 & 2032
- Table 6: Global Liquid Market Volume Liter Forecast, by Region 2019 & 2032
- Table 7: Global Liquid Market Revenue Million Forecast, by Country 2019 & 2032
- Table 8: Global Liquid Market Volume Liter Forecast, by Country 2019 & 2032
- Table 9: China Liquid Market Revenue (Million) Forecast, by Application 2019 & 2032
- Table 10: China Liquid Market Volume (Liter) Forecast, by Application 2019 & 2032
- Table 11: India Liquid Market Revenue (Million) Forecast, by Application 2019 & 2032
- Table 12: India Liquid Market Volume (Liter) Forecast, by Application 2019 & 2032
- Table 13: Japan Liquid Market Revenue (Million) Forecast, by Application 2019 & 2032
- Table 14: Japan Liquid Market Volume (Liter) Forecast, by Application 2019 & 2032
- Table 15: South Korea Liquid Market Revenue (Million) Forecast, by Application 2019 & 2032
- Table 16: South Korea Liquid Market Volume (Liter) Forecast, by Application 2019 & 2032
- Table 17: Rest of Asia Pacific Liquid Market Revenue (Million) Forecast, by Application 2019 & 2032
- Table 18: Rest of Asia Pacific Liquid Market Volume (Liter) Forecast, by Application 2019 & 2032
- Table 19: Global Liquid Market Revenue Million Forecast, by Country 2019 & 2032
- Table 20: Global Liquid Market Volume Liter Forecast, by Country 2019 & 2032
- Table 21: United States Liquid Market Revenue (Million) Forecast, by Application 2019 & 2032
- Table 22: United States Liquid Market Volume (Liter) Forecast, by Application 2019 & 2032
- Table 23: Canada Liquid Market Revenue (Million) Forecast, by Application 2019 & 2032
- Table 24: Canada Liquid Market Volume (Liter) Forecast, by Application 2019 & 2032
- Table 25: Mexico Liquid Market Revenue (Million) Forecast, by Application 2019 & 2032
- Table 26: Mexico Liquid Market Volume (Liter) Forecast, by Application 2019 & 2032
- Table 27: Global Liquid Market Revenue Million Forecast, by Country 2019 & 2032
- Table 28: Global Liquid Market Volume Liter Forecast, by Country 2019 & 2032
- Table 29: Germany Liquid Market Revenue (Million) Forecast, by Application 2019 & 2032
- Table 30: Germany Liquid Market Volume (Liter) Forecast, by Application 2019 & 2032
- Table 31: United Kingdom Liquid Market Revenue (Million) Forecast, by Application 2019 & 2032
- Table 32: United Kingdom Liquid Market Volume (Liter) Forecast, by Application 2019 & 2032
- Table 33: France Liquid Market Revenue (Million) Forecast, by Application 2019 & 2032
- Table 34: France Liquid Market Volume (Liter) Forecast, by Application 2019 & 2032
- Table 35: Italy Liquid Market Revenue (Million) Forecast, by Application 2019 & 2032
- Table 36: Italy Liquid Market Volume (Liter) Forecast, by Application 2019 & 2032
- Table 37: Rest of Europe Liquid Market Revenue (Million) Forecast, by Application 2019 & 2032
- Table 38: Rest of Europe Liquid Market Volume (Liter) Forecast, by Application 2019 & 2032
- Table 39: Global Liquid Market Revenue Million Forecast, by Country 2019 & 2032
- Table 40: Global Liquid Market Volume Liter Forecast, by Country 2019 & 2032
- Table 41: Brazil Liquid Market Revenue (Million) Forecast, by Application 2019 & 2032
- Table 42: Brazil Liquid Market Volume (Liter) Forecast, by Application 2019 & 2032
- Table 43: Argentina Liquid Market Revenue (Million) Forecast, by Application 2019 & 2032
- Table 44: Argentina Liquid Market Volume (Liter) Forecast, by Application 2019 & 2032
- Table 45: Rest of South America Liquid Market Revenue (Million) Forecast, by Application 2019 & 2032
- Table 46: Rest of South America Liquid Market Volume (Liter) Forecast, by Application 2019 & 2032
- Table 47: Global Liquid Market Revenue Million Forecast, by Country 2019 & 2032
- Table 48: Global Liquid Market Volume Liter Forecast, by Country 2019 & 2032
- Table 49: Saudi Arabia Liquid Market Revenue (Million) Forecast, by Application 2019 & 2032
- Table 50: Saudi Arabia Liquid Market Volume (Liter) Forecast, by Application 2019 & 2032
- Table 51: South Africa Liquid Market Revenue (Million) Forecast, by Application 2019 & 2032
- Table 52: South Africa Liquid Market Volume (Liter) Forecast, by Application 2019 & 2032
- Table 53: Rest of Middle East and Africa Liquid Market Revenue (Million) Forecast, by Application 2019 & 2032
- Table 54: Rest of Middle East and Africa Liquid Market Volume (Liter) Forecast, by Application 2019 & 2032
- Table 55: Global Liquid Market Revenue Million Forecast, by Application 2019 & 2032
- Table 56: Global Liquid Market Volume Liter Forecast, by Application 2019 & 2032
- Table 57: Global Liquid Market Revenue Million Forecast, by Country 2019 & 2032
- Table 58: Global Liquid Market Volume Liter Forecast, by Country 2019 & 2032
- Table 59: China Liquid Market Revenue (Million) Forecast, by Application 2019 & 2032
- Table 60: China Liquid Market Volume (Liter) Forecast, by Application 2019 & 2032
- Table 61: India Liquid Market Revenue (Million) Forecast, by Application 2019 & 2032
- Table 62: India Liquid Market Volume (Liter) Forecast, by Application 2019 & 2032
- Table 63: Japan Liquid Market Revenue (Million) Forecast, by Application 2019 & 2032
- Table 64: Japan Liquid Market Volume (Liter) Forecast, by Application 2019 & 2032
- Table 65: South Korea Liquid Market Revenue (Million) Forecast, by Application 2019 & 2032
- Table 66: South Korea Liquid Market Volume (Liter) Forecast, by Application 2019 & 2032
- Table 67: Rest of Asia Pacific Liquid Market Revenue (Million) Forecast, by Application 2019 & 2032
- Table 68: Rest of Asia Pacific Liquid Market Volume (Liter) Forecast, by Application 2019 & 2032
- Table 69: Global Liquid Market Revenue Million Forecast, by Application 2019 & 2032
- Table 70: Global Liquid Market Volume Liter Forecast, by Application 2019 & 2032
- Table 71: Global Liquid Market Revenue Million Forecast, by Country 2019 & 2032
- Table 72: Global Liquid Market Volume Liter Forecast, by Country 2019 & 2032
- Table 73: United States Liquid Market Revenue (Million) Forecast, by Application 2019 & 2032
- Table 74: United States Liquid Market Volume (Liter) Forecast, by Application 2019 & 2032
- Table 75: Canada Liquid Market Revenue (Million) Forecast, by Application 2019 & 2032
- Table 76: Canada Liquid Market Volume (Liter) Forecast, by Application 2019 & 2032
- Table 77: Mexico Liquid Market Revenue (Million) Forecast, by Application 2019 & 2032
- Table 78: Mexico Liquid Market Volume (Liter) Forecast, by Application 2019 & 2032
- Table 79: Global Liquid Market Revenue Million Forecast, by Application 2019 & 2032
- Table 80: Global Liquid Market Volume Liter Forecast, by Application 2019 & 2032
- Table 81: Global Liquid Market Revenue Million Forecast, by Country 2019 & 2032
- Table 82: Global Liquid Market Volume Liter Forecast, by Country 2019 & 2032
- Table 83: Germany Liquid Market Revenue (Million) Forecast, by Application 2019 & 2032
- Table 84: Germany Liquid Market Volume (Liter) Forecast, by Application 2019 & 2032
- Table 85: United Kingdom Liquid Market Revenue (Million) Forecast, by Application 2019 & 2032
- Table 86: United Kingdom Liquid Market Volume (Liter) Forecast, by Application 2019 & 2032
- Table 87: France Liquid Market Revenue (Million) Forecast, by Application 2019 & 2032
- Table 88: France Liquid Market Volume (Liter) Forecast, by Application 2019 & 2032
- Table 89: Italy Liquid Market Revenue (Million) Forecast, by Application 2019 & 2032
- Table 90: Italy Liquid Market Volume (Liter) Forecast, by Application 2019 & 2032
- Table 91: Rest of Europe Liquid Market Revenue (Million) Forecast, by Application 2019 & 2032
- Table 92: Rest of Europe Liquid Market Volume (Liter) Forecast, by Application 2019 & 2032
- Table 93: Global Liquid Market Revenue Million Forecast, by Application 2019 & 2032
- Table 94: Global Liquid Market Volume Liter Forecast, by Application 2019 & 2032
- Table 95: Global Liquid Market Revenue Million Forecast, by Country 2019 & 2032
- Table 96: Global Liquid Market Volume Liter Forecast, by Country 2019 & 2032
- Table 97: Brazil Liquid Market Revenue (Million) Forecast, by Application 2019 & 2032
- Table 98: Brazil Liquid Market Volume (Liter) Forecast, by Application 2019 & 2032
- Table 99: Argentina Liquid Market Revenue (Million) Forecast, by Application 2019 & 2032
- Table 100: Argentina Liquid Market Volume (Liter) Forecast, by Application 2019 & 2032
- Table 101: Rest of South America Liquid Market Revenue (Million) Forecast, by Application 2019 & 2032
- Table 102: Rest of South America Liquid Market Volume (Liter) Forecast, by Application 2019 & 2032
- Table 103: Global Liquid Market Revenue Million Forecast, by Application 2019 & 2032
- Table 104: Global Liquid Market Volume Liter Forecast, by Application 2019 & 2032
- Table 105: Global Liquid Market Revenue Million Forecast, by Country 2019 & 2032
- Table 106: Global Liquid Market Volume Liter Forecast, by Country 2019 & 2032
- Table 107: Saudi Arabia Liquid Market Revenue (Million) Forecast, by Application 2019 & 2032
- Table 108: Saudi Arabia Liquid Market Volume (Liter) Forecast, by Application 2019 & 2032
- Table 109: South Africa Liquid Market Revenue (Million) Forecast, by Application 2019 & 2032
- Table 110: South Africa Liquid Market Volume (Liter) Forecast, by Application 2019 & 2032
- Table 111: Rest of Middle East and Africa Liquid Market Revenue (Million) Forecast, by Application 2019 & 2032
- Table 112: Rest of Middle East and Africa Liquid Market Volume (Liter) Forecast, by Application 2019 & 2032
Frequently Asked Questions
1. What is the projected Compound Annual Growth Rate (CAGR) of the Liquid Market?
The projected CAGR is approximately > 8.00%.
2. Which companies are prominent players in the Liquid Market?
Key companies in the market include Tokyo Chemical Industry Co Ltd, KOEI CHEMICAL CO LTD, SOLVIONIC, Solvay, Iolitec Ionic Liquids Technologies GmbH, Ottokemi, BASF SE, Kumidas SA, TCI America, Reinste.
3. What are the main segments of the Liquid Market?
The market segments include Application.
4. Can you provide details about the market size?
The market size is estimated to be USD XX Million as of 2022.
5. What are some drivers contributing to market growth?
; Increasing Use of Ionic Liquid as Industrial Solvents; Growing Consumption of Batteries.
6. What are the notable trends driving market growth?
Solvents and Catalyst to Dominate the Market.
7. Are there any restraints impacting market growth?
; Aquatic Toxicity Related to Ionic Liquid; Unfavorable Conditions Arising Due to COVID-19 Outbreak.
8. Can you provide examples of recent developments in the market?
N/A
9. What pricing options are available for accessing the report?
Pricing options include single-user, multi-user, and enterprise licenses priced at USD 4750, USD 5250, and USD 8750 respectively.
10. Is the market size provided in terms of value or volume?
The market size is provided in terms of value, measured in Million and volume, measured in Liter.
11. Are there any specific market keywords associated with the report?
Yes, the market keyword associated with the report is "Liquid Market," which aids in identifying and referencing the specific market segment covered.
12. How do I determine which pricing option suits my needs best?
The pricing options vary based on user requirements and access needs. Individual users may opt for single-user licenses, while businesses requiring broader access may choose multi-user or enterprise licenses for cost-effective access to the report.
13. Are there any additional resources or data provided in the Liquid Market report?
While the report offers comprehensive insights, it's advisable to review the specific contents or supplementary materials provided to ascertain if additional resources or data are available.
14. How can I stay updated on further developments or reports in the Liquid Market?
To stay informed about further developments, trends, and reports in the Liquid Market, consider subscribing to industry newsletters, following relevant companies and organizations, or regularly checking reputable industry news sources and publications.
Methodology
Step 1 - Identification of Relevant Samples Size from Population Database


Step 2 - Approaches for Defining Global Market Size (Value, Volume* & Price*)

Note*: In applicable scenarios
Step 3 - Data Sources
Primary Research
- Web Analytics
- Survey Reports
- Research Institute
- Latest Research Reports
- Opinion Leaders
Secondary Research
- Annual Reports
- White Paper
- Latest Press Release
- Industry Association
- Paid Database
- Investor Presentations

Step 4 - Data Triangulation
Involves using different sources of information in order to increase the validity of a study
These sources are likely to be stakeholders in a program - participants, other researchers, program staff, other community members, and so on.
Then we put all data in single framework & apply various statistical tools to find out the dynamic on the market.
During the analysis stage, feedback from the stakeholder groups would be compared to determine areas of agreement as well as areas of divergence


