
Key Insights
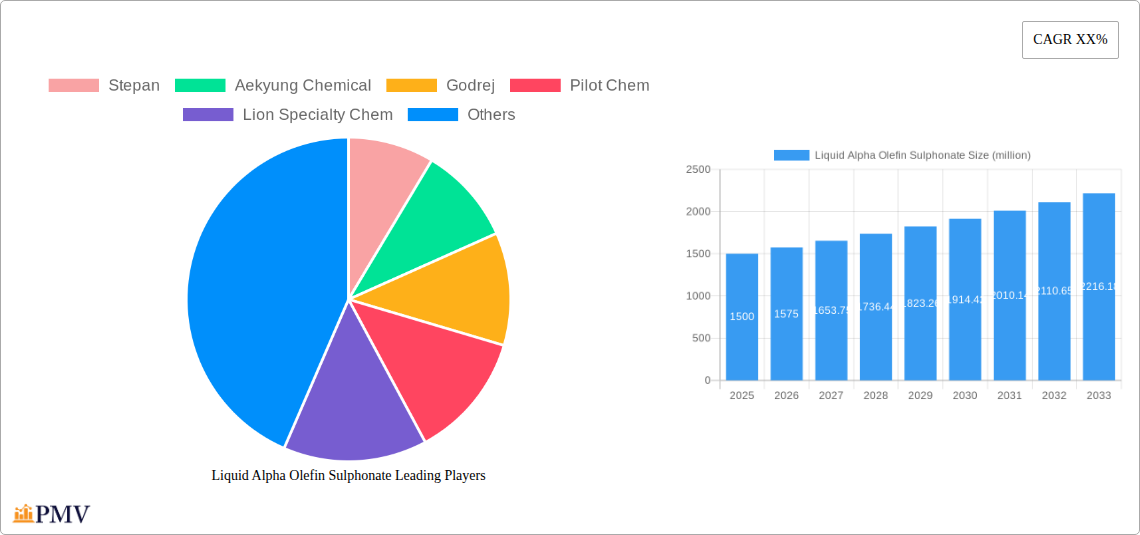
The global market for Liquid Alpha Olefin Sulfonates (LAOS) is experiencing robust growth, driven by increasing demand from various sectors. The market size in 2025 is estimated at $1.5 billion, with a Compound Annual Growth Rate (CAGR) of 5% projected from 2025 to 2033. Key drivers include the rising demand for high-performance detergents and surfactants in the homecare and industrial cleaning segments. Growing environmental concerns are also pushing manufacturers towards bio-based and biodegradable alternatives, presenting significant opportunities for LAOS producers focusing on sustainable solutions. The market is segmented by application (detergents, industrial cleaners, etc.), by type (linear alkylbenzene sulfonates (LAS) alternatives, others) and by region, with North America and Europe currently holding significant market shares. However, the Asia-Pacific region is expected to witness the fastest growth, fueled by expanding industrialization and increasing consumer spending. Competitive pressures from established players like Stepan, Solvay, and Clariant, as well as emerging regional manufacturers, are shaping the market landscape. Despite price fluctuations in raw materials and potential regulatory hurdles related to environmental compliance, the long-term outlook for LAOS remains positive, primarily due to the increasing demand for effective and environmentally friendly cleaning solutions.
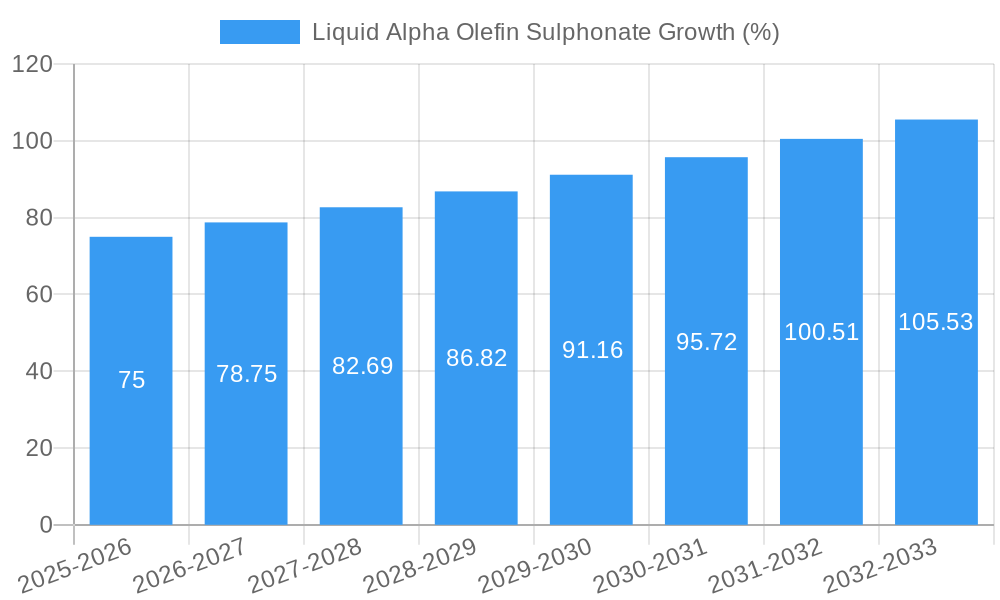
The forecast period (2025-2033) anticipates consistent growth, with the market expected to surpass $2.3 billion by 2033. This growth will be influenced by ongoing technological advancements in LAOS formulations, leading to improved performance characteristics and enhanced sustainability. Furthermore, the expanding use of LAOS in personal care products and specialty applications will contribute to this upward trajectory. While challenges exist in managing raw material costs and navigating evolving regulatory frameworks, strategic partnerships, research and development efforts towards innovative products, and a focus on sustainability will be key for players to capitalize on the market's promising potential.
Liquid Alpha Olefin Sulphonate Market Report: 2019-2033
This comprehensive report provides a detailed analysis of the global Liquid Alpha Olefin Sulphonate (LAOS) market, offering in-depth insights into market structure, competitive dynamics, industry trends, and future growth prospects. The study period covers 2019-2033, with 2025 as the base and estimated year. The forecast period spans 2025-2033, while the historical period encompasses 2019-2024. This report is crucial for industry stakeholders, investors, and market researchers seeking a thorough understanding of this dynamic market. The global market size in 2025 is estimated at $XX million.
Liquid Alpha Olefin Sulphonate Market Structure & Competitive Dynamics
The global Liquid Alpha Olefin Sulphonate market is moderately concentrated, with several major players holding significant market share. Stepan, Aekyung Chemical, and Solvay are among the leading companies, collectively commanding an estimated xx% of the market in 2025. Market concentration is influenced by factors including economies of scale in production, technological advancements, and access to raw materials.
The market's competitive landscape is characterized by ongoing innovation, with companies investing heavily in R&D to develop new products and applications for LAOS. Regulatory frameworks, particularly concerning environmental regulations and safety standards, significantly impact the market. The presence of substitute products, such as other surfactants, presents competitive challenges. End-user trends towards sustainable and high-performance products are shaping product development strategies.
Mergers and acquisitions (M&A) activity in the LAOS sector has been moderate, with deal values totaling approximately $XX million over the past five years. Key M&A drivers include expanding product portfolios, gaining access to new markets, and enhancing technological capabilities.
- Market Share (2025): Stepan (xx%), Aekyung Chemical (xx%), Solvay (xx%), Others (xx%).
- M&A Deal Value (2019-2024): $XX million.
- Key Competitive Factors: Innovation, Regulatory Compliance, Sustainability, Cost Efficiency.
Liquid Alpha Olefin Sulphonate Industry Trends & Insights
The global LAOS market is projected to experience robust growth, with a Compound Annual Growth Rate (CAGR) of xx% during the forecast period (2025-2033). This growth is primarily driven by increasing demand from key end-use sectors such as detergents and cleaners, personal care products, and industrial applications. Technological advancements leading to improved product performance, such as enhanced biodegradability and reduced environmental impact, are fueling market expansion. Consumer preference for sustainable and eco-friendly products is also a key growth driver, pushing manufacturers to develop more sustainable LAOS formulations. Competitive dynamics, including the introduction of new products and the expansion of existing players, are further shaping market growth trajectories. Market penetration is expected to increase significantly, particularly in developing economies with rising disposable incomes and expanding industrial sectors. The market is expected to reach $XX million by 2033.
Dominant Markets & Segments in Liquid Alpha Olefin Sulphonate
The Asia-Pacific region is currently the dominant market for LAOS, driven by strong economic growth, expanding industrialization, and a growing population. China and India are particularly significant contributors to regional market growth.
- Key Drivers in Asia-Pacific:
- Rapid industrialization and urbanization.
- Increasing demand for consumer goods.
- Favorable government policies supporting industrial development.
- Rising disposable incomes.
- Development of robust infrastructure.
Europe and North America also represent substantial markets for LAOS, though their growth rates are projected to be more moderate compared to the Asia-Pacific region. The detergent and cleaner segment holds the largest market share, followed by the personal care and industrial segments.
Liquid Alpha Olefin Sulphonate Product Innovations
Recent innovations in LAOS technology have focused on enhancing product performance, improving sustainability, and reducing environmental impact. New formulations with superior biodegradability and reduced toxicity are gaining popularity. Companies are also developing specialized LAOS products tailored for specific applications, such as high-performance cleaning formulations and eco-friendly personal care products. These innovations are driving increased market penetration and attracting new customers.
Report Segmentation & Scope
This report segments the LAOS market based on product type, application, and region. The product type segmentation includes different grades of LAOS based on their molecular weight and properties. Application-wise, the market is segmented into detergents and cleaners, personal care products, industrial applications, and others. Geographically, the report analyzes the market across key regions, including North America, Europe, Asia-Pacific, and the rest of the world. Each segment's growth projections, market size, and competitive dynamics are detailed within the full report.
Key Drivers of Liquid Alpha Olefin Sulphonate Growth
Several factors drive the growth of the LAOS market. Increasing demand for cleaning products, personal care items, and industrial applications fuels significant market expansion. Technological advancements in LAOS formulations lead to improved efficacy, sustainability, and cost-effectiveness. Favorable government regulations promoting the use of eco-friendly surfactants further boost market growth. The expanding global population and rising disposable incomes in developing economies also contribute to the market's positive trajectory.
Challenges in the Liquid Alpha Olefin Sulphonate Sector
The LAOS market faces certain challenges, including fluctuating raw material prices, stringent environmental regulations impacting production costs, and intensifying competition from substitute products. Supply chain disruptions can also lead to production delays and increased costs. Meeting increasingly stringent regulatory requirements for product safety and environmental impact necessitates substantial investments in R&D and compliance measures, posing challenges for smaller players.
Leading Players in the Liquid Alpha Olefin Sulphonate Market
- Stepan
- Aekyung Chemical
- Godrej
- Pilot Chem
- Lion Specialty Chem
- Solvay
- Taiwan NJC
- Innospec Performance Chemicals
- Nouryon
- Kao Chem
- Clariant
- Enaspol
- Fogla Corp
- Colonial Chem
- Zanyu Tech
- Sinolight Chem
- Jujin Chem
Key Developments in Liquid Alpha Olefin Sulphonate Sector
- 2022 Q4: Stepan launched a new, sustainably sourced LAOS product.
- 2023 Q1: Aekyung Chemical announced a significant expansion of its LAOS production capacity.
- 2023 Q3: Solvay acquired a smaller LAOS manufacturer, expanding its market presence. (Further developments to be added in the full report)
Strategic Liquid Alpha Olefin Sulphonate Market Outlook
The future of the LAOS market appears promising, with continued growth driven by the factors discussed above. Strategic opportunities exist for companies to invest in sustainable product development, expand into new geographical markets, and leverage technological advancements to enhance product performance and competitiveness. Focus on eco-friendly solutions and efficient supply chain management will be critical for success in this dynamic market. The market is poised for substantial growth, particularly in developing economies and high-growth sectors, indicating a positive and profitable outlook for involved stakeholders.
Liquid Alpha Olefin Sulphonate Segmentation
-
1. Application
- 1.1. Personal Care
- 1.2. Home Care
- 1.3. Industrial Applications
- 1.4. Others
-
2. Types
- 2.1. 40% Solution
- 2.2. 39% Solution
- 2.3. 37% Solution
- 2.4. 35% Solution
- 2.5. Other Solutions
Liquid Alpha Olefin Sulphonate Segmentation By Geography
-
1. North America
- 1.1. United States
- 1.2. Canada
- 1.3. Mexico
-
2. South America
- 2.1. Brazil
- 2.2. Argentina
- 2.3. Rest of South America
-
3. Europe
- 3.1. United Kingdom
- 3.2. Germany
- 3.3. France
- 3.4. Italy
- 3.5. Spain
- 3.6. Russia
- 3.7. Benelux
- 3.8. Nordics
- 3.9. Rest of Europe
-
4. Middle East & Africa
- 4.1. Turkey
- 4.2. Israel
- 4.3. GCC
- 4.4. North Africa
- 4.5. South Africa
- 4.6. Rest of Middle East & Africa
-
5. Asia Pacific
- 5.1. China
- 5.2. India
- 5.3. Japan
- 5.4. South Korea
- 5.5. ASEAN
- 5.6. Oceania
- 5.7. Rest of Asia Pacific

Liquid Alpha Olefin Sulphonate REPORT HIGHLIGHTS
| Aspects | Details |
|---|---|
| Study Period | 2019-2033 |
| Base Year | 2024 |
| Estimated Year | 2025 |
| Forecast Period | 2025-2033 |
| Historical Period | 2019-2024 |
| Growth Rate | CAGR of XX% from 2019-2033 |
| Segmentation |
|
Table of Contents
- 1. Introduction
- 1.1. Research Scope
- 1.2. Market Segmentation
- 1.3. Research Methodology
- 1.4. Definitions and Assumptions
- 2. Executive Summary
- 2.1. Introduction
- 3. Market Dynamics
- 3.1. Introduction
- 3.2. Market Drivers
- 3.3. Market Restrains
- 3.4. Market Trends
- 4. Market Factor Analysis
- 4.1. Porters Five Forces
- 4.2. Supply/Value Chain
- 4.3. PESTEL analysis
- 4.4. Market Entropy
- 4.5. Patent/Trademark Analysis
- 5. Global Liquid Alpha Olefin Sulphonate Analysis, Insights and Forecast, 2019-2031
- 5.1. Market Analysis, Insights and Forecast - by Application
- 5.1.1. Personal Care
- 5.1.2. Home Care
- 5.1.3. Industrial Applications
- 5.1.4. Others
- 5.2. Market Analysis, Insights and Forecast - by Types
- 5.2.1. 40% Solution
- 5.2.2. 39% Solution
- 5.2.3. 37% Solution
- 5.2.4. 35% Solution
- 5.2.5. Other Solutions
- 5.3. Market Analysis, Insights and Forecast - by Region
- 5.3.1. North America
- 5.3.2. South America
- 5.3.3. Europe
- 5.3.4. Middle East & Africa
- 5.3.5. Asia Pacific
- 5.1. Market Analysis, Insights and Forecast - by Application
- 6. North America Liquid Alpha Olefin Sulphonate Analysis, Insights and Forecast, 2019-2031
- 6.1. Market Analysis, Insights and Forecast - by Application
- 6.1.1. Personal Care
- 6.1.2. Home Care
- 6.1.3. Industrial Applications
- 6.1.4. Others
- 6.2. Market Analysis, Insights and Forecast - by Types
- 6.2.1. 40% Solution
- 6.2.2. 39% Solution
- 6.2.3. 37% Solution
- 6.2.4. 35% Solution
- 6.2.5. Other Solutions
- 6.1. Market Analysis, Insights and Forecast - by Application
- 7. South America Liquid Alpha Olefin Sulphonate Analysis, Insights and Forecast, 2019-2031
- 7.1. Market Analysis, Insights and Forecast - by Application
- 7.1.1. Personal Care
- 7.1.2. Home Care
- 7.1.3. Industrial Applications
- 7.1.4. Others
- 7.2. Market Analysis, Insights and Forecast - by Types
- 7.2.1. 40% Solution
- 7.2.2. 39% Solution
- 7.2.3. 37% Solution
- 7.2.4. 35% Solution
- 7.2.5. Other Solutions
- 7.1. Market Analysis, Insights and Forecast - by Application
- 8. Europe Liquid Alpha Olefin Sulphonate Analysis, Insights and Forecast, 2019-2031
- 8.1. Market Analysis, Insights and Forecast - by Application
- 8.1.1. Personal Care
- 8.1.2. Home Care
- 8.1.3. Industrial Applications
- 8.1.4. Others
- 8.2. Market Analysis, Insights and Forecast - by Types
- 8.2.1. 40% Solution
- 8.2.2. 39% Solution
- 8.2.3. 37% Solution
- 8.2.4. 35% Solution
- 8.2.5. Other Solutions
- 8.1. Market Analysis, Insights and Forecast - by Application
- 9. Middle East & Africa Liquid Alpha Olefin Sulphonate Analysis, Insights and Forecast, 2019-2031
- 9.1. Market Analysis, Insights and Forecast - by Application
- 9.1.1. Personal Care
- 9.1.2. Home Care
- 9.1.3. Industrial Applications
- 9.1.4. Others
- 9.2. Market Analysis, Insights and Forecast - by Types
- 9.2.1. 40% Solution
- 9.2.2. 39% Solution
- 9.2.3. 37% Solution
- 9.2.4. 35% Solution
- 9.2.5. Other Solutions
- 9.1. Market Analysis, Insights and Forecast - by Application
- 10. Asia Pacific Liquid Alpha Olefin Sulphonate Analysis, Insights and Forecast, 2019-2031
- 10.1. Market Analysis, Insights and Forecast - by Application
- 10.1.1. Personal Care
- 10.1.2. Home Care
- 10.1.3. Industrial Applications
- 10.1.4. Others
- 10.2. Market Analysis, Insights and Forecast - by Types
- 10.2.1. 40% Solution
- 10.2.2. 39% Solution
- 10.2.3. 37% Solution
- 10.2.4. 35% Solution
- 10.2.5. Other Solutions
- 10.1. Market Analysis, Insights and Forecast - by Application
- 11. Competitive Analysis
- 11.1. Global Market Share Analysis 2024
- 11.2. Company Profiles
- 11.2.1 Stepan
- 11.2.1.1. Overview
- 11.2.1.2. Products
- 11.2.1.3. SWOT Analysis
- 11.2.1.4. Recent Developments
- 11.2.1.5. Financials (Based on Availability)
- 11.2.2 Aekyung Chemical
- 11.2.2.1. Overview
- 11.2.2.2. Products
- 11.2.2.3. SWOT Analysis
- 11.2.2.4. Recent Developments
- 11.2.2.5. Financials (Based on Availability)
- 11.2.3 Godrej
- 11.2.3.1. Overview
- 11.2.3.2. Products
- 11.2.3.3. SWOT Analysis
- 11.2.3.4. Recent Developments
- 11.2.3.5. Financials (Based on Availability)
- 11.2.4 Pilot Chem
- 11.2.4.1. Overview
- 11.2.4.2. Products
- 11.2.4.3. SWOT Analysis
- 11.2.4.4. Recent Developments
- 11.2.4.5. Financials (Based on Availability)
- 11.2.5 Lion Specialty Chem
- 11.2.5.1. Overview
- 11.2.5.2. Products
- 11.2.5.3. SWOT Analysis
- 11.2.5.4. Recent Developments
- 11.2.5.5. Financials (Based on Availability)
- 11.2.6 Solvay
- 11.2.6.1. Overview
- 11.2.6.2. Products
- 11.2.6.3. SWOT Analysis
- 11.2.6.4. Recent Developments
- 11.2.6.5. Financials (Based on Availability)
- 11.2.7 Taiwan NJC
- 11.2.7.1. Overview
- 11.2.7.2. Products
- 11.2.7.3. SWOT Analysis
- 11.2.7.4. Recent Developments
- 11.2.7.5. Financials (Based on Availability)
- 11.2.8 Innospec Performance Chemicals
- 11.2.8.1. Overview
- 11.2.8.2. Products
- 11.2.8.3. SWOT Analysis
- 11.2.8.4. Recent Developments
- 11.2.8.5. Financials (Based on Availability)
- 11.2.9 Nouryon
- 11.2.9.1. Overview
- 11.2.9.2. Products
- 11.2.9.3. SWOT Analysis
- 11.2.9.4. Recent Developments
- 11.2.9.5. Financials (Based on Availability)
- 11.2.10 Kao Chem
- 11.2.10.1. Overview
- 11.2.10.2. Products
- 11.2.10.3. SWOT Analysis
- 11.2.10.4. Recent Developments
- 11.2.10.5. Financials (Based on Availability)
- 11.2.11 Clariant
- 11.2.11.1. Overview
- 11.2.11.2. Products
- 11.2.11.3. SWOT Analysis
- 11.2.11.4. Recent Developments
- 11.2.11.5. Financials (Based on Availability)
- 11.2.12 Enaspol
- 11.2.12.1. Overview
- 11.2.12.2. Products
- 11.2.12.3. SWOT Analysis
- 11.2.12.4. Recent Developments
- 11.2.12.5. Financials (Based on Availability)
- 11.2.13 Fogla Corp
- 11.2.13.1. Overview
- 11.2.13.2. Products
- 11.2.13.3. SWOT Analysis
- 11.2.13.4. Recent Developments
- 11.2.13.5. Financials (Based on Availability)
- 11.2.14 Colonial Chem
- 11.2.14.1. Overview
- 11.2.14.2. Products
- 11.2.14.3. SWOT Analysis
- 11.2.14.4. Recent Developments
- 11.2.14.5. Financials (Based on Availability)
- 11.2.15 Zanyu Tech
- 11.2.15.1. Overview
- 11.2.15.2. Products
- 11.2.15.3. SWOT Analysis
- 11.2.15.4. Recent Developments
- 11.2.15.5. Financials (Based on Availability)
- 11.2.16 Sinolight Chem
- 11.2.16.1. Overview
- 11.2.16.2. Products
- 11.2.16.3. SWOT Analysis
- 11.2.16.4. Recent Developments
- 11.2.16.5. Financials (Based on Availability)
- 11.2.17 Jujin Chem
- 11.2.17.1. Overview
- 11.2.17.2. Products
- 11.2.17.3. SWOT Analysis
- 11.2.17.4. Recent Developments
- 11.2.17.5. Financials (Based on Availability)
- 11.2.1 Stepan
List of Figures
- Figure 1: Global Liquid Alpha Olefin Sulphonate Revenue Breakdown (million, %) by Region 2024 & 2032
- Figure 2: Global Liquid Alpha Olefin Sulphonate Volume Breakdown (K, %) by Region 2024 & 2032
- Figure 3: North America Liquid Alpha Olefin Sulphonate Revenue (million), by Application 2024 & 2032
- Figure 4: North America Liquid Alpha Olefin Sulphonate Volume (K), by Application 2024 & 2032
- Figure 5: North America Liquid Alpha Olefin Sulphonate Revenue Share (%), by Application 2024 & 2032
- Figure 6: North America Liquid Alpha Olefin Sulphonate Volume Share (%), by Application 2024 & 2032
- Figure 7: North America Liquid Alpha Olefin Sulphonate Revenue (million), by Types 2024 & 2032
- Figure 8: North America Liquid Alpha Olefin Sulphonate Volume (K), by Types 2024 & 2032
- Figure 9: North America Liquid Alpha Olefin Sulphonate Revenue Share (%), by Types 2024 & 2032
- Figure 10: North America Liquid Alpha Olefin Sulphonate Volume Share (%), by Types 2024 & 2032
- Figure 11: North America Liquid Alpha Olefin Sulphonate Revenue (million), by Country 2024 & 2032
- Figure 12: North America Liquid Alpha Olefin Sulphonate Volume (K), by Country 2024 & 2032
- Figure 13: North America Liquid Alpha Olefin Sulphonate Revenue Share (%), by Country 2024 & 2032
- Figure 14: North America Liquid Alpha Olefin Sulphonate Volume Share (%), by Country 2024 & 2032
- Figure 15: South America Liquid Alpha Olefin Sulphonate Revenue (million), by Application 2024 & 2032
- Figure 16: South America Liquid Alpha Olefin Sulphonate Volume (K), by Application 2024 & 2032
- Figure 17: South America Liquid Alpha Olefin Sulphonate Revenue Share (%), by Application 2024 & 2032
- Figure 18: South America Liquid Alpha Olefin Sulphonate Volume Share (%), by Application 2024 & 2032
- Figure 19: South America Liquid Alpha Olefin Sulphonate Revenue (million), by Types 2024 & 2032
- Figure 20: South America Liquid Alpha Olefin Sulphonate Volume (K), by Types 2024 & 2032
- Figure 21: South America Liquid Alpha Olefin Sulphonate Revenue Share (%), by Types 2024 & 2032
- Figure 22: South America Liquid Alpha Olefin Sulphonate Volume Share (%), by Types 2024 & 2032
- Figure 23: South America Liquid Alpha Olefin Sulphonate Revenue (million), by Country 2024 & 2032
- Figure 24: South America Liquid Alpha Olefin Sulphonate Volume (K), by Country 2024 & 2032
- Figure 25: South America Liquid Alpha Olefin Sulphonate Revenue Share (%), by Country 2024 & 2032
- Figure 26: South America Liquid Alpha Olefin Sulphonate Volume Share (%), by Country 2024 & 2032
- Figure 27: Europe Liquid Alpha Olefin Sulphonate Revenue (million), by Application 2024 & 2032
- Figure 28: Europe Liquid Alpha Olefin Sulphonate Volume (K), by Application 2024 & 2032
- Figure 29: Europe Liquid Alpha Olefin Sulphonate Revenue Share (%), by Application 2024 & 2032
- Figure 30: Europe Liquid Alpha Olefin Sulphonate Volume Share (%), by Application 2024 & 2032
- Figure 31: Europe Liquid Alpha Olefin Sulphonate Revenue (million), by Types 2024 & 2032
- Figure 32: Europe Liquid Alpha Olefin Sulphonate Volume (K), by Types 2024 & 2032
- Figure 33: Europe Liquid Alpha Olefin Sulphonate Revenue Share (%), by Types 2024 & 2032
- Figure 34: Europe Liquid Alpha Olefin Sulphonate Volume Share (%), by Types 2024 & 2032
- Figure 35: Europe Liquid Alpha Olefin Sulphonate Revenue (million), by Country 2024 & 2032
- Figure 36: Europe Liquid Alpha Olefin Sulphonate Volume (K), by Country 2024 & 2032
- Figure 37: Europe Liquid Alpha Olefin Sulphonate Revenue Share (%), by Country 2024 & 2032
- Figure 38: Europe Liquid Alpha Olefin Sulphonate Volume Share (%), by Country 2024 & 2032
- Figure 39: Middle East & Africa Liquid Alpha Olefin Sulphonate Revenue (million), by Application 2024 & 2032
- Figure 40: Middle East & Africa Liquid Alpha Olefin Sulphonate Volume (K), by Application 2024 & 2032
- Figure 41: Middle East & Africa Liquid Alpha Olefin Sulphonate Revenue Share (%), by Application 2024 & 2032
- Figure 42: Middle East & Africa Liquid Alpha Olefin Sulphonate Volume Share (%), by Application 2024 & 2032
- Figure 43: Middle East & Africa Liquid Alpha Olefin Sulphonate Revenue (million), by Types 2024 & 2032
- Figure 44: Middle East & Africa Liquid Alpha Olefin Sulphonate Volume (K), by Types 2024 & 2032
- Figure 45: Middle East & Africa Liquid Alpha Olefin Sulphonate Revenue Share (%), by Types 2024 & 2032
- Figure 46: Middle East & Africa Liquid Alpha Olefin Sulphonate Volume Share (%), by Types 2024 & 2032
- Figure 47: Middle East & Africa Liquid Alpha Olefin Sulphonate Revenue (million), by Country 2024 & 2032
- Figure 48: Middle East & Africa Liquid Alpha Olefin Sulphonate Volume (K), by Country 2024 & 2032
- Figure 49: Middle East & Africa Liquid Alpha Olefin Sulphonate Revenue Share (%), by Country 2024 & 2032
- Figure 50: Middle East & Africa Liquid Alpha Olefin Sulphonate Volume Share (%), by Country 2024 & 2032
- Figure 51: Asia Pacific Liquid Alpha Olefin Sulphonate Revenue (million), by Application 2024 & 2032
- Figure 52: Asia Pacific Liquid Alpha Olefin Sulphonate Volume (K), by Application 2024 & 2032
- Figure 53: Asia Pacific Liquid Alpha Olefin Sulphonate Revenue Share (%), by Application 2024 & 2032
- Figure 54: Asia Pacific Liquid Alpha Olefin Sulphonate Volume Share (%), by Application 2024 & 2032
- Figure 55: Asia Pacific Liquid Alpha Olefin Sulphonate Revenue (million), by Types 2024 & 2032
- Figure 56: Asia Pacific Liquid Alpha Olefin Sulphonate Volume (K), by Types 2024 & 2032
- Figure 57: Asia Pacific Liquid Alpha Olefin Sulphonate Revenue Share (%), by Types 2024 & 2032
- Figure 58: Asia Pacific Liquid Alpha Olefin Sulphonate Volume Share (%), by Types 2024 & 2032
- Figure 59: Asia Pacific Liquid Alpha Olefin Sulphonate Revenue (million), by Country 2024 & 2032
- Figure 60: Asia Pacific Liquid Alpha Olefin Sulphonate Volume (K), by Country 2024 & 2032
- Figure 61: Asia Pacific Liquid Alpha Olefin Sulphonate Revenue Share (%), by Country 2024 & 2032
- Figure 62: Asia Pacific Liquid Alpha Olefin Sulphonate Volume Share (%), by Country 2024 & 2032
List of Tables
- Table 1: Global Liquid Alpha Olefin Sulphonate Revenue million Forecast, by Region 2019 & 2032
- Table 2: Global Liquid Alpha Olefin Sulphonate Volume K Forecast, by Region 2019 & 2032
- Table 3: Global Liquid Alpha Olefin Sulphonate Revenue million Forecast, by Application 2019 & 2032
- Table 4: Global Liquid Alpha Olefin Sulphonate Volume K Forecast, by Application 2019 & 2032
- Table 5: Global Liquid Alpha Olefin Sulphonate Revenue million Forecast, by Types 2019 & 2032
- Table 6: Global Liquid Alpha Olefin Sulphonate Volume K Forecast, by Types 2019 & 2032
- Table 7: Global Liquid Alpha Olefin Sulphonate Revenue million Forecast, by Region 2019 & 2032
- Table 8: Global Liquid Alpha Olefin Sulphonate Volume K Forecast, by Region 2019 & 2032
- Table 9: Global Liquid Alpha Olefin Sulphonate Revenue million Forecast, by Application 2019 & 2032
- Table 10: Global Liquid Alpha Olefin Sulphonate Volume K Forecast, by Application 2019 & 2032
- Table 11: Global Liquid Alpha Olefin Sulphonate Revenue million Forecast, by Types 2019 & 2032
- Table 12: Global Liquid Alpha Olefin Sulphonate Volume K Forecast, by Types 2019 & 2032
- Table 13: Global Liquid Alpha Olefin Sulphonate Revenue million Forecast, by Country 2019 & 2032
- Table 14: Global Liquid Alpha Olefin Sulphonate Volume K Forecast, by Country 2019 & 2032
- Table 15: United States Liquid Alpha Olefin Sulphonate Revenue (million) Forecast, by Application 2019 & 2032
- Table 16: United States Liquid Alpha Olefin Sulphonate Volume (K) Forecast, by Application 2019 & 2032
- Table 17: Canada Liquid Alpha Olefin Sulphonate Revenue (million) Forecast, by Application 2019 & 2032
- Table 18: Canada Liquid Alpha Olefin Sulphonate Volume (K) Forecast, by Application 2019 & 2032
- Table 19: Mexico Liquid Alpha Olefin Sulphonate Revenue (million) Forecast, by Application 2019 & 2032
- Table 20: Mexico Liquid Alpha Olefin Sulphonate Volume (K) Forecast, by Application 2019 & 2032
- Table 21: Global Liquid Alpha Olefin Sulphonate Revenue million Forecast, by Application 2019 & 2032
- Table 22: Global Liquid Alpha Olefin Sulphonate Volume K Forecast, by Application 2019 & 2032
- Table 23: Global Liquid Alpha Olefin Sulphonate Revenue million Forecast, by Types 2019 & 2032
- Table 24: Global Liquid Alpha Olefin Sulphonate Volume K Forecast, by Types 2019 & 2032
- Table 25: Global Liquid Alpha Olefin Sulphonate Revenue million Forecast, by Country 2019 & 2032
- Table 26: Global Liquid Alpha Olefin Sulphonate Volume K Forecast, by Country 2019 & 2032
- Table 27: Brazil Liquid Alpha Olefin Sulphonate Revenue (million) Forecast, by Application 2019 & 2032
- Table 28: Brazil Liquid Alpha Olefin Sulphonate Volume (K) Forecast, by Application 2019 & 2032
- Table 29: Argentina Liquid Alpha Olefin Sulphonate Revenue (million) Forecast, by Application 2019 & 2032
- Table 30: Argentina Liquid Alpha Olefin Sulphonate Volume (K) Forecast, by Application 2019 & 2032
- Table 31: Rest of South America Liquid Alpha Olefin Sulphonate Revenue (million) Forecast, by Application 2019 & 2032
- Table 32: Rest of South America Liquid Alpha Olefin Sulphonate Volume (K) Forecast, by Application 2019 & 2032
- Table 33: Global Liquid Alpha Olefin Sulphonate Revenue million Forecast, by Application 2019 & 2032
- Table 34: Global Liquid Alpha Olefin Sulphonate Volume K Forecast, by Application 2019 & 2032
- Table 35: Global Liquid Alpha Olefin Sulphonate Revenue million Forecast, by Types 2019 & 2032
- Table 36: Global Liquid Alpha Olefin Sulphonate Volume K Forecast, by Types 2019 & 2032
- Table 37: Global Liquid Alpha Olefin Sulphonate Revenue million Forecast, by Country 2019 & 2032
- Table 38: Global Liquid Alpha Olefin Sulphonate Volume K Forecast, by Country 2019 & 2032
- Table 39: United Kingdom Liquid Alpha Olefin Sulphonate Revenue (million) Forecast, by Application 2019 & 2032
- Table 40: United Kingdom Liquid Alpha Olefin Sulphonate Volume (K) Forecast, by Application 2019 & 2032
- Table 41: Germany Liquid Alpha Olefin Sulphonate Revenue (million) Forecast, by Application 2019 & 2032
- Table 42: Germany Liquid Alpha Olefin Sulphonate Volume (K) Forecast, by Application 2019 & 2032
- Table 43: France Liquid Alpha Olefin Sulphonate Revenue (million) Forecast, by Application 2019 & 2032
- Table 44: France Liquid Alpha Olefin Sulphonate Volume (K) Forecast, by Application 2019 & 2032
- Table 45: Italy Liquid Alpha Olefin Sulphonate Revenue (million) Forecast, by Application 2019 & 2032
- Table 46: Italy Liquid Alpha Olefin Sulphonate Volume (K) Forecast, by Application 2019 & 2032
- Table 47: Spain Liquid Alpha Olefin Sulphonate Revenue (million) Forecast, by Application 2019 & 2032
- Table 48: Spain Liquid Alpha Olefin Sulphonate Volume (K) Forecast, by Application 2019 & 2032
- Table 49: Russia Liquid Alpha Olefin Sulphonate Revenue (million) Forecast, by Application 2019 & 2032
- Table 50: Russia Liquid Alpha Olefin Sulphonate Volume (K) Forecast, by Application 2019 & 2032
- Table 51: Benelux Liquid Alpha Olefin Sulphonate Revenue (million) Forecast, by Application 2019 & 2032
- Table 52: Benelux Liquid Alpha Olefin Sulphonate Volume (K) Forecast, by Application 2019 & 2032
- Table 53: Nordics Liquid Alpha Olefin Sulphonate Revenue (million) Forecast, by Application 2019 & 2032
- Table 54: Nordics Liquid Alpha Olefin Sulphonate Volume (K) Forecast, by Application 2019 & 2032
- Table 55: Rest of Europe Liquid Alpha Olefin Sulphonate Revenue (million) Forecast, by Application 2019 & 2032
- Table 56: Rest of Europe Liquid Alpha Olefin Sulphonate Volume (K) Forecast, by Application 2019 & 2032
- Table 57: Global Liquid Alpha Olefin Sulphonate Revenue million Forecast, by Application 2019 & 2032
- Table 58: Global Liquid Alpha Olefin Sulphonate Volume K Forecast, by Application 2019 & 2032
- Table 59: Global Liquid Alpha Olefin Sulphonate Revenue million Forecast, by Types 2019 & 2032
- Table 60: Global Liquid Alpha Olefin Sulphonate Volume K Forecast, by Types 2019 & 2032
- Table 61: Global Liquid Alpha Olefin Sulphonate Revenue million Forecast, by Country 2019 & 2032
- Table 62: Global Liquid Alpha Olefin Sulphonate Volume K Forecast, by Country 2019 & 2032
- Table 63: Turkey Liquid Alpha Olefin Sulphonate Revenue (million) Forecast, by Application 2019 & 2032
- Table 64: Turkey Liquid Alpha Olefin Sulphonate Volume (K) Forecast, by Application 2019 & 2032
- Table 65: Israel Liquid Alpha Olefin Sulphonate Revenue (million) Forecast, by Application 2019 & 2032
- Table 66: Israel Liquid Alpha Olefin Sulphonate Volume (K) Forecast, by Application 2019 & 2032
- Table 67: GCC Liquid Alpha Olefin Sulphonate Revenue (million) Forecast, by Application 2019 & 2032
- Table 68: GCC Liquid Alpha Olefin Sulphonate Volume (K) Forecast, by Application 2019 & 2032
- Table 69: North Africa Liquid Alpha Olefin Sulphonate Revenue (million) Forecast, by Application 2019 & 2032
- Table 70: North Africa Liquid Alpha Olefin Sulphonate Volume (K) Forecast, by Application 2019 & 2032
- Table 71: South Africa Liquid Alpha Olefin Sulphonate Revenue (million) Forecast, by Application 2019 & 2032
- Table 72: South Africa Liquid Alpha Olefin Sulphonate Volume (K) Forecast, by Application 2019 & 2032
- Table 73: Rest of Middle East & Africa Liquid Alpha Olefin Sulphonate Revenue (million) Forecast, by Application 2019 & 2032
- Table 74: Rest of Middle East & Africa Liquid Alpha Olefin Sulphonate Volume (K) Forecast, by Application 2019 & 2032
- Table 75: Global Liquid Alpha Olefin Sulphonate Revenue million Forecast, by Application 2019 & 2032
- Table 76: Global Liquid Alpha Olefin Sulphonate Volume K Forecast, by Application 2019 & 2032
- Table 77: Global Liquid Alpha Olefin Sulphonate Revenue million Forecast, by Types 2019 & 2032
- Table 78: Global Liquid Alpha Olefin Sulphonate Volume K Forecast, by Types 2019 & 2032
- Table 79: Global Liquid Alpha Olefin Sulphonate Revenue million Forecast, by Country 2019 & 2032
- Table 80: Global Liquid Alpha Olefin Sulphonate Volume K Forecast, by Country 2019 & 2032
- Table 81: China Liquid Alpha Olefin Sulphonate Revenue (million) Forecast, by Application 2019 & 2032
- Table 82: China Liquid Alpha Olefin Sulphonate Volume (K) Forecast, by Application 2019 & 2032
- Table 83: India Liquid Alpha Olefin Sulphonate Revenue (million) Forecast, by Application 2019 & 2032
- Table 84: India Liquid Alpha Olefin Sulphonate Volume (K) Forecast, by Application 2019 & 2032
- Table 85: Japan Liquid Alpha Olefin Sulphonate Revenue (million) Forecast, by Application 2019 & 2032
- Table 86: Japan Liquid Alpha Olefin Sulphonate Volume (K) Forecast, by Application 2019 & 2032
- Table 87: South Korea Liquid Alpha Olefin Sulphonate Revenue (million) Forecast, by Application 2019 & 2032
- Table 88: South Korea Liquid Alpha Olefin Sulphonate Volume (K) Forecast, by Application 2019 & 2032
- Table 89: ASEAN Liquid Alpha Olefin Sulphonate Revenue (million) Forecast, by Application 2019 & 2032
- Table 90: ASEAN Liquid Alpha Olefin Sulphonate Volume (K) Forecast, by Application 2019 & 2032
- Table 91: Oceania Liquid Alpha Olefin Sulphonate Revenue (million) Forecast, by Application 2019 & 2032
- Table 92: Oceania Liquid Alpha Olefin Sulphonate Volume (K) Forecast, by Application 2019 & 2032
- Table 93: Rest of Asia Pacific Liquid Alpha Olefin Sulphonate Revenue (million) Forecast, by Application 2019 & 2032
- Table 94: Rest of Asia Pacific Liquid Alpha Olefin Sulphonate Volume (K) Forecast, by Application 2019 & 2032
Frequently Asked Questions
1. What is the projected Compound Annual Growth Rate (CAGR) of the Liquid Alpha Olefin Sulphonate?
The projected CAGR is approximately XX%.
2. Which companies are prominent players in the Liquid Alpha Olefin Sulphonate?
Key companies in the market include Stepan, Aekyung Chemical, Godrej, Pilot Chem, Lion Specialty Chem, Solvay, Taiwan NJC, Innospec Performance Chemicals, Nouryon, Kao Chem, Clariant, Enaspol, Fogla Corp, Colonial Chem, Zanyu Tech, Sinolight Chem, Jujin Chem.
3. What are the main segments of the Liquid Alpha Olefin Sulphonate?
The market segments include Application, Types.
4. Can you provide details about the market size?
The market size is estimated to be USD XXX million as of 2022.
5. What are some drivers contributing to market growth?
N/A
6. What are the notable trends driving market growth?
N/A
7. Are there any restraints impacting market growth?
N/A
8. Can you provide examples of recent developments in the market?
N/A
9. What pricing options are available for accessing the report?
Pricing options include single-user, multi-user, and enterprise licenses priced at USD 3950.00, USD 5925.00, and USD 7900.00 respectively.
10. Is the market size provided in terms of value or volume?
The market size is provided in terms of value, measured in million and volume, measured in K.
11. Are there any specific market keywords associated with the report?
Yes, the market keyword associated with the report is "Liquid Alpha Olefin Sulphonate," which aids in identifying and referencing the specific market segment covered.
12. How do I determine which pricing option suits my needs best?
The pricing options vary based on user requirements and access needs. Individual users may opt for single-user licenses, while businesses requiring broader access may choose multi-user or enterprise licenses for cost-effective access to the report.
13. Are there any additional resources or data provided in the Liquid Alpha Olefin Sulphonate report?
While the report offers comprehensive insights, it's advisable to review the specific contents or supplementary materials provided to ascertain if additional resources or data are available.
14. How can I stay updated on further developments or reports in the Liquid Alpha Olefin Sulphonate?
To stay informed about further developments, trends, and reports in the Liquid Alpha Olefin Sulphonate, consider subscribing to industry newsletters, following relevant companies and organizations, or regularly checking reputable industry news sources and publications.
Methodology
Step 1 - Identification of Relevant Samples Size from Population Database


Step 2 - Approaches for Defining Global Market Size (Value, Volume* & Price*)

Note*: In applicable scenarios
Step 3 - Data Sources
Primary Research
- Web Analytics
- Survey Reports
- Research Institute
- Latest Research Reports
- Opinion Leaders
Secondary Research
- Annual Reports
- White Paper
- Latest Press Release
- Industry Association
- Paid Database
- Investor Presentations

Step 4 - Data Triangulation
Involves using different sources of information in order to increase the validity of a study
These sources are likely to be stakeholders in a program - participants, other researchers, program staff, other community members, and so on.
Then we put all data in single framework & apply various statistical tools to find out the dynamic on the market.
During the analysis stage, feedback from the stakeholder groups would be compared to determine areas of agreement as well as areas of divergence


