Key Insights
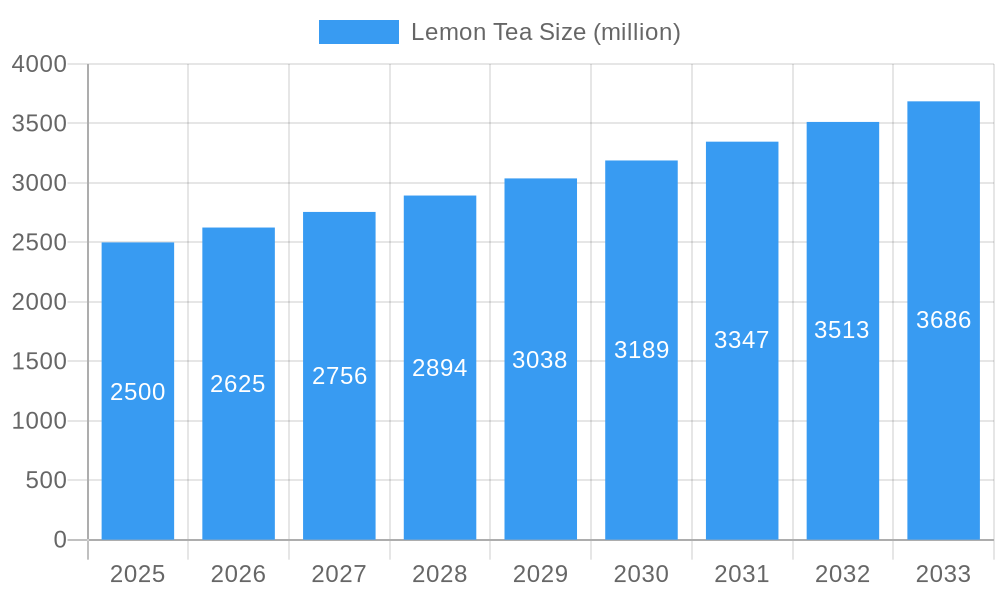
The global lemon tea market is poised for substantial growth, driven by rising consumer preference for healthy and invigorating beverages. Key growth catalysts include the increasing adoption of functional beverages, heightened awareness of the health benefits of lemon and tea (rich in antioxidants and Vitamin C), and the proliferation of health-conscious lifestyles. Consumers are increasingly favoring natural, minimally processed options, fueling demand for diverse lemon tea formats like bottled, canned, and box-packed. The convenience of ready-to-drink (RTD) lemon tea, particularly through online and supermarket channels, further accelerates market expansion. The market is estimated to reach $2.5 billion in 2025, with a projected Compound Annual Growth Rate (CAGR) of approximately 5% from 2025 to 2033. Growth is anticipated across all segments, with the RTD category expected to lead due to its inherent convenience.
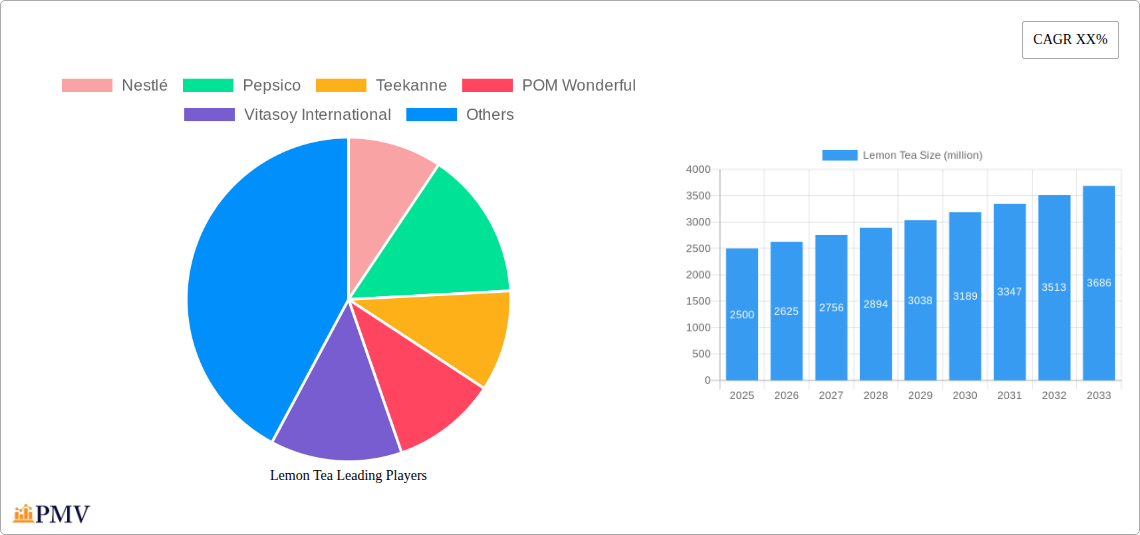
Lemon Tea Market Size (In Billion)
Market restraints include price volatility of raw materials (lemons and tea leaves), intense competition from alternative beverages, and potential challenges in maintaining consistent product quality. Geographical expansion into emerging markets presents both opportunities and hurdles. Leading players are actively investing in product innovation, distribution network enhancement, and targeted marketing to address evolving consumer demands, underscoring a highly competitive market. This competitive pressure is driving product differentiation through unique flavors, organic ingredients, and added health benefits. Market segmentation by application (online, supermarket, store, etc.) and type (canned, box-packed, bottled) enables precise marketing and distribution strategies, crucial for success.
Lemon Tea Company Market Share
Lemon Tea Market Analysis and Forecast (2019-2033)
This comprehensive report offers an in-depth analysis of the global lemon tea market, providing crucial insights for businesses, investors, and stakeholders. Covering the period from 2019 to 2033, with a specific focus on the 2025-2033 forecast, the market is projected to achieve significant growth. This report examines market trends, competitive landscapes, and future potential to deliver actionable intelligence for informed decision-making.
Lemon Tea Market Structure & Competitive Dynamics
The global lemon tea market exhibits a moderately concentrated structure, with key players like Nestlé, Pepsico, Teekanne, POM Wonderful, Vitasoy International, Tata Global Beverages, and Gujarat Tea Processors & Packers holding significant market share. The market is characterized by intense competition, driven by continuous product innovation, aggressive marketing strategies, and strategic mergers and acquisitions (M&A). Over the historical period (2019-2024), M&A activity in the lemon tea sector totaled approximately xx million, with significant deals focused on expanding product portfolios and geographical reach.
The regulatory landscape varies across regions, impacting packaging standards, labeling requirements, and ingredient sourcing. Consumer preferences are shifting towards healthier options, with increasing demand for organic, low-sugar, and functional lemon teas. This is driving innovation in product formulations and packaging, leading to the introduction of new product variants like herbal infusions and ready-to-drink (RTD) options. The emergence of online retail channels presents both opportunities and challenges, requiring companies to adapt their distribution strategies and enhance their e-commerce presence. Substitutes, including other herbal teas and fruit juices, pose a competitive threat, necessitating continuous innovation and differentiation. Market share data for major players in 2024: Nestlé (xx%), Pepsico (xx%), Teekanne (xx%), others (xx%).
Lemon Tea Industry Trends & Insights
The global lemon tea market is experiencing robust growth, driven by several key factors. The rising health consciousness among consumers is boosting demand for healthier beverages, including lemon tea, which is perceived as a refreshing and naturally healthy alternative to sugary drinks. This trend is amplified by the growing awareness of the health benefits of antioxidants and citrus fruits. Technological advancements in processing and packaging are facilitating the production of higher-quality, longer-lasting lemon tea products. The increasing adoption of e-commerce platforms is expanding market access and enhancing consumer convenience. However, fluctuating raw material prices and intense competition pose challenges to market growth. The market's Compound Annual Growth Rate (CAGR) is projected to be xx% during the forecast period (2025-2033), with market penetration expected to reach xx% by 2033.
Dominant Markets & Segments in Lemon Tea
The bottled segment currently dominates the lemon tea market, accounting for xx million in 2024, driven by its convenience and widespread availability. The supermarket channel remains the leading distribution channel, with xx million in revenue in 2024, due to its extensive reach and established consumer base.
Key Drivers for Bottled Segment Dominance:
- Convenience and portability
- Longer shelf life compared to other formats
- Widespread distribution networks
- Established consumer preference
Key Drivers for Supermarket Channel Dominance:
- Established distribution infrastructure
- High consumer foot traffic
- Brand visibility and promotional opportunities
- Broad product assortment
The Asia-Pacific region is anticipated to remain the leading market for lemon tea during the forecast period, fuelled by a large and growing consumer base, increasing disposable incomes, and a rising preference for healthy beverages.
Lemon Tea Product Innovations
Recent innovations in the lemon tea market include the introduction of functional lemon teas enriched with vitamins and minerals, organic and sustainably sourced options, and the use of innovative packaging materials to improve product shelf life and reduce environmental impact. These innovations are driven by consumer demand for healthier and more sustainable products, prompting ongoing competition and market differentiation.
Report Segmentation & Scope
This report segments the lemon tea market by application (Online, Supermarket, Store, Others) and type (Canned, Box-packed, Bottled). Each segment’s market size, growth projections, and competitive dynamics are analyzed in detail. For example, the online segment is expected to witness significant growth during the forecast period, driven by the expanding e-commerce sector and increasing online grocery shopping. The bottled segment holds the largest market share due to its convenience and wide acceptance, while the canned segment offers a cost-effective alternative. The box-packed segment presents another avenue of consumption, catering to specific consumer needs. The "Others" segment includes specialty stores and direct sales.
Key Drivers of Lemon Tea Growth
Key drivers for lemon tea market growth include: increasing health consciousness, changing consumer preferences towards healthier beverages, technological advancements in processing and packaging, expansion of retail channels, and rising disposable incomes in emerging economies. Government regulations promoting healthy lifestyles also contribute to market growth.
Challenges in the Lemon Tea Sector
Challenges in the lemon tea sector include fluctuating raw material prices, intense competition from other beverage categories, stringent regulatory requirements, and potential supply chain disruptions. These factors can impact production costs and profitability. The fluctuating price of tea leaves directly impacts profitability.
Leading Players in the Lemon Tea Market
- Nestlé
- Pepsico
- Teekanne
- POM Wonderful
- Vitasoy International
- Tata Global Beverages
- Gujarat Tea Processors & Packers
Key Developments in Lemon Tea Sector
- 2022 Q4: Nestlé launches a new line of organic lemon tea.
- 2023 Q1: Pepsico introduces a ready-to-drink lemon tea with added functional ingredients.
- 2023 Q3: Teekanne acquires a smaller regional lemon tea producer. (Further specific developments with dates and impact require more data).
Strategic Lemon Tea Market Outlook
The future of the lemon tea market is promising, with continued growth expected across various segments and regions. Strategic opportunities exist for companies to innovate in product formulations, packaging, and distribution channels. Focusing on sustainability, health benefits, and convenient consumption formats will be key to success in this competitive market. The market is expected to maintain its robust growth trajectory in the long term.
Lemon Tea Segmentation
-
1. Application
- 1.1. Online
- 1.2. Supermarket
- 1.3. Store
- 1.4. Others
-
2. Types
- 2.1. Canned
- 2.2. Box-packed
- 2.3. Bottled
Lemon Tea Segmentation By Geography
-
1. North America
- 1.1. United States
- 1.2. Canada
- 1.3. Mexico
-
2. South America
- 2.1. Brazil
- 2.2. Argentina
- 2.3. Rest of South America
-
3. Europe
- 3.1. United Kingdom
- 3.2. Germany
- 3.3. France
- 3.4. Italy
- 3.5. Spain
- 3.6. Russia
- 3.7. Benelux
- 3.8. Nordics
- 3.9. Rest of Europe
-
4. Middle East & Africa
- 4.1. Turkey
- 4.2. Israel
- 4.3. GCC
- 4.4. North Africa
- 4.5. South Africa
- 4.6. Rest of Middle East & Africa
-
5. Asia Pacific
- 5.1. China
- 5.2. India
- 5.3. Japan
- 5.4. South Korea
- 5.5. ASEAN
- 5.6. Oceania
- 5.7. Rest of Asia Pacific
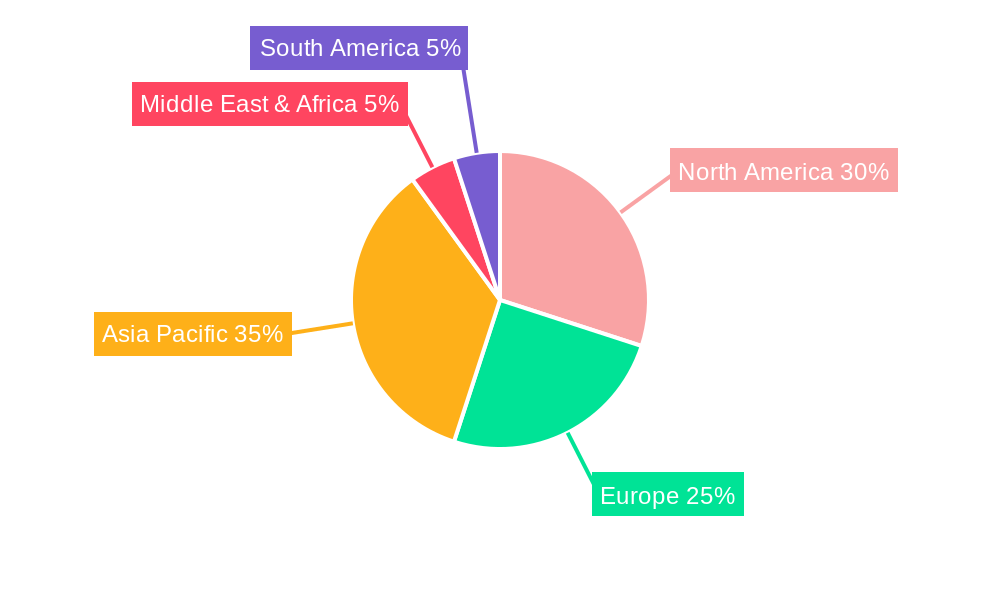
Lemon Tea Regional Market Share
Geographic Coverage of Lemon Tea
Lemon Tea REPORT HIGHLIGHTS
| Aspects | Details |
|---|---|
| Study Period | 2020-2034 |
| Base Year | 2025 |
| Estimated Year | 2026 |
| Forecast Period | 2026-2034 |
| Historical Period | 2020-2025 |
| Growth Rate | CAGR of 6% from 2020-2034 |
| Segmentation |
|
Table of Contents
- 1. Introduction
- 1.1. Research Scope
- 1.2. Market Segmentation
- 1.3. Research Objective
- 1.4. Definitions and Assumptions
- 2. Executive Summary
- 2.1. Market Snapshot
- 3. Market Dynamics
- 3.1. Market Drivers
- 3.2. Market Restrains
- 3.3. Market Trends
- 3.4. Market Opportunities
- 4. Market Factor Analysis
- 4.1. Porters Five Forces
- 4.1.1. Bargaining Power of Suppliers
- 4.1.2. Bargaining Power of Buyers
- 4.1.3. Threat of New Entrants
- 4.1.4. Threat of Substitutes
- 4.1.5. Competitive Rivalry
- 4.2. PESTEL analysis
- 4.3. BCG Analysis
- 4.3.1. Stars (High Growth, High Market Share)
- 4.3.2. Cash Cows (Low Growth, High Market Share)
- 4.3.3. Question Mark (High Growth, Low Market Share)
- 4.3.4. Dogs (Low Growth, Low Market Share)
- 4.4. Ansoff Matrix Analysis
- 4.5. Supply Chain Analysis
- 4.6. Regulatory Landscape
- 4.7. Current Market Potential and Opportunity Assessment (TAM–SAM–SOM Framework)
- 4.8. PMV Analyst Note
- 4.1. Porters Five Forces
- 5. Market Analysis, Insights and Forecast 2021-2033
- 5.1. Market Analysis, Insights and Forecast - by Application
- 5.1.1. Online
- 5.1.2. Supermarket
- 5.1.3. Store
- 5.1.4. Others
- 5.2. Market Analysis, Insights and Forecast - by Types
- 5.2.1. Canned
- 5.2.2. Box-packed
- 5.2.3. Bottled
- 5.3. Market Analysis, Insights and Forecast - by Region
- 5.3.1. North America
- 5.3.2. South America
- 5.3.3. Europe
- 5.3.4. Middle East & Africa
- 5.3.5. Asia Pacific
- 5.1. Market Analysis, Insights and Forecast - by Application
- 6. Global Lemon Tea Analysis, Insights and Forecast, 2021-2033
- 6.1. Market Analysis, Insights and Forecast - by Application
- 6.1.1. Online
- 6.1.2. Supermarket
- 6.1.3. Store
- 6.1.4. Others
- 6.2. Market Analysis, Insights and Forecast - by Types
- 6.2.1. Canned
- 6.2.2. Box-packed
- 6.2.3. Bottled
- 6.1. Market Analysis, Insights and Forecast - by Application
- 7. North America Lemon Tea Analysis, Insights and Forecast, 2020-2032
- 7.1. Market Analysis, Insights and Forecast - by Application
- 7.1.1. Online
- 7.1.2. Supermarket
- 7.1.3. Store
- 7.1.4. Others
- 7.2. Market Analysis, Insights and Forecast - by Types
- 7.2.1. Canned
- 7.2.2. Box-packed
- 7.2.3. Bottled
- 7.1. Market Analysis, Insights and Forecast - by Application
- 8. South America Lemon Tea Analysis, Insights and Forecast, 2020-2032
- 8.1. Market Analysis, Insights and Forecast - by Application
- 8.1.1. Online
- 8.1.2. Supermarket
- 8.1.3. Store
- 8.1.4. Others
- 8.2. Market Analysis, Insights and Forecast - by Types
- 8.2.1. Canned
- 8.2.2. Box-packed
- 8.2.3. Bottled
- 8.1. Market Analysis, Insights and Forecast - by Application
- 9. Europe Lemon Tea Analysis, Insights and Forecast, 2020-2032
- 9.1. Market Analysis, Insights and Forecast - by Application
- 9.1.1. Online
- 9.1.2. Supermarket
- 9.1.3. Store
- 9.1.4. Others
- 9.2. Market Analysis, Insights and Forecast - by Types
- 9.2.1. Canned
- 9.2.2. Box-packed
- 9.2.3. Bottled
- 9.1. Market Analysis, Insights and Forecast - by Application
- 10. Middle East & Africa Lemon Tea Analysis, Insights and Forecast, 2020-2032
- 10.1. Market Analysis, Insights and Forecast - by Application
- 10.1.1. Online
- 10.1.2. Supermarket
- 10.1.3. Store
- 10.1.4. Others
- 10.2. Market Analysis, Insights and Forecast - by Types
- 10.2.1. Canned
- 10.2.2. Box-packed
- 10.2.3. Bottled
- 10.1. Market Analysis, Insights and Forecast - by Application
- 11. Asia Pacific Lemon Tea Analysis, Insights and Forecast, 2020-2032
- 11.1. Market Analysis, Insights and Forecast - by Application
- 11.1.1. Online
- 11.1.2. Supermarket
- 11.1.3. Store
- 11.1.4. Others
- 11.2. Market Analysis, Insights and Forecast - by Types
- 11.2.1. Canned
- 11.2.2. Box-packed
- 11.2.3. Bottled
- 11.1. Market Analysis, Insights and Forecast - by Application
- 12. Competitive Analysis
- 12.1. Company Profiles
- 12.1.1 Nestlé
- 12.1.1.1. Company Overview
- 12.1.1.2. Products
- 12.1.1.3. Company Financials
- 12.1.1.4. SWOT Analysis
- 12.1.2 Pepsico
- 12.1.2.1. Company Overview
- 12.1.2.2. Products
- 12.1.2.3. Company Financials
- 12.1.2.4. SWOT Analysis
- 12.1.3 Teekanne
- 12.1.3.1. Company Overview
- 12.1.3.2. Products
- 12.1.3.3. Company Financials
- 12.1.3.4. SWOT Analysis
- 12.1.4 POM Wonderful
- 12.1.4.1. Company Overview
- 12.1.4.2. Products
- 12.1.4.3. Company Financials
- 12.1.4.4. SWOT Analysis
- 12.1.5 Vitasoy International
- 12.1.5.1. Company Overview
- 12.1.5.2. Products
- 12.1.5.3. Company Financials
- 12.1.5.4. SWOT Analysis
- 12.1.6 Tata Global Beverages
- 12.1.6.1. Company Overview
- 12.1.6.2. Products
- 12.1.6.3. Company Financials
- 12.1.6.4. SWOT Analysis
- 12.1.7 Gujarat Tea Processors & Packers
- 12.1.7.1. Company Overview
- 12.1.7.2. Products
- 12.1.7.3. Company Financials
- 12.1.7.4. SWOT Analysis
- 12.1.1 Nestlé
- 12.2. Market Entropy
- 12.2.1 Company's Key Areas Served
- 12.2.2 Recent Developments
- 12.3. Company Market Share Analysis 2025
- 12.3.1 Top 5 Companies Market Share Analysis
- 12.3.2 Top 3 Companies Market Share Analysis
- 12.4. List of Potential Customers
- 13. Research Methodology
List of Figures
- Figure 1: Global Lemon Tea Revenue Breakdown (billion, %) by Region 2025 & 2033
- Figure 2: Global Lemon Tea Volume Breakdown (K, %) by Region 2025 & 2033
- Figure 3: North America Lemon Tea Revenue (billion), by Application 2025 & 2033
- Figure 4: North America Lemon Tea Volume (K), by Application 2025 & 2033
- Figure 5: North America Lemon Tea Revenue Share (%), by Application 2025 & 2033
- Figure 6: North America Lemon Tea Volume Share (%), by Application 2025 & 2033
- Figure 7: North America Lemon Tea Revenue (billion), by Types 2025 & 2033
- Figure 8: North America Lemon Tea Volume (K), by Types 2025 & 2033
- Figure 9: North America Lemon Tea Revenue Share (%), by Types 2025 & 2033
- Figure 10: North America Lemon Tea Volume Share (%), by Types 2025 & 2033
- Figure 11: North America Lemon Tea Revenue (billion), by Country 2025 & 2033
- Figure 12: North America Lemon Tea Volume (K), by Country 2025 & 2033
- Figure 13: North America Lemon Tea Revenue Share (%), by Country 2025 & 2033
- Figure 14: North America Lemon Tea Volume Share (%), by Country 2025 & 2033
- Figure 15: South America Lemon Tea Revenue (billion), by Application 2025 & 2033
- Figure 16: South America Lemon Tea Volume (K), by Application 2025 & 2033
- Figure 17: South America Lemon Tea Revenue Share (%), by Application 2025 & 2033
- Figure 18: South America Lemon Tea Volume Share (%), by Application 2025 & 2033
- Figure 19: South America Lemon Tea Revenue (billion), by Types 2025 & 2033
- Figure 20: South America Lemon Tea Volume (K), by Types 2025 & 2033
- Figure 21: South America Lemon Tea Revenue Share (%), by Types 2025 & 2033
- Figure 22: South America Lemon Tea Volume Share (%), by Types 2025 & 2033
- Figure 23: South America Lemon Tea Revenue (billion), by Country 2025 & 2033
- Figure 24: South America Lemon Tea Volume (K), by Country 2025 & 2033
- Figure 25: South America Lemon Tea Revenue Share (%), by Country 2025 & 2033
- Figure 26: South America Lemon Tea Volume Share (%), by Country 2025 & 2033
- Figure 27: Europe Lemon Tea Revenue (billion), by Application 2025 & 2033
- Figure 28: Europe Lemon Tea Volume (K), by Application 2025 & 2033
- Figure 29: Europe Lemon Tea Revenue Share (%), by Application 2025 & 2033
- Figure 30: Europe Lemon Tea Volume Share (%), by Application 2025 & 2033
- Figure 31: Europe Lemon Tea Revenue (billion), by Types 2025 & 2033
- Figure 32: Europe Lemon Tea Volume (K), by Types 2025 & 2033
- Figure 33: Europe Lemon Tea Revenue Share (%), by Types 2025 & 2033
- Figure 34: Europe Lemon Tea Volume Share (%), by Types 2025 & 2033
- Figure 35: Europe Lemon Tea Revenue (billion), by Country 2025 & 2033
- Figure 36: Europe Lemon Tea Volume (K), by Country 2025 & 2033
- Figure 37: Europe Lemon Tea Revenue Share (%), by Country 2025 & 2033
- Figure 38: Europe Lemon Tea Volume Share (%), by Country 2025 & 2033
- Figure 39: Middle East & Africa Lemon Tea Revenue (billion), by Application 2025 & 2033
- Figure 40: Middle East & Africa Lemon Tea Volume (K), by Application 2025 & 2033
- Figure 41: Middle East & Africa Lemon Tea Revenue Share (%), by Application 2025 & 2033
- Figure 42: Middle East & Africa Lemon Tea Volume Share (%), by Application 2025 & 2033
- Figure 43: Middle East & Africa Lemon Tea Revenue (billion), by Types 2025 & 2033
- Figure 44: Middle East & Africa Lemon Tea Volume (K), by Types 2025 & 2033
- Figure 45: Middle East & Africa Lemon Tea Revenue Share (%), by Types 2025 & 2033
- Figure 46: Middle East & Africa Lemon Tea Volume Share (%), by Types 2025 & 2033
- Figure 47: Middle East & Africa Lemon Tea Revenue (billion), by Country 2025 & 2033
- Figure 48: Middle East & Africa Lemon Tea Volume (K), by Country 2025 & 2033
- Figure 49: Middle East & Africa Lemon Tea Revenue Share (%), by Country 2025 & 2033
- Figure 50: Middle East & Africa Lemon Tea Volume Share (%), by Country 2025 & 2033
- Figure 51: Asia Pacific Lemon Tea Revenue (billion), by Application 2025 & 2033
- Figure 52: Asia Pacific Lemon Tea Volume (K), by Application 2025 & 2033
- Figure 53: Asia Pacific Lemon Tea Revenue Share (%), by Application 2025 & 2033
- Figure 54: Asia Pacific Lemon Tea Volume Share (%), by Application 2025 & 2033
- Figure 55: Asia Pacific Lemon Tea Revenue (billion), by Types 2025 & 2033
- Figure 56: Asia Pacific Lemon Tea Volume (K), by Types 2025 & 2033
- Figure 57: Asia Pacific Lemon Tea Revenue Share (%), by Types 2025 & 2033
- Figure 58: Asia Pacific Lemon Tea Volume Share (%), by Types 2025 & 2033
- Figure 59: Asia Pacific Lemon Tea Revenue (billion), by Country 2025 & 2033
- Figure 60: Asia Pacific Lemon Tea Volume (K), by Country 2025 & 2033
- Figure 61: Asia Pacific Lemon Tea Revenue Share (%), by Country 2025 & 2033
- Figure 62: Asia Pacific Lemon Tea Volume Share (%), by Country 2025 & 2033
List of Tables
- Table 1: Global Lemon Tea Revenue billion Forecast, by Application 2020 & 2033
- Table 2: Global Lemon Tea Volume K Forecast, by Application 2020 & 2033
- Table 3: Global Lemon Tea Revenue billion Forecast, by Types 2020 & 2033
- Table 4: Global Lemon Tea Volume K Forecast, by Types 2020 & 2033
- Table 5: Global Lemon Tea Revenue billion Forecast, by Region 2020 & 2033
- Table 6: Global Lemon Tea Volume K Forecast, by Region 2020 & 2033
- Table 7: Global Lemon Tea Revenue billion Forecast, by Application 2020 & 2033
- Table 8: Global Lemon Tea Volume K Forecast, by Application 2020 & 2033
- Table 9: Global Lemon Tea Revenue billion Forecast, by Types 2020 & 2033
- Table 10: Global Lemon Tea Volume K Forecast, by Types 2020 & 2033
- Table 11: Global Lemon Tea Revenue billion Forecast, by Country 2020 & 2033
- Table 12: Global Lemon Tea Volume K Forecast, by Country 2020 & 2033
- Table 13: United States Lemon Tea Revenue (billion) Forecast, by Application 2020 & 2033
- Table 14: United States Lemon Tea Volume (K) Forecast, by Application 2020 & 2033
- Table 15: Canada Lemon Tea Revenue (billion) Forecast, by Application 2020 & 2033
- Table 16: Canada Lemon Tea Volume (K) Forecast, by Application 2020 & 2033
- Table 17: Mexico Lemon Tea Revenue (billion) Forecast, by Application 2020 & 2033
- Table 18: Mexico Lemon Tea Volume (K) Forecast, by Application 2020 & 2033
- Table 19: Global Lemon Tea Revenue billion Forecast, by Application 2020 & 2033
- Table 20: Global Lemon Tea Volume K Forecast, by Application 2020 & 2033
- Table 21: Global Lemon Tea Revenue billion Forecast, by Types 2020 & 2033
- Table 22: Global Lemon Tea Volume K Forecast, by Types 2020 & 2033
- Table 23: Global Lemon Tea Revenue billion Forecast, by Country 2020 & 2033
- Table 24: Global Lemon Tea Volume K Forecast, by Country 2020 & 2033
- Table 25: Brazil Lemon Tea Revenue (billion) Forecast, by Application 2020 & 2033
- Table 26: Brazil Lemon Tea Volume (K) Forecast, by Application 2020 & 2033
- Table 27: Argentina Lemon Tea Revenue (billion) Forecast, by Application 2020 & 2033
- Table 28: Argentina Lemon Tea Volume (K) Forecast, by Application 2020 & 2033
- Table 29: Rest of South America Lemon Tea Revenue (billion) Forecast, by Application 2020 & 2033
- Table 30: Rest of South America Lemon Tea Volume (K) Forecast, by Application 2020 & 2033
- Table 31: Global Lemon Tea Revenue billion Forecast, by Application 2020 & 2033
- Table 32: Global Lemon Tea Volume K Forecast, by Application 2020 & 2033
- Table 33: Global Lemon Tea Revenue billion Forecast, by Types 2020 & 2033
- Table 34: Global Lemon Tea Volume K Forecast, by Types 2020 & 2033
- Table 35: Global Lemon Tea Revenue billion Forecast, by Country 2020 & 2033
- Table 36: Global Lemon Tea Volume K Forecast, by Country 2020 & 2033
- Table 37: United Kingdom Lemon Tea Revenue (billion) Forecast, by Application 2020 & 2033
- Table 38: United Kingdom Lemon Tea Volume (K) Forecast, by Application 2020 & 2033
- Table 39: Germany Lemon Tea Revenue (billion) Forecast, by Application 2020 & 2033
- Table 40: Germany Lemon Tea Volume (K) Forecast, by Application 2020 & 2033
- Table 41: France Lemon Tea Revenue (billion) Forecast, by Application 2020 & 2033
- Table 42: France Lemon Tea Volume (K) Forecast, by Application 2020 & 2033
- Table 43: Italy Lemon Tea Revenue (billion) Forecast, by Application 2020 & 2033
- Table 44: Italy Lemon Tea Volume (K) Forecast, by Application 2020 & 2033
- Table 45: Spain Lemon Tea Revenue (billion) Forecast, by Application 2020 & 2033
- Table 46: Spain Lemon Tea Volume (K) Forecast, by Application 2020 & 2033
- Table 47: Russia Lemon Tea Revenue (billion) Forecast, by Application 2020 & 2033
- Table 48: Russia Lemon Tea Volume (K) Forecast, by Application 2020 & 2033
- Table 49: Benelux Lemon Tea Revenue (billion) Forecast, by Application 2020 & 2033
- Table 50: Benelux Lemon Tea Volume (K) Forecast, by Application 2020 & 2033
- Table 51: Nordics Lemon Tea Revenue (billion) Forecast, by Application 2020 & 2033
- Table 52: Nordics Lemon Tea Volume (K) Forecast, by Application 2020 & 2033
- Table 53: Rest of Europe Lemon Tea Revenue (billion) Forecast, by Application 2020 & 2033
- Table 54: Rest of Europe Lemon Tea Volume (K) Forecast, by Application 2020 & 2033
- Table 55: Global Lemon Tea Revenue billion Forecast, by Application 2020 & 2033
- Table 56: Global Lemon Tea Volume K Forecast, by Application 2020 & 2033
- Table 57: Global Lemon Tea Revenue billion Forecast, by Types 2020 & 2033
- Table 58: Global Lemon Tea Volume K Forecast, by Types 2020 & 2033
- Table 59: Global Lemon Tea Revenue billion Forecast, by Country 2020 & 2033
- Table 60: Global Lemon Tea Volume K Forecast, by Country 2020 & 2033
- Table 61: Turkey Lemon Tea Revenue (billion) Forecast, by Application 2020 & 2033
- Table 62: Turkey Lemon Tea Volume (K) Forecast, by Application 2020 & 2033
- Table 63: Israel Lemon Tea Revenue (billion) Forecast, by Application 2020 & 2033
- Table 64: Israel Lemon Tea Volume (K) Forecast, by Application 2020 & 2033
- Table 65: GCC Lemon Tea Revenue (billion) Forecast, by Application 2020 & 2033
- Table 66: GCC Lemon Tea Volume (K) Forecast, by Application 2020 & 2033
- Table 67: North Africa Lemon Tea Revenue (billion) Forecast, by Application 2020 & 2033
- Table 68: North Africa Lemon Tea Volume (K) Forecast, by Application 2020 & 2033
- Table 69: South Africa Lemon Tea Revenue (billion) Forecast, by Application 2020 & 2033
- Table 70: South Africa Lemon Tea Volume (K) Forecast, by Application 2020 & 2033
- Table 71: Rest of Middle East & Africa Lemon Tea Revenue (billion) Forecast, by Application 2020 & 2033
- Table 72: Rest of Middle East & Africa Lemon Tea Volume (K) Forecast, by Application 2020 & 2033
- Table 73: Global Lemon Tea Revenue billion Forecast, by Application 2020 & 2033
- Table 74: Global Lemon Tea Volume K Forecast, by Application 2020 & 2033
- Table 75: Global Lemon Tea Revenue billion Forecast, by Types 2020 & 2033
- Table 76: Global Lemon Tea Volume K Forecast, by Types 2020 & 2033
- Table 77: Global Lemon Tea Revenue billion Forecast, by Country 2020 & 2033
- Table 78: Global Lemon Tea Volume K Forecast, by Country 2020 & 2033
- Table 79: China Lemon Tea Revenue (billion) Forecast, by Application 2020 & 2033
- Table 80: China Lemon Tea Volume (K) Forecast, by Application 2020 & 2033
- Table 81: India Lemon Tea Revenue (billion) Forecast, by Application 2020 & 2033
- Table 82: India Lemon Tea Volume (K) Forecast, by Application 2020 & 2033
- Table 83: Japan Lemon Tea Revenue (billion) Forecast, by Application 2020 & 2033
- Table 84: Japan Lemon Tea Volume (K) Forecast, by Application 2020 & 2033
- Table 85: South Korea Lemon Tea Revenue (billion) Forecast, by Application 2020 & 2033
- Table 86: South Korea Lemon Tea Volume (K) Forecast, by Application 2020 & 2033
- Table 87: ASEAN Lemon Tea Revenue (billion) Forecast, by Application 2020 & 2033
- Table 88: ASEAN Lemon Tea Volume (K) Forecast, by Application 2020 & 2033
- Table 89: Oceania Lemon Tea Revenue (billion) Forecast, by Application 2020 & 2033
- Table 90: Oceania Lemon Tea Volume (K) Forecast, by Application 2020 & 2033
- Table 91: Rest of Asia Pacific Lemon Tea Revenue (billion) Forecast, by Application 2020 & 2033
- Table 92: Rest of Asia Pacific Lemon Tea Volume (K) Forecast, by Application 2020 & 2033
Frequently Asked Questions
1. What is the projected Compound Annual Growth Rate (CAGR) of the Lemon Tea?
The projected CAGR is approximately 6%.
2. Which companies are prominent players in the Lemon Tea?
Key companies in the market include Nestlé, Pepsico, Teekanne, POM Wonderful, Vitasoy International, Tata Global Beverages, Gujarat Tea Processors & Packers.
3. What are the main segments of the Lemon Tea?
The market segments include Application, Types.
4. Can you provide details about the market size?
The market size is estimated to be USD 5 billion as of 2022.
5. What are some drivers contributing to market growth?
N/A
6. What are the notable trends driving market growth?
N/A
7. Are there any restraints impacting market growth?
N/A
8. Can you provide examples of recent developments in the market?
N/A
9. What pricing options are available for accessing the report?
Pricing options include single-user, multi-user, and enterprise licenses priced at USD 3350.00, USD 5025.00, and USD 6700.00 respectively.
10. Is the market size provided in terms of value or volume?
The market size is provided in terms of value, measured in billion and volume, measured in K.
11. Are there any specific market keywords associated with the report?
Yes, the market keyword associated with the report is "Lemon Tea," which aids in identifying and referencing the specific market segment covered.
12. How do I determine which pricing option suits my needs best?
The pricing options vary based on user requirements and access needs. Individual users may opt for single-user licenses, while businesses requiring broader access may choose multi-user or enterprise licenses for cost-effective access to the report.
13. Are there any additional resources or data provided in the Lemon Tea report?
While the report offers comprehensive insights, it's advisable to review the specific contents or supplementary materials provided to ascertain if additional resources or data are available.
14. How can I stay updated on further developments or reports in the Lemon Tea?
To stay informed about further developments, trends, and reports in the Lemon Tea, consider subscribing to industry newsletters, following relevant companies and organizations, or regularly checking reputable industry news sources and publications.
Methodology
Step 1 - Identification of Relevant Samples Size from Population Database


Step 2 - Approaches for Defining Global Market Size (Value, Volume* & Price*)

Note*: In applicable scenarios
Step 3 - Data Sources
Primary Research
- Web Analytics
- Survey Reports
- Research Institute
- Latest Research Reports
- Opinion Leaders
Secondary Research
- Annual Reports
- White Paper
- Latest Press Release
- Industry Association
- Paid Database
- Investor Presentations

Step 4 - Data Triangulation
Involves using different sources of information in order to increase the validity of a study
These sources are likely to be stakeholders in a program - participants, other researchers, program staff, other community members, and so on.
Then we put all data in single framework & apply various statistical tools to find out the dynamic on the market.
During the analysis stage, feedback from the stakeholder groups would be compared to determine areas of agreement as well as areas of divergence

