
Key Insights
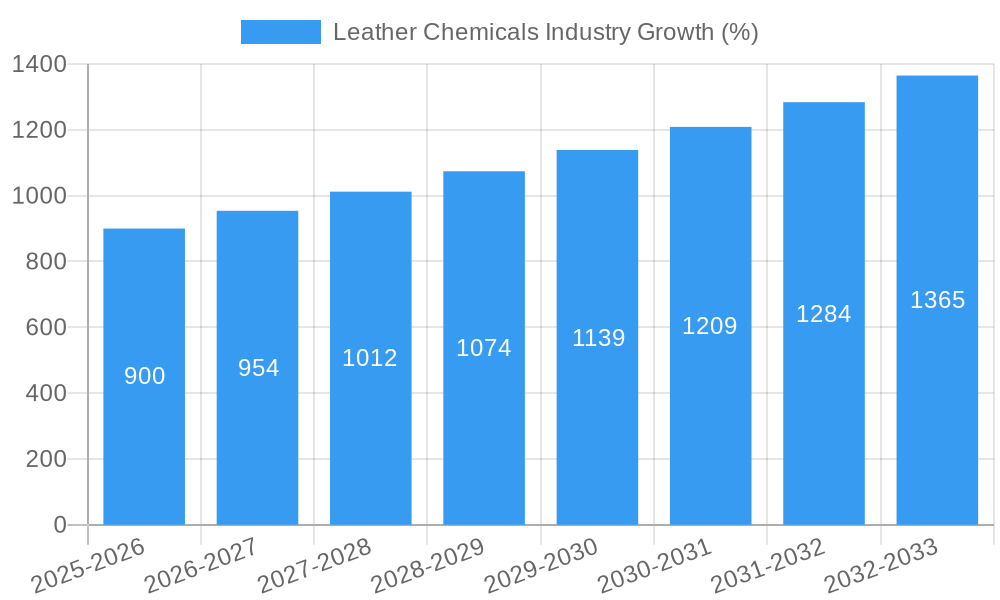
The global leather chemicals market, currently experiencing robust growth with a CAGR exceeding 6%, is projected to reach a significant value in the coming years. This expansion is fueled by several key drivers. The burgeoning fashion and footwear industries, coupled with rising consumer demand for high-quality leather products, create a strong foundation for market expansion. Technological advancements in leather processing, leading to improved efficiency and reduced environmental impact, further contribute to this growth. Sustainability concerns are also shaping the market, with increased focus on eco-friendly tanning agents and reduced water consumption in leather production. The market is segmented by various chemical types (e.g., tanning agents, retanning agents, finishing agents), application (e.g., footwear, apparel, automotive), and geographical region. Leading players like Balmer Lawrie, Clariant, and Stahl International are actively investing in research and development to cater to evolving industry needs and stringent environmental regulations.
While the market enjoys positive growth momentum, certain challenges persist. Fluctuations in raw material prices, particularly for key ingredients like chromium and vegetable tannins, can impact profitability. Furthermore, stricter environmental regulations in certain regions may necessitate significant capital investments for compliance, potentially hindering smaller players. Nevertheless, the long-term outlook remains optimistic, driven by continuous innovation in leather processing techniques, increasing consumer awareness regarding sustainable practices, and the enduring appeal of leather products across diverse applications. The market is anticipated to experience steady expansion throughout the forecast period (2025-2033), with specific segments, like those focused on sustainable leather production, demonstrating particularly strong growth.
Leather Chemicals Industry: A Comprehensive Market Report (2019-2033)
This comprehensive report provides a detailed analysis of the global Leather Chemicals industry, covering market structure, competitive dynamics, growth drivers, challenges, and future outlook. The study period spans from 2019 to 2033, with 2025 as the base and estimated year. The report offers actionable insights for industry stakeholders, including manufacturers, suppliers, distributors, and investors. The global market size is projected to reach xx Million by 2033, exhibiting a CAGR of xx% during the forecast period (2025-2033).

Leather Chemicals Industry Market Structure & Competitive Dynamics
The Leather Chemicals industry exhibits a moderately consolidated market structure, with several multinational corporations and regional players competing for market share. Key players such as Clariant, Lanxess, Stahl International BV, and Elementis PLC hold significant market share, estimated at a combined xx%. However, numerous smaller players contribute to the overall market volume.
The industry’s innovation ecosystem is dynamic, with ongoing R&D efforts focused on developing sustainable and high-performance leather chemicals. Stringent environmental regulations are shaping the industry's trajectory, driving the adoption of eco-friendly products and processes. Product substitutes, such as synthetic leather alternatives, pose a competitive threat, although leather's natural properties and aesthetic appeal continue to ensure its relevance.
End-user trends, such as a growing preference for sustainable and ethically sourced leather products, are influencing the demand for environmentally friendly leather chemicals. M&A activities have been relatively moderate in recent years, with deal values averaging approximately xx Million annually. However, strategic acquisitions are expected to increase as companies seek to expand their product portfolios and market reach. The competitive landscape is further shaped by factors such as pricing strategies, distribution networks, and brand reputation.
- Market Concentration: Moderately Consolidated
- Innovation Ecosystem: Dynamic, focused on sustainability
- Regulatory Framework: Stringent environmental regulations
- Product Substitutes: Synthetic leather alternatives
- M&A Activity: Moderate, with average deal values of xx Million annually.
Leather Chemicals Industry Industry Trends & Insights
The Leather Chemicals industry is experiencing significant growth driven by the increasing demand for leather products globally. The rising disposable incomes in emerging economies, coupled with changing fashion trends, are fueling market expansion. Technological advancements in leather processing, leading to improved efficiency and product quality, further contribute to market growth. However, fluctuating raw material prices and environmental concerns present challenges.
Consumer preferences are shifting towards sustainable and eco-friendly leather products, creating opportunities for companies offering bio-based and low-impact leather chemicals. The industry is witnessing technological disruptions, with the adoption of advanced technologies such as nanotechnology and biotechnology for developing improved chemicals. Competitive dynamics are marked by innovation, sustainability initiatives, and strategic partnerships. The global market is expected to grow at a CAGR of xx% during the forecast period, with a market penetration rate of xx% by 2033 in key segments.
Dominant Markets & Segments in Leather Chemicals Industry
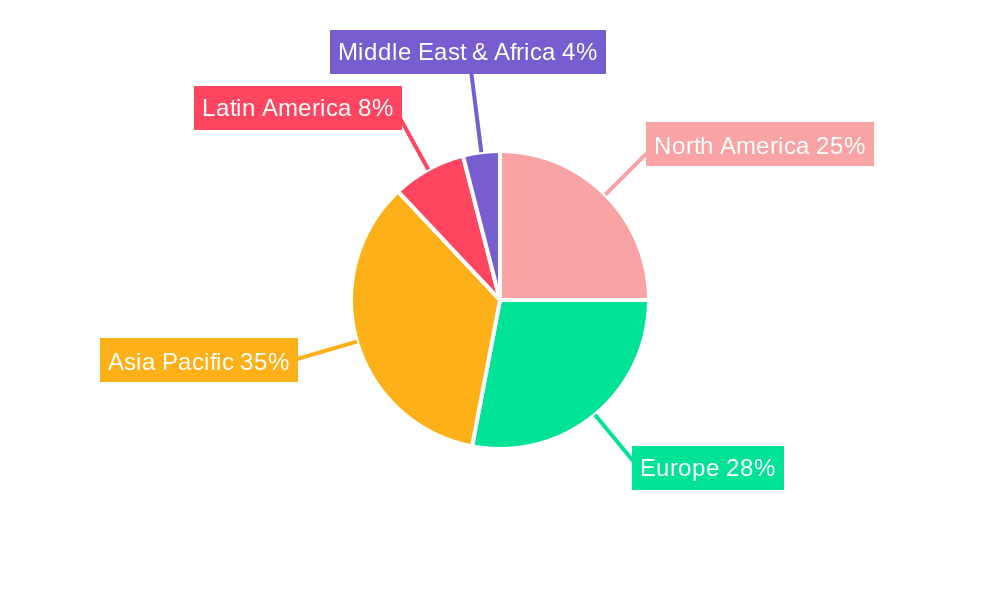
The Asia-Pacific region, particularly China and India, dominates the global Leather Chemicals market due to its large leather manufacturing base and expanding footwear and apparel industries. This dominance is primarily driven by:
- Economic Policies: Government support for the leather industry in several Asian countries.
- Infrastructure: Availability of raw materials, skilled labor, and manufacturing facilities.
- Strong Domestic Demand: Growing consumption of leather goods within the region itself.
Europe and North America also hold significant market shares, driven by high consumer demand and established leather goods industries. However, the Asia-Pacific region's rapid growth is expected to further solidify its leadership position during the forecast period. Detailed analysis indicates that the footwear segment holds the largest market share, followed by the apparel and upholstery segments.
Leather Chemicals Industry Product Innovations
Recent innovations in leather chemicals focus on improving performance characteristics while minimizing environmental impact. This includes the development of bio-based alternatives to traditional chemicals, enhanced dyeing technologies for improved color fastness and reduced water consumption, and innovative finishing agents for improved durability and softness. These innovations cater to the growing demand for sustainable and high-quality leather products. The market increasingly favors chemicals with reduced VOC emissions, enhanced biodegradability, and lower toxicity profiles, aligning with global environmental regulations.
Report Segmentation & Scope
This report segments the Leather Chemicals market based on several key criteria:
By Chemical Type: This includes retanning agents, fatliquors, dyes, and finishing agents. Growth projections vary depending on the specific type and application, driven by varying demand and technological advancements.
By Application: This encompasses footwear, apparel, upholstery, and automotive applications. The footwear segment is currently the largest, with robust growth expected across all segments due to increasing leather product demand. Competitive dynamics are influenced by factors such as cost-effectiveness and performance attributes.
By Region: The market is segmented into North America, Europe, Asia-Pacific, and Rest of the World. Growth varies significantly by region, with Asia-Pacific demonstrating the most substantial potential.
Key Drivers of Leather Chemicals Industry Growth
Several factors drive the growth of the Leather Chemicals industry:
- Rising Demand for Leather Goods: Growing global consumption of leather products, particularly in emerging economies.
- Technological Advancements: Development of high-performance, eco-friendly leather chemicals.
- Stringent Environmental Regulations: Increasing pressure to adopt sustainable manufacturing processes.
Challenges in the Leather Chemicals Industry Sector
The Leather Chemicals industry faces several challenges:
- Fluctuating Raw Material Prices: Volatility in the prices of key raw materials can significantly impact production costs.
- Environmental Regulations: Compliance with stringent environmental regulations requires substantial investments in technology and processes.
- Competition from Synthetic Alternatives: Synthetic leather materials pose a growing threat to the traditional leather industry.
Leading Players in the Leather Chemicals Industry Market
- Balmer Lawrie Co Ltd
- Chemtan Company
- Clariant
- DyStar Group
- Elementis PLC
- Indofil Industries Ltd
- Lanxess
- Papertex Specialty Chemicals Pvt Ltd
- Schill Seilacher GmbH Co
- Stahl International BV
- TASA Group International
- TEXAPEL
- Zschimmer Schwarz Co KG
Key Developments in Leather Chemicals Industry Sector
- October 2022: Texapel received ZDHC Level 3 certification for its leather chemicals, signifying a commitment to sustainability.
- January 2023: LANXESS partnered with TotalEnergies to supply bio-circular styrene, promoting sustainable raw materials in the industry.
Strategic Leather Chemicals Industry Market Outlook
The future of the Leather Chemicals industry is bright, with growth projected to continue driven by increasing demand for leather products, advancements in sustainable technologies, and strategic partnerships. Companies focusing on innovation, sustainability, and efficient supply chains are expected to gain a competitive edge. The market presents significant opportunities for manufacturers and suppliers to capitalize on emerging trends and meet the evolving needs of the industry.
Leather Chemicals Industry Segmentation
-
1. Product Type
- 1.1. Tanning and Dyeing Chemicals
- 1.2. Beam House Chemicals
- 1.3. Finishing Chemicals
-
2. End-user Industry
- 2.1. Footwear
- 2.2. Furniture
- 2.3. Automotive
- 2.4. Textile & Fashion
- 2.5. Other End-user Industries
Leather Chemicals Industry Segmentation By Geography
-
1. Asia Pacific
- 1.1. China
- 1.2. India
- 1.3. Japan
- 1.4. South Korea
- 1.5. Rest of Asia Pacific
-
2. North America
- 2.1. United States
- 2.2. Canada
- 2.3. Mexico
-
3. Europe
- 3.1. Germany
- 3.2. United Kingdom
- 3.3. Italy
- 3.4. France
- 3.5. Spain
- 3.6. Rest of Europe
-
4. South America
- 4.1. Brazil
- 4.2. Argentina
- 4.3. Rest of South America
- 5. Middle East
-
6. Saudi Arabia
- 6.1. South Africa
- 6.2. Rest of Middle East
Leather Chemicals Industry REPORT HIGHLIGHTS
| Aspects | Details |
|---|---|
| Study Period | 2019-2033 |
| Base Year | 2024 |
| Estimated Year | 2025 |
| Forecast Period | 2025-2033 |
| Historical Period | 2019-2024 |
| Growth Rate | CAGR of > 6.00% from 2019-2033 |
| Segmentation |
|
Table of Contents
- 1. Introduction
- 1.1. Research Scope
- 1.2. Market Segmentation
- 1.3. Research Methodology
- 1.4. Definitions and Assumptions
- 2. Executive Summary
- 2.1. Introduction
- 3. Market Dynamics
- 3.1. Introduction
- 3.2. Market Drivers
- 3.2.1. Growing Footwear and Textile Industries in Asia-Pacific; Increasing Demand for Automotive Upholstery
- 3.3. Market Restrains
- 3.3.1. Growing Footwear and Textile Industries in Asia-Pacific; Increasing Demand for Automotive Upholstery
- 3.4. Market Trends
- 3.4.1. Textile Industry to Witness Higher Potential Growth
- 4. Market Factor Analysis
- 4.1. Porters Five Forces
- 4.2. Supply/Value Chain
- 4.3. PESTEL analysis
- 4.4. Market Entropy
- 4.5. Patent/Trademark Analysis
- 5. Global Leather Chemicals Industry Analysis, Insights and Forecast, 2019-2031
- 5.1. Market Analysis, Insights and Forecast - by Product Type
- 5.1.1. Tanning and Dyeing Chemicals
- 5.1.2. Beam House Chemicals
- 5.1.3. Finishing Chemicals
- 5.2. Market Analysis, Insights and Forecast - by End-user Industry
- 5.2.1. Footwear
- 5.2.2. Furniture
- 5.2.3. Automotive
- 5.2.4. Textile & Fashion
- 5.2.5. Other End-user Industries
- 5.3. Market Analysis, Insights and Forecast - by Region
- 5.3.1. Asia Pacific
- 5.3.2. North America
- 5.3.3. Europe
- 5.3.4. South America
- 5.3.5. Middle East
- 5.3.6. Saudi Arabia
- 5.1. Market Analysis, Insights and Forecast - by Product Type
- 6. Asia Pacific Leather Chemicals Industry Analysis, Insights and Forecast, 2019-2031
- 6.1. Market Analysis, Insights and Forecast - by Product Type
- 6.1.1. Tanning and Dyeing Chemicals
- 6.1.2. Beam House Chemicals
- 6.1.3. Finishing Chemicals
- 6.2. Market Analysis, Insights and Forecast - by End-user Industry
- 6.2.1. Footwear
- 6.2.2. Furniture
- 6.2.3. Automotive
- 6.2.4. Textile & Fashion
- 6.2.5. Other End-user Industries
- 6.1. Market Analysis, Insights and Forecast - by Product Type
- 7. North America Leather Chemicals Industry Analysis, Insights and Forecast, 2019-2031
- 7.1. Market Analysis, Insights and Forecast - by Product Type
- 7.1.1. Tanning and Dyeing Chemicals
- 7.1.2. Beam House Chemicals
- 7.1.3. Finishing Chemicals
- 7.2. Market Analysis, Insights and Forecast - by End-user Industry
- 7.2.1. Footwear
- 7.2.2. Furniture
- 7.2.3. Automotive
- 7.2.4. Textile & Fashion
- 7.2.5. Other End-user Industries
- 7.1. Market Analysis, Insights and Forecast - by Product Type
- 8. Europe Leather Chemicals Industry Analysis, Insights and Forecast, 2019-2031
- 8.1. Market Analysis, Insights and Forecast - by Product Type
- 8.1.1. Tanning and Dyeing Chemicals
- 8.1.2. Beam House Chemicals
- 8.1.3. Finishing Chemicals
- 8.2. Market Analysis, Insights and Forecast - by End-user Industry
- 8.2.1. Footwear
- 8.2.2. Furniture
- 8.2.3. Automotive
- 8.2.4. Textile & Fashion
- 8.2.5. Other End-user Industries
- 8.1. Market Analysis, Insights and Forecast - by Product Type
- 9. South America Leather Chemicals Industry Analysis, Insights and Forecast, 2019-2031
- 9.1. Market Analysis, Insights and Forecast - by Product Type
- 9.1.1. Tanning and Dyeing Chemicals
- 9.1.2. Beam House Chemicals
- 9.1.3. Finishing Chemicals
- 9.2. Market Analysis, Insights and Forecast - by End-user Industry
- 9.2.1. Footwear
- 9.2.2. Furniture
- 9.2.3. Automotive
- 9.2.4. Textile & Fashion
- 9.2.5. Other End-user Industries
- 9.1. Market Analysis, Insights and Forecast - by Product Type
- 10. Middle East Leather Chemicals Industry Analysis, Insights and Forecast, 2019-2031
- 10.1. Market Analysis, Insights and Forecast - by Product Type
- 10.1.1. Tanning and Dyeing Chemicals
- 10.1.2. Beam House Chemicals
- 10.1.3. Finishing Chemicals
- 10.2. Market Analysis, Insights and Forecast - by End-user Industry
- 10.2.1. Footwear
- 10.2.2. Furniture
- 10.2.3. Automotive
- 10.2.4. Textile & Fashion
- 10.2.5. Other End-user Industries
- 10.1. Market Analysis, Insights and Forecast - by Product Type
- 11. Saudi Arabia Leather Chemicals Industry Analysis, Insights and Forecast, 2019-2031
- 11.1. Market Analysis, Insights and Forecast - by Product Type
- 11.1.1. Tanning and Dyeing Chemicals
- 11.1.2. Beam House Chemicals
- 11.1.3. Finishing Chemicals
- 11.2. Market Analysis, Insights and Forecast - by End-user Industry
- 11.2.1. Footwear
- 11.2.2. Furniture
- 11.2.3. Automotive
- 11.2.4. Textile & Fashion
- 11.2.5. Other End-user Industries
- 11.1. Market Analysis, Insights and Forecast - by Product Type
- 12. Competitive Analysis
- 12.1. Global Market Share Analysis 2024
- 12.2. Company Profiles
- 12.2.1 Balmer Lawrie Co Ltd
- 12.2.1.1. Overview
- 12.2.1.2. Products
- 12.2.1.3. SWOT Analysis
- 12.2.1.4. Recent Developments
- 12.2.1.5. Financials (Based on Availability)
- 12.2.2 Chemtan Company
- 12.2.2.1. Overview
- 12.2.2.2. Products
- 12.2.2.3. SWOT Analysis
- 12.2.2.4. Recent Developments
- 12.2.2.5. Financials (Based on Availability)
- 12.2.3 Clariant
- 12.2.3.1. Overview
- 12.2.3.2. Products
- 12.2.3.3. SWOT Analysis
- 12.2.3.4. Recent Developments
- 12.2.3.5. Financials (Based on Availability)
- 12.2.4 DyStar Group
- 12.2.4.1. Overview
- 12.2.4.2. Products
- 12.2.4.3. SWOT Analysis
- 12.2.4.4. Recent Developments
- 12.2.4.5. Financials (Based on Availability)
- 12.2.5 Elementis PLC
- 12.2.5.1. Overview
- 12.2.5.2. Products
- 12.2.5.3. SWOT Analysis
- 12.2.5.4. Recent Developments
- 12.2.5.5. Financials (Based on Availability)
- 12.2.6 Indofil Industries Ltd
- 12.2.6.1. Overview
- 12.2.6.2. Products
- 12.2.6.3. SWOT Analysis
- 12.2.6.4. Recent Developments
- 12.2.6.5. Financials (Based on Availability)
- 12.2.7 Lanxess
- 12.2.7.1. Overview
- 12.2.7.2. Products
- 12.2.7.3. SWOT Analysis
- 12.2.7.4. Recent Developments
- 12.2.7.5. Financials (Based on Availability)
- 12.2.8 Papertex Specialty Chemicals Pvt Ltd
- 12.2.8.1. Overview
- 12.2.8.2. Products
- 12.2.8.3. SWOT Analysis
- 12.2.8.4. Recent Developments
- 12.2.8.5. Financials (Based on Availability)
- 12.2.9 Schill Seilacher GmbH Co
- 12.2.9.1. Overview
- 12.2.9.2. Products
- 12.2.9.3. SWOT Analysis
- 12.2.9.4. Recent Developments
- 12.2.9.5. Financials (Based on Availability)
- 12.2.10 Stahl International BV
- 12.2.10.1. Overview
- 12.2.10.2. Products
- 12.2.10.3. SWOT Analysis
- 12.2.10.4. Recent Developments
- 12.2.10.5. Financials (Based on Availability)
- 12.2.11 TASA Group International
- 12.2.11.1. Overview
- 12.2.11.2. Products
- 12.2.11.3. SWOT Analysis
- 12.2.11.4. Recent Developments
- 12.2.11.5. Financials (Based on Availability)
- 12.2.12 TEXAPEL
- 12.2.12.1. Overview
- 12.2.12.2. Products
- 12.2.12.3. SWOT Analysis
- 12.2.12.4. Recent Developments
- 12.2.12.5. Financials (Based on Availability)
- 12.2.13 Zschimmer Schwarz Co KG*List Not Exhaustive
- 12.2.13.1. Overview
- 12.2.13.2. Products
- 12.2.13.3. SWOT Analysis
- 12.2.13.4. Recent Developments
- 12.2.13.5. Financials (Based on Availability)
- 12.2.1 Balmer Lawrie Co Ltd
List of Figures
- Figure 1: Global Leather Chemicals Industry Revenue Breakdown (Million, %) by Region 2024 & 2032
- Figure 2: Asia Pacific Leather Chemicals Industry Revenue (Million), by Product Type 2024 & 2032
- Figure 3: Asia Pacific Leather Chemicals Industry Revenue Share (%), by Product Type 2024 & 2032
- Figure 4: Asia Pacific Leather Chemicals Industry Revenue (Million), by End-user Industry 2024 & 2032
- Figure 5: Asia Pacific Leather Chemicals Industry Revenue Share (%), by End-user Industry 2024 & 2032
- Figure 6: Asia Pacific Leather Chemicals Industry Revenue (Million), by Country 2024 & 2032
- Figure 7: Asia Pacific Leather Chemicals Industry Revenue Share (%), by Country 2024 & 2032
- Figure 8: North America Leather Chemicals Industry Revenue (Million), by Product Type 2024 & 2032
- Figure 9: North America Leather Chemicals Industry Revenue Share (%), by Product Type 2024 & 2032
- Figure 10: North America Leather Chemicals Industry Revenue (Million), by End-user Industry 2024 & 2032
- Figure 11: North America Leather Chemicals Industry Revenue Share (%), by End-user Industry 2024 & 2032
- Figure 12: North America Leather Chemicals Industry Revenue (Million), by Country 2024 & 2032
- Figure 13: North America Leather Chemicals Industry Revenue Share (%), by Country 2024 & 2032
- Figure 14: Europe Leather Chemicals Industry Revenue (Million), by Product Type 2024 & 2032
- Figure 15: Europe Leather Chemicals Industry Revenue Share (%), by Product Type 2024 & 2032
- Figure 16: Europe Leather Chemicals Industry Revenue (Million), by End-user Industry 2024 & 2032
- Figure 17: Europe Leather Chemicals Industry Revenue Share (%), by End-user Industry 2024 & 2032
- Figure 18: Europe Leather Chemicals Industry Revenue (Million), by Country 2024 & 2032
- Figure 19: Europe Leather Chemicals Industry Revenue Share (%), by Country 2024 & 2032
- Figure 20: South America Leather Chemicals Industry Revenue (Million), by Product Type 2024 & 2032
- Figure 21: South America Leather Chemicals Industry Revenue Share (%), by Product Type 2024 & 2032
- Figure 22: South America Leather Chemicals Industry Revenue (Million), by End-user Industry 2024 & 2032
- Figure 23: South America Leather Chemicals Industry Revenue Share (%), by End-user Industry 2024 & 2032
- Figure 24: South America Leather Chemicals Industry Revenue (Million), by Country 2024 & 2032
- Figure 25: South America Leather Chemicals Industry Revenue Share (%), by Country 2024 & 2032
- Figure 26: Middle East Leather Chemicals Industry Revenue (Million), by Product Type 2024 & 2032
- Figure 27: Middle East Leather Chemicals Industry Revenue Share (%), by Product Type 2024 & 2032
- Figure 28: Middle East Leather Chemicals Industry Revenue (Million), by End-user Industry 2024 & 2032
- Figure 29: Middle East Leather Chemicals Industry Revenue Share (%), by End-user Industry 2024 & 2032
- Figure 30: Middle East Leather Chemicals Industry Revenue (Million), by Country 2024 & 2032
- Figure 31: Middle East Leather Chemicals Industry Revenue Share (%), by Country 2024 & 2032
- Figure 32: Saudi Arabia Leather Chemicals Industry Revenue (Million), by Product Type 2024 & 2032
- Figure 33: Saudi Arabia Leather Chemicals Industry Revenue Share (%), by Product Type 2024 & 2032
- Figure 34: Saudi Arabia Leather Chemicals Industry Revenue (Million), by End-user Industry 2024 & 2032
- Figure 35: Saudi Arabia Leather Chemicals Industry Revenue Share (%), by End-user Industry 2024 & 2032
- Figure 36: Saudi Arabia Leather Chemicals Industry Revenue (Million), by Country 2024 & 2032
- Figure 37: Saudi Arabia Leather Chemicals Industry Revenue Share (%), by Country 2024 & 2032
List of Tables
- Table 1: Global Leather Chemicals Industry Revenue Million Forecast, by Region 2019 & 2032
- Table 2: Global Leather Chemicals Industry Revenue Million Forecast, by Product Type 2019 & 2032
- Table 3: Global Leather Chemicals Industry Revenue Million Forecast, by End-user Industry 2019 & 2032
- Table 4: Global Leather Chemicals Industry Revenue Million Forecast, by Region 2019 & 2032
- Table 5: Global Leather Chemicals Industry Revenue Million Forecast, by Product Type 2019 & 2032
- Table 6: Global Leather Chemicals Industry Revenue Million Forecast, by End-user Industry 2019 & 2032
- Table 7: Global Leather Chemicals Industry Revenue Million Forecast, by Country 2019 & 2032
- Table 8: China Leather Chemicals Industry Revenue (Million) Forecast, by Application 2019 & 2032
- Table 9: India Leather Chemicals Industry Revenue (Million) Forecast, by Application 2019 & 2032
- Table 10: Japan Leather Chemicals Industry Revenue (Million) Forecast, by Application 2019 & 2032
- Table 11: South Korea Leather Chemicals Industry Revenue (Million) Forecast, by Application 2019 & 2032
- Table 12: Rest of Asia Pacific Leather Chemicals Industry Revenue (Million) Forecast, by Application 2019 & 2032
- Table 13: Global Leather Chemicals Industry Revenue Million Forecast, by Product Type 2019 & 2032
- Table 14: Global Leather Chemicals Industry Revenue Million Forecast, by End-user Industry 2019 & 2032
- Table 15: Global Leather Chemicals Industry Revenue Million Forecast, by Country 2019 & 2032
- Table 16: United States Leather Chemicals Industry Revenue (Million) Forecast, by Application 2019 & 2032
- Table 17: Canada Leather Chemicals Industry Revenue (Million) Forecast, by Application 2019 & 2032
- Table 18: Mexico Leather Chemicals Industry Revenue (Million) Forecast, by Application 2019 & 2032
- Table 19: Global Leather Chemicals Industry Revenue Million Forecast, by Product Type 2019 & 2032
- Table 20: Global Leather Chemicals Industry Revenue Million Forecast, by End-user Industry 2019 & 2032
- Table 21: Global Leather Chemicals Industry Revenue Million Forecast, by Country 2019 & 2032
- Table 22: Germany Leather Chemicals Industry Revenue (Million) Forecast, by Application 2019 & 2032
- Table 23: United Kingdom Leather Chemicals Industry Revenue (Million) Forecast, by Application 2019 & 2032
- Table 24: Italy Leather Chemicals Industry Revenue (Million) Forecast, by Application 2019 & 2032
- Table 25: France Leather Chemicals Industry Revenue (Million) Forecast, by Application 2019 & 2032
- Table 26: Spain Leather Chemicals Industry Revenue (Million) Forecast, by Application 2019 & 2032
- Table 27: Rest of Europe Leather Chemicals Industry Revenue (Million) Forecast, by Application 2019 & 2032
- Table 28: Global Leather Chemicals Industry Revenue Million Forecast, by Product Type 2019 & 2032
- Table 29: Global Leather Chemicals Industry Revenue Million Forecast, by End-user Industry 2019 & 2032
- Table 30: Global Leather Chemicals Industry Revenue Million Forecast, by Country 2019 & 2032
- Table 31: Brazil Leather Chemicals Industry Revenue (Million) Forecast, by Application 2019 & 2032
- Table 32: Argentina Leather Chemicals Industry Revenue (Million) Forecast, by Application 2019 & 2032
- Table 33: Rest of South America Leather Chemicals Industry Revenue (Million) Forecast, by Application 2019 & 2032
- Table 34: Global Leather Chemicals Industry Revenue Million Forecast, by Product Type 2019 & 2032
- Table 35: Global Leather Chemicals Industry Revenue Million Forecast, by End-user Industry 2019 & 2032
- Table 36: Global Leather Chemicals Industry Revenue Million Forecast, by Country 2019 & 2032
- Table 37: Global Leather Chemicals Industry Revenue Million Forecast, by Product Type 2019 & 2032
- Table 38: Global Leather Chemicals Industry Revenue Million Forecast, by End-user Industry 2019 & 2032
- Table 39: Global Leather Chemicals Industry Revenue Million Forecast, by Country 2019 & 2032
- Table 40: South Africa Leather Chemicals Industry Revenue (Million) Forecast, by Application 2019 & 2032
- Table 41: Rest of Middle East Leather Chemicals Industry Revenue (Million) Forecast, by Application 2019 & 2032
Frequently Asked Questions
1. What is the projected Compound Annual Growth Rate (CAGR) of the Leather Chemicals Industry?
The projected CAGR is approximately > 6.00%.
2. Which companies are prominent players in the Leather Chemicals Industry?
Key companies in the market include Balmer Lawrie Co Ltd, Chemtan Company, Clariant, DyStar Group, Elementis PLC, Indofil Industries Ltd, Lanxess, Papertex Specialty Chemicals Pvt Ltd, Schill Seilacher GmbH Co, Stahl International BV, TASA Group International, TEXAPEL, Zschimmer Schwarz Co KG*List Not Exhaustive.
3. What are the main segments of the Leather Chemicals Industry?
The market segments include Product Type, End-user Industry.
4. Can you provide details about the market size?
The market size is estimated to be USD XX Million as of 2022.
5. What are some drivers contributing to market growth?
Growing Footwear and Textile Industries in Asia-Pacific; Increasing Demand for Automotive Upholstery.
6. What are the notable trends driving market growth?
Textile Industry to Witness Higher Potential Growth.
7. Are there any restraints impacting market growth?
Growing Footwear and Textile Industries in Asia-Pacific; Increasing Demand for Automotive Upholstery.
8. Can you provide examples of recent developments in the market?
January 2023: LANXESS and TotalEnergies entered into a cooperation on the supply of bio-circular styrene. By partnering with TotalEnergies, the company can offer its customers sustainable solutions and raw materials with a low carbon footprint.
9. What pricing options are available for accessing the report?
Pricing options include single-user, multi-user, and enterprise licenses priced at USD 4750, USD 5250, and USD 8750 respectively.
10. Is the market size provided in terms of value or volume?
The market size is provided in terms of value, measured in Million.
11. Are there any specific market keywords associated with the report?
Yes, the market keyword associated with the report is "Leather Chemicals Industry," which aids in identifying and referencing the specific market segment covered.
12. How do I determine which pricing option suits my needs best?
The pricing options vary based on user requirements and access needs. Individual users may opt for single-user licenses, while businesses requiring broader access may choose multi-user or enterprise licenses for cost-effective access to the report.
13. Are there any additional resources or data provided in the Leather Chemicals Industry report?
While the report offers comprehensive insights, it's advisable to review the specific contents or supplementary materials provided to ascertain if additional resources or data are available.
14. How can I stay updated on further developments or reports in the Leather Chemicals Industry?
To stay informed about further developments, trends, and reports in the Leather Chemicals Industry, consider subscribing to industry newsletters, following relevant companies and organizations, or regularly checking reputable industry news sources and publications.
Methodology
Step 1 - Identification of Relevant Samples Size from Population Database


Step 2 - Approaches for Defining Global Market Size (Value, Volume* & Price*)

Note*: In applicable scenarios
Step 3 - Data Sources
Primary Research
- Web Analytics
- Survey Reports
- Research Institute
- Latest Research Reports
- Opinion Leaders
Secondary Research
- Annual Reports
- White Paper
- Latest Press Release
- Industry Association
- Paid Database
- Investor Presentations

Step 4 - Data Triangulation
Involves using different sources of information in order to increase the validity of a study
These sources are likely to be stakeholders in a program - participants, other researchers, program staff, other community members, and so on.
Then we put all data in single framework & apply various statistical tools to find out the dynamic on the market.
During the analysis stage, feedback from the stakeholder groups would be compared to determine areas of agreement as well as areas of divergence


