
Key Insights
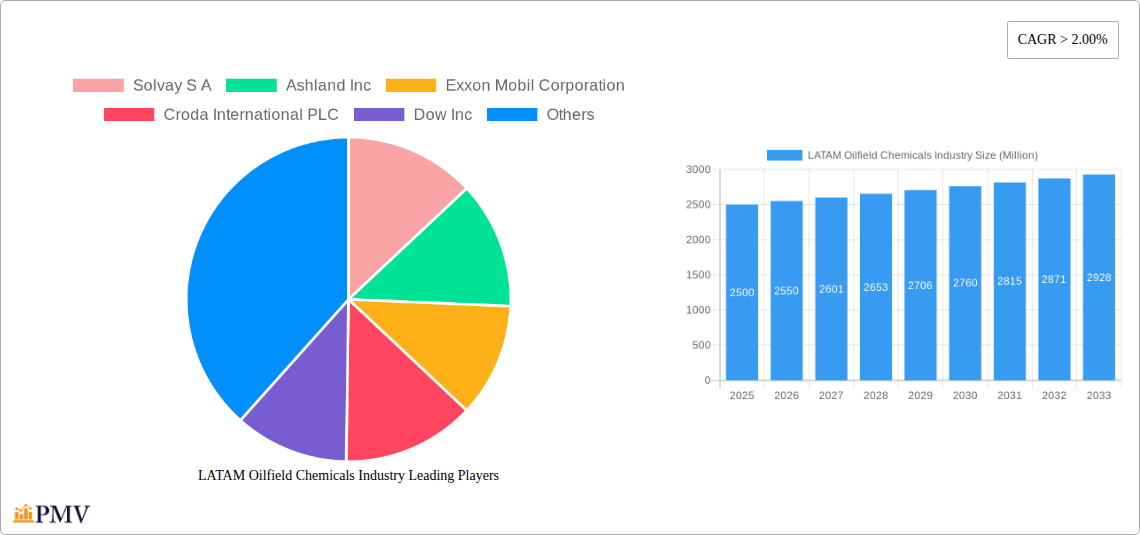
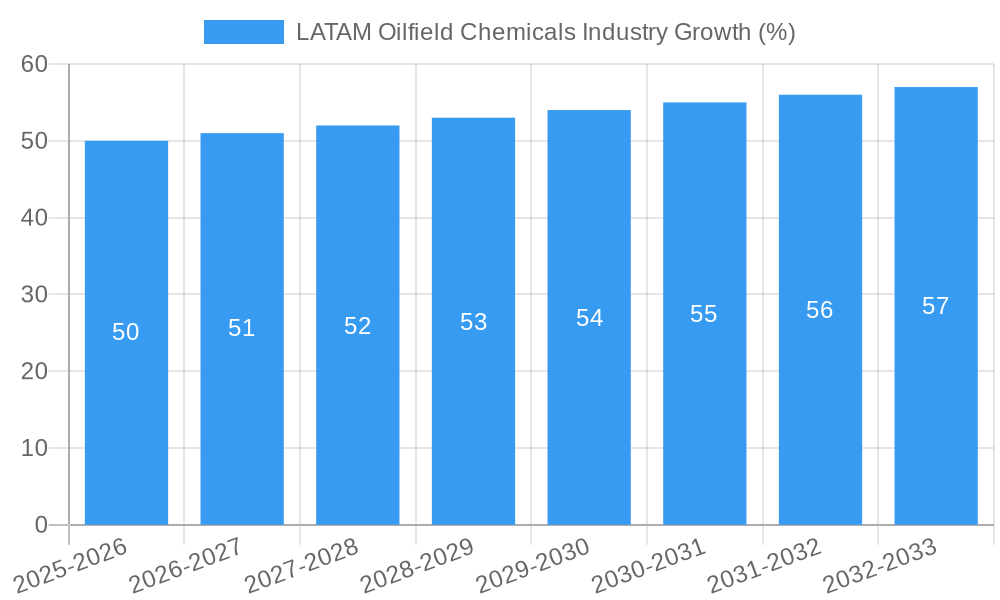
The Latin American oilfield chemicals market, while exhibiting a smaller overall size compared to North America or Asia-Pacific, presents a compelling growth trajectory. Driven by increasing oil and gas exploration and production activities, particularly in Brazil, Colombia, and Mexico, the market is projected to maintain a CAGR exceeding 2% from 2025-2033. Key growth drivers include rising investments in enhanced oil recovery (EOR) techniques and the expanding demand for specialized chemicals like biocides and corrosion inhibitors to optimize production efficiency and extend the lifespan of oilfield equipment. The market segmentation reflects this, with drilling and cementing, and EOR applications dominating market share. While fluctuating crude oil prices and the overall economic climate within the region can pose challenges, ongoing governmental incentives for energy independence and infrastructure development create an overall positive outlook. The major players listed, including international giants and regional specialists, are actively investing in research and development to cater to specific regional needs and optimize chemical formulations for the unique geological conditions found in Latin America.
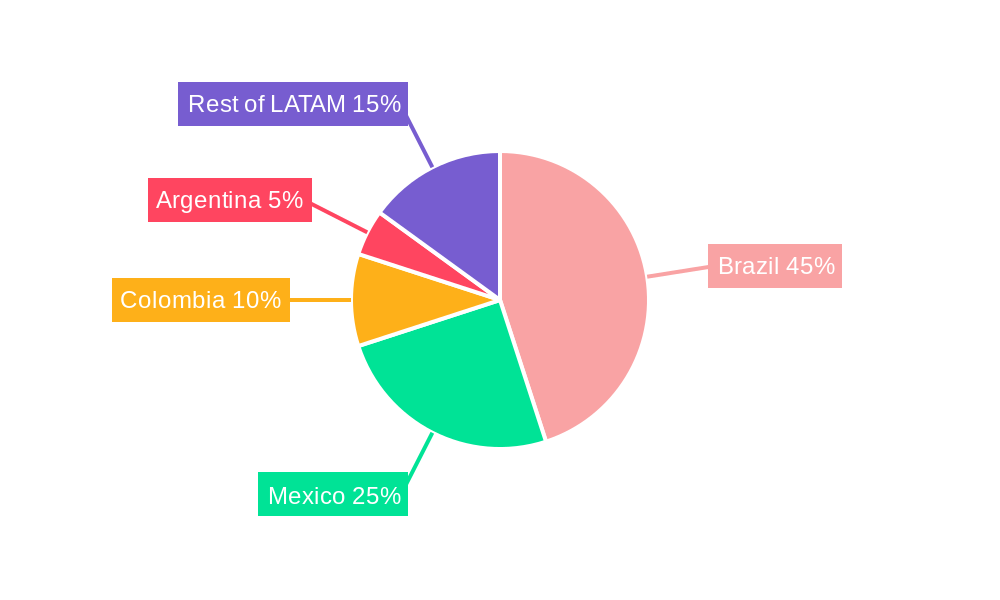
Further analysis suggests a significant opportunity for growth in the "Other Chemical Types" segment, driven by innovation in chemical solutions for specific challenges within the region’s diverse geological landscape. The increasing focus on sustainability and environmental regulations is also shaping the market, with a noticeable push towards bio-based and less environmentally impactful chemicals. Brazil, as the largest economy in the region, is expected to remain the dominant market, followed by Mexico and Colombia. However, smaller countries in the Andean region and the Southern Cone are showing significant potential for growth, driven by recent discoveries and exploration activities. Competition is expected to remain intense, with a mix of large multinational corporations and smaller, regionally-focused companies vying for market share. Successful players will be those that can adapt to local needs, offer customized solutions, and maintain a strong focus on safety and environmental compliance.
LATAM Oilfield Chemicals Industry: A Comprehensive Market Report (2019-2033)
This detailed report provides a comprehensive analysis of the LATAM oilfield chemicals market, covering the period 2019-2033, with a focus on market size, growth drivers, competitive landscape, and future outlook. The report utilizes a robust methodology, incorporating extensive primary and secondary research to offer actionable insights for industry stakeholders. The base year for this analysis is 2025, with estimations for 2025 and forecasts extending to 2033. The historical period analyzed is 2019-2024. The total market size in 2025 is estimated at $XX Million.
LATAM Oilfield Chemicals Industry Market Structure & Competitive Dynamics
The LATAM oilfield chemicals market exhibits a moderately concentrated structure, with several multinational corporations holding significant market share. Key players such as Solvay S.A., Ashland Inc., Exxon Mobil Corporation, Croda International PLC, Dow Inc., Weatherford International Plc, BASF SE, Huntsman International LLC, Baker Hughes Company, Halliburton, Ecolab Inc., Petrolab Industrial E Comercial Ltda, Schlumberger Limited, and Clariant AG compete fiercely, driving innovation and influencing pricing strategies. Market share for the top 5 players is estimated at approximately 60% in 2025.
- Market Concentration: The Herfindahl-Hirschman Index (HHI) is estimated at xx, indicating a moderately concentrated market.
- Innovation Ecosystems: Significant R&D investments drive the development of enhanced performance chemicals, focusing on environmental sustainability and improved efficiency.
- Regulatory Frameworks: Stringent environmental regulations and safety standards significantly impact product development and operations.
- Product Substitutes: The presence of biodegradable and environmentally friendly alternatives is increasing competition.
- End-User Trends: Demand for specialized chemicals tailored to specific reservoir conditions and operational needs is growing.
- M&A Activities: Consolidation through mergers and acquisitions has been moderate in recent years, with deal values totaling approximately $XX Million in the past five years. Examples include [Insert specific M&A examples if available, otherwise state "Further details available in the full report"].
LATAM Oilfield Chemicals Industry Industry Trends & Insights
The LATAM oilfield chemicals market is projected to experience robust growth, driven by several factors. The Compound Annual Growth Rate (CAGR) is estimated at xx% during the forecast period (2025-2033). Increased oil and gas exploration and production activities in key regions within LATAM, coupled with the rising demand for enhanced oil recovery (EOR) techniques, are key growth catalysts. Technological advancements, such as the development of more efficient and environmentally friendly chemicals, further fuel market expansion.
The market penetration of high-performance chemicals is increasing steadily, particularly in the offshore and deepwater segments. Consumer preferences are shifting towards sustainable and environmentally benign solutions, putting pressure on manufacturers to innovate. The competitive landscape is dynamic, with both established players and new entrants vying for market share. Pricing pressures remain a significant challenge, necessitating efficient manufacturing and optimized supply chains. Furthermore, fluctuating crude oil prices impact investment decisions and overall market demand. The report provides a detailed breakdown of regional and segment-specific growth drivers and market dynamics.
Dominant Markets & Segments in LATAM Oilfield Chemicals Industry
While the entire LATAM region presents opportunities, Brazil, Mexico, and Colombia represent the most significant markets for oilfield chemicals. Within chemical types, corrosion and scale inhibitors, followed by demulsifiers and polymers, dominate the market in terms of value and volume. In terms of application, production and well stimulation segments represent the highest demand.
- Key Drivers of Dominance:
- Brazil: Significant oil and gas reserves, coupled with ongoing investments in exploration and production activities.
- Mexico: Energy reforms and liberalization of the energy sector have spurred growth.
- Colombia: Expanding exploration and production activities, particularly in unconventional resources.
- Corrosion and Scale Inhibitors: Growing demand driven by the need to protect equipment from corrosion in harsh environments.
- Demulsifiers: Essential for efficient oil-water separation in production operations.
- Polymers: Widely used in drilling fluids and hydraulic fracturing operations.
- Production and Well Stimulation: High demand due to ongoing operational activities and EOR projects.
LATAM Oilfield Chemicals Industry Product Innovations
Recent product innovations focus on developing environmentally friendly, high-performance chemicals that meet stringent regulatory requirements. This includes biocides with reduced toxicity, corrosion inhibitors with enhanced efficiency, and polymers with improved rheological properties. The focus is on improving the efficiency and effectiveness of oilfield operations, while minimizing the environmental impact. Many innovations incorporate nanotechnology and other advanced materials to enhance performance and reduce the quantity of chemicals required.
Report Segmentation & Scope
The report segments the LATAM oilfield chemicals market by chemical type (Biocide, Corrosion and Scale Inhibitor, Demulsifier, Polymer, Surfactant, Other Chemical Types) and application (Drilling and Cementing, Enhanced Oil Recovery, Production, Well Stimulation, Workover and Completion). Each segment's growth projections, market size, and competitive dynamics are analyzed in detail. For example, the Corrosion and Scale inhibitor segment is projected to experience significant growth due to increased demand from production and pipeline operations. The Enhanced Oil Recovery segment is expected to exhibit high growth driven by EOR projects in several LATAM countries. Detailed growth projections for each segment are provided in the full report.
Key Drivers of LATAM Oilfield Chemicals Industry Growth
Growth in the LATAM oilfield chemicals industry is primarily driven by increased oil and gas production, expanding EOR activities, and the development of new oil and gas fields. Technological advancements, such as the use of nanotechnology and other advanced materials, contribute to the development of higher-performing and more sustainable chemicals. Government initiatives promoting domestic oil and gas production also create favorable market conditions. Finally, the increasing demand for improved safety and environmental standards further fuels the demand for specialized oilfield chemicals.
Challenges in the LATAM Oilfield Chemicals Industry Sector
The LATAM oilfield chemicals sector faces several challenges, including fluctuating crude oil prices, volatile political and economic conditions in certain regions, and the implementation of stringent environmental regulations. Supply chain disruptions and logistics challenges can also impact the availability and cost of raw materials. Furthermore, intense competition among established players and the emergence of new entrants exert downward pressure on prices. These factors collectively pose challenges to consistent market growth and profitability.
Leading Players in the LATAM Oilfield Chemicals Industry Market
- Solvay S.A.
- Ashland Inc.
- Exxon Mobil Corporation
- Croda International PLC
- Dow Inc.
- Weatherford International Plc
- BASF SE
- Huntsman International LLC
- Baker Hughes Company
- Halliburton
- Ecolab Inc.
- Petrolab Industrial E Comercial Ltda
- Schlumberger Limited
- Clariant AG
Key Developments in LATAM Oilfield Chemicals Industry Sector
- August 2022: Baker Hughes expanded its presence in Asia by establishing a new oilfield services chemicals manufacturing facility in Singapore. This significantly enhances their ability to provide solutions in a timely manner.
- March 2022: Halliburton opened The Halliburton Chemical Reaction Plant in Saudi Arabia, expanding their manufacturing footprint in the Eastern Hemisphere and strengthening their service capabilities in the Middle East.
Strategic LATAM Oilfield Chemicals Industry Market Outlook
The LATAM oilfield chemicals market presents significant growth potential driven by increasing oil and gas exploration and production activities, the adoption of advanced technologies, and favorable government policies. Strategic opportunities exist for companies to focus on developing environmentally sustainable and high-performance products that cater to the specific needs of the region. Companies that can effectively navigate regulatory complexities and manage supply chain challenges will be best positioned to capitalize on the market's growth potential. Expansion into underserved markets and strategic partnerships with local players will also be crucial.
LATAM Oilfield Chemicals Industry Segmentation
-
1. Chemical Type
- 1.1. Biocide
- 1.2. Corrosion and Scale Inhibitor
- 1.3. Demulsifier
- 1.4. Polymer
- 1.5. Surfactant
- 1.6. Other Chemical Types
-
2. Application
- 2.1. Drilling and Cementing
- 2.2. Enhanced Oil Recovery
- 2.3. Production
- 2.4. Well Stimulation
- 2.5. Workover and Completion
LATAM Oilfield Chemicals Industry Segmentation By Geography
- 1. Mexico
- 2. Brazil
- 3. Colombia
- 4. Argentina
- 5. Peru
- 6. Ecuador
- 7. Rest of Latin America
LATAM Oilfield Chemicals Industry REPORT HIGHLIGHTS
| Aspects | Details |
|---|---|
| Study Period | 2019-2033 |
| Base Year | 2024 |
| Estimated Year | 2025 |
| Forecast Period | 2025-2033 |
| Historical Period | 2019-2024 |
| Growth Rate | CAGR of > 2.00% from 2019-2033 |
| Segmentation |
|
Table of Contents
- 1. Introduction
- 1.1. Research Scope
- 1.2. Market Segmentation
- 1.3. Research Methodology
- 1.4. Definitions and Assumptions
- 2. Executive Summary
- 2.1. Introduction
- 3. Market Dynamics
- 3.1. Introduction
- 3.2. Market Drivers
- 3.2.1 Increasing Offshore activities in Brazil
- 3.2.2 Mexico & Argentina
- 3.3. Market Restrains
- 3.3.1. Downfall of Venezuela Economy
- 3.4. Market Trends
- 3.4.1. Increasing Demand from the Drilling and Cementing Segment
- 4. Market Factor Analysis
- 4.1. Porters Five Forces
- 4.2. Supply/Value Chain
- 4.3. PESTEL analysis
- 4.4. Market Entropy
- 4.5. Patent/Trademark Analysis
- 5. LATAM Oilfield Chemicals Industry Analysis, Insights and Forecast, 2019-2031
- 5.1. Market Analysis, Insights and Forecast - by Chemical Type
- 5.1.1. Biocide
- 5.1.2. Corrosion and Scale Inhibitor
- 5.1.3. Demulsifier
- 5.1.4. Polymer
- 5.1.5. Surfactant
- 5.1.6. Other Chemical Types
- 5.2. Market Analysis, Insights and Forecast - by Application
- 5.2.1. Drilling and Cementing
- 5.2.2. Enhanced Oil Recovery
- 5.2.3. Production
- 5.2.4. Well Stimulation
- 5.2.5. Workover and Completion
- 5.3. Market Analysis, Insights and Forecast - by Region
- 5.3.1. Mexico
- 5.3.2. Brazil
- 5.3.3. Colombia
- 5.3.4. Argentina
- 5.3.5. Peru
- 5.3.6. Ecuador
- 5.3.7. Rest of Latin America
- 5.1. Market Analysis, Insights and Forecast - by Chemical Type
- 6. Mexico LATAM Oilfield Chemicals Industry Analysis, Insights and Forecast, 2019-2031
- 6.1. Market Analysis, Insights and Forecast - by Chemical Type
- 6.1.1. Biocide
- 6.1.2. Corrosion and Scale Inhibitor
- 6.1.3. Demulsifier
- 6.1.4. Polymer
- 6.1.5. Surfactant
- 6.1.6. Other Chemical Types
- 6.2. Market Analysis, Insights and Forecast - by Application
- 6.2.1. Drilling and Cementing
- 6.2.2. Enhanced Oil Recovery
- 6.2.3. Production
- 6.2.4. Well Stimulation
- 6.2.5. Workover and Completion
- 6.1. Market Analysis, Insights and Forecast - by Chemical Type
- 7. Brazil LATAM Oilfield Chemicals Industry Analysis, Insights and Forecast, 2019-2031
- 7.1. Market Analysis, Insights and Forecast - by Chemical Type
- 7.1.1. Biocide
- 7.1.2. Corrosion and Scale Inhibitor
- 7.1.3. Demulsifier
- 7.1.4. Polymer
- 7.1.5. Surfactant
- 7.1.6. Other Chemical Types
- 7.2. Market Analysis, Insights and Forecast - by Application
- 7.2.1. Drilling and Cementing
- 7.2.2. Enhanced Oil Recovery
- 7.2.3. Production
- 7.2.4. Well Stimulation
- 7.2.5. Workover and Completion
- 7.1. Market Analysis, Insights and Forecast - by Chemical Type
- 8. Colombia LATAM Oilfield Chemicals Industry Analysis, Insights and Forecast, 2019-2031
- 8.1. Market Analysis, Insights and Forecast - by Chemical Type
- 8.1.1. Biocide
- 8.1.2. Corrosion and Scale Inhibitor
- 8.1.3. Demulsifier
- 8.1.4. Polymer
- 8.1.5. Surfactant
- 8.1.6. Other Chemical Types
- 8.2. Market Analysis, Insights and Forecast - by Application
- 8.2.1. Drilling and Cementing
- 8.2.2. Enhanced Oil Recovery
- 8.2.3. Production
- 8.2.4. Well Stimulation
- 8.2.5. Workover and Completion
- 8.1. Market Analysis, Insights and Forecast - by Chemical Type
- 9. Argentina LATAM Oilfield Chemicals Industry Analysis, Insights and Forecast, 2019-2031
- 9.1. Market Analysis, Insights and Forecast - by Chemical Type
- 9.1.1. Biocide
- 9.1.2. Corrosion and Scale Inhibitor
- 9.1.3. Demulsifier
- 9.1.4. Polymer
- 9.1.5. Surfactant
- 9.1.6. Other Chemical Types
- 9.2. Market Analysis, Insights and Forecast - by Application
- 9.2.1. Drilling and Cementing
- 9.2.2. Enhanced Oil Recovery
- 9.2.3. Production
- 9.2.4. Well Stimulation
- 9.2.5. Workover and Completion
- 9.1. Market Analysis, Insights and Forecast - by Chemical Type
- 10. Peru LATAM Oilfield Chemicals Industry Analysis, Insights and Forecast, 2019-2031
- 10.1. Market Analysis, Insights and Forecast - by Chemical Type
- 10.1.1. Biocide
- 10.1.2. Corrosion and Scale Inhibitor
- 10.1.3. Demulsifier
- 10.1.4. Polymer
- 10.1.5. Surfactant
- 10.1.6. Other Chemical Types
- 10.2. Market Analysis, Insights and Forecast - by Application
- 10.2.1. Drilling and Cementing
- 10.2.2. Enhanced Oil Recovery
- 10.2.3. Production
- 10.2.4. Well Stimulation
- 10.2.5. Workover and Completion
- 10.1. Market Analysis, Insights and Forecast - by Chemical Type
- 11. Ecuador LATAM Oilfield Chemicals Industry Analysis, Insights and Forecast, 2019-2031
- 11.1. Market Analysis, Insights and Forecast - by Chemical Type
- 11.1.1. Biocide
- 11.1.2. Corrosion and Scale Inhibitor
- 11.1.3. Demulsifier
- 11.1.4. Polymer
- 11.1.5. Surfactant
- 11.1.6. Other Chemical Types
- 11.2. Market Analysis, Insights and Forecast - by Application
- 11.2.1. Drilling and Cementing
- 11.2.2. Enhanced Oil Recovery
- 11.2.3. Production
- 11.2.4. Well Stimulation
- 11.2.5. Workover and Completion
- 11.1. Market Analysis, Insights and Forecast - by Chemical Type
- 12. Rest of Latin America LATAM Oilfield Chemicals Industry Analysis, Insights and Forecast, 2019-2031
- 12.1. Market Analysis, Insights and Forecast - by Chemical Type
- 12.1.1. Biocide
- 12.1.2. Corrosion and Scale Inhibitor
- 12.1.3. Demulsifier
- 12.1.4. Polymer
- 12.1.5. Surfactant
- 12.1.6. Other Chemical Types
- 12.2. Market Analysis, Insights and Forecast - by Application
- 12.2.1. Drilling and Cementing
- 12.2.2. Enhanced Oil Recovery
- 12.2.3. Production
- 12.2.4. Well Stimulation
- 12.2.5. Workover and Completion
- 12.1. Market Analysis, Insights and Forecast - by Chemical Type
- 13. North America LATAM Oilfield Chemicals Industry Analysis, Insights and Forecast, 2019-2031
- 13.1. Market Analysis, Insights and Forecast - By Country/Sub-region
- 13.1.1 United States
- 13.1.2 Canada
- 13.1.3 Mexico
- 14. Europe LATAM Oilfield Chemicals Industry Analysis, Insights and Forecast, 2019-2031
- 14.1. Market Analysis, Insights and Forecast - By Country/Sub-region
- 14.1.1 Germany
- 14.1.2 United Kingdom
- 14.1.3 France
- 14.1.4 Spain
- 14.1.5 Italy
- 14.1.6 Spain
- 14.1.7 Belgium
- 14.1.8 Netherland
- 14.1.9 Nordics
- 14.1.10 Rest of Europe
- 15. Asia Pacific LATAM Oilfield Chemicals Industry Analysis, Insights and Forecast, 2019-2031
- 15.1. Market Analysis, Insights and Forecast - By Country/Sub-region
- 15.1.1 China
- 15.1.2 Japan
- 15.1.3 India
- 15.1.4 South Korea
- 15.1.5 Southeast Asia
- 15.1.6 Australia
- 15.1.7 Indonesia
- 15.1.8 Phillipes
- 15.1.9 Singapore
- 15.1.10 Thailandc
- 15.1.11 Rest of Asia Pacific
- 16. South America LATAM Oilfield Chemicals Industry Analysis, Insights and Forecast, 2019-2031
- 16.1. Market Analysis, Insights and Forecast - By Country/Sub-region
- 16.1.1 Brazil
- 16.1.2 Argentina
- 16.1.3 Peru
- 16.1.4 Chile
- 16.1.5 Colombia
- 16.1.6 Ecuador
- 16.1.7 Venezuela
- 16.1.8 Rest of South America
- 17. North America LATAM Oilfield Chemicals Industry Analysis, Insights and Forecast, 2019-2031
- 17.1. Market Analysis, Insights and Forecast - By Country/Sub-region
- 17.1.1 United States
- 17.1.2 Canada
- 17.1.3 Mexico
- 18. MEA LATAM Oilfield Chemicals Industry Analysis, Insights and Forecast, 2019-2031
- 18.1. Market Analysis, Insights and Forecast - By Country/Sub-region
- 18.1.1 United Arab Emirates
- 18.1.2 Saudi Arabia
- 18.1.3 South Africa
- 18.1.4 Rest of Middle East and Africa
- 19. Competitive Analysis
- 19.1. Market Share Analysis 2024
- 19.2. Company Profiles
- 19.2.1 Solvay S A
- 19.2.1.1. Overview
- 19.2.1.2. Products
- 19.2.1.3. SWOT Analysis
- 19.2.1.4. Recent Developments
- 19.2.1.5. Financials (Based on Availability)
- 19.2.2 Ashland Inc
- 19.2.2.1. Overview
- 19.2.2.2. Products
- 19.2.2.3. SWOT Analysis
- 19.2.2.4. Recent Developments
- 19.2.2.5. Financials (Based on Availability)
- 19.2.3 Exxon Mobil Corporation
- 19.2.3.1. Overview
- 19.2.3.2. Products
- 19.2.3.3. SWOT Analysis
- 19.2.3.4. Recent Developments
- 19.2.3.5. Financials (Based on Availability)
- 19.2.4 Croda International PLC
- 19.2.4.1. Overview
- 19.2.4.2. Products
- 19.2.4.3. SWOT Analysis
- 19.2.4.4. Recent Developments
- 19.2.4.5. Financials (Based on Availability)
- 19.2.5 Dow Inc
- 19.2.5.1. Overview
- 19.2.5.2. Products
- 19.2.5.3. SWOT Analysis
- 19.2.5.4. Recent Developments
- 19.2.5.5. Financials (Based on Availability)
- 19.2.6 Weatherford International Plc
- 19.2.6.1. Overview
- 19.2.6.2. Products
- 19.2.6.3. SWOT Analysis
- 19.2.6.4. Recent Developments
- 19.2.6.5. Financials (Based on Availability)
- 19.2.7 BASF SE
- 19.2.7.1. Overview
- 19.2.7.2. Products
- 19.2.7.3. SWOT Analysis
- 19.2.7.4. Recent Developments
- 19.2.7.5. Financials (Based on Availability)
- 19.2.8 Huntsman International LLC
- 19.2.8.1. Overview
- 19.2.8.2. Products
- 19.2.8.3. SWOT Analysis
- 19.2.8.4. Recent Developments
- 19.2.8.5. Financials (Based on Availability)
- 19.2.9 Baker Hughes Company
- 19.2.9.1. Overview
- 19.2.9.2. Products
- 19.2.9.3. SWOT Analysis
- 19.2.9.4. Recent Developments
- 19.2.9.5. Financials (Based on Availability)
- 19.2.10 Halliburton
- 19.2.10.1. Overview
- 19.2.10.2. Products
- 19.2.10.3. SWOT Analysis
- 19.2.10.4. Recent Developments
- 19.2.10.5. Financials (Based on Availability)
- 19.2.11 Ecolab Inc
- 19.2.11.1. Overview
- 19.2.11.2. Products
- 19.2.11.3. SWOT Analysis
- 19.2.11.4. Recent Developments
- 19.2.11.5. Financials (Based on Availability)
- 19.2.12 Petrolab Industrial E Comercial Ltda
- 19.2.12.1. Overview
- 19.2.12.2. Products
- 19.2.12.3. SWOT Analysis
- 19.2.12.4. Recent Developments
- 19.2.12.5. Financials (Based on Availability)
- 19.2.13 Schlumberger Limited
- 19.2.13.1. Overview
- 19.2.13.2. Products
- 19.2.13.3. SWOT Analysis
- 19.2.13.4. Recent Developments
- 19.2.13.5. Financials (Based on Availability)
- 19.2.14 Clariant AG
- 19.2.14.1. Overview
- 19.2.14.2. Products
- 19.2.14.3. SWOT Analysis
- 19.2.14.4. Recent Developments
- 19.2.14.5. Financials (Based on Availability)
- 19.2.1 Solvay S A
List of Figures
- Figure 1: LATAM Oilfield Chemicals Industry Revenue Breakdown (Million, %) by Product 2024 & 2032
- Figure 2: LATAM Oilfield Chemicals Industry Share (%) by Company 2024
List of Tables
- Table 1: LATAM Oilfield Chemicals Industry Revenue Million Forecast, by Region 2019 & 2032
- Table 2: LATAM Oilfield Chemicals Industry Volume K Tons Forecast, by Region 2019 & 2032
- Table 3: LATAM Oilfield Chemicals Industry Revenue Million Forecast, by Chemical Type 2019 & 2032
- Table 4: LATAM Oilfield Chemicals Industry Volume K Tons Forecast, by Chemical Type 2019 & 2032
- Table 5: LATAM Oilfield Chemicals Industry Revenue Million Forecast, by Application 2019 & 2032
- Table 6: LATAM Oilfield Chemicals Industry Volume K Tons Forecast, by Application 2019 & 2032
- Table 7: LATAM Oilfield Chemicals Industry Revenue Million Forecast, by Region 2019 & 2032
- Table 8: LATAM Oilfield Chemicals Industry Volume K Tons Forecast, by Region 2019 & 2032
- Table 9: LATAM Oilfield Chemicals Industry Revenue Million Forecast, by Country 2019 & 2032
- Table 10: LATAM Oilfield Chemicals Industry Volume K Tons Forecast, by Country 2019 & 2032
- Table 11: United States LATAM Oilfield Chemicals Industry Revenue (Million) Forecast, by Application 2019 & 2032
- Table 12: United States LATAM Oilfield Chemicals Industry Volume (K Tons) Forecast, by Application 2019 & 2032
- Table 13: Canada LATAM Oilfield Chemicals Industry Revenue (Million) Forecast, by Application 2019 & 2032
- Table 14: Canada LATAM Oilfield Chemicals Industry Volume (K Tons) Forecast, by Application 2019 & 2032
- Table 15: Mexico LATAM Oilfield Chemicals Industry Revenue (Million) Forecast, by Application 2019 & 2032
- Table 16: Mexico LATAM Oilfield Chemicals Industry Volume (K Tons) Forecast, by Application 2019 & 2032
- Table 17: LATAM Oilfield Chemicals Industry Revenue Million Forecast, by Country 2019 & 2032
- Table 18: LATAM Oilfield Chemicals Industry Volume K Tons Forecast, by Country 2019 & 2032
- Table 19: Germany LATAM Oilfield Chemicals Industry Revenue (Million) Forecast, by Application 2019 & 2032
- Table 20: Germany LATAM Oilfield Chemicals Industry Volume (K Tons) Forecast, by Application 2019 & 2032
- Table 21: United Kingdom LATAM Oilfield Chemicals Industry Revenue (Million) Forecast, by Application 2019 & 2032
- Table 22: United Kingdom LATAM Oilfield Chemicals Industry Volume (K Tons) Forecast, by Application 2019 & 2032
- Table 23: France LATAM Oilfield Chemicals Industry Revenue (Million) Forecast, by Application 2019 & 2032
- Table 24: France LATAM Oilfield Chemicals Industry Volume (K Tons) Forecast, by Application 2019 & 2032
- Table 25: Spain LATAM Oilfield Chemicals Industry Revenue (Million) Forecast, by Application 2019 & 2032
- Table 26: Spain LATAM Oilfield Chemicals Industry Volume (K Tons) Forecast, by Application 2019 & 2032
- Table 27: Italy LATAM Oilfield Chemicals Industry Revenue (Million) Forecast, by Application 2019 & 2032
- Table 28: Italy LATAM Oilfield Chemicals Industry Volume (K Tons) Forecast, by Application 2019 & 2032
- Table 29: Spain LATAM Oilfield Chemicals Industry Revenue (Million) Forecast, by Application 2019 & 2032
- Table 30: Spain LATAM Oilfield Chemicals Industry Volume (K Tons) Forecast, by Application 2019 & 2032
- Table 31: Belgium LATAM Oilfield Chemicals Industry Revenue (Million) Forecast, by Application 2019 & 2032
- Table 32: Belgium LATAM Oilfield Chemicals Industry Volume (K Tons) Forecast, by Application 2019 & 2032
- Table 33: Netherland LATAM Oilfield Chemicals Industry Revenue (Million) Forecast, by Application 2019 & 2032
- Table 34: Netherland LATAM Oilfield Chemicals Industry Volume (K Tons) Forecast, by Application 2019 & 2032
- Table 35: Nordics LATAM Oilfield Chemicals Industry Revenue (Million) Forecast, by Application 2019 & 2032
- Table 36: Nordics LATAM Oilfield Chemicals Industry Volume (K Tons) Forecast, by Application 2019 & 2032
- Table 37: Rest of Europe LATAM Oilfield Chemicals Industry Revenue (Million) Forecast, by Application 2019 & 2032
- Table 38: Rest of Europe LATAM Oilfield Chemicals Industry Volume (K Tons) Forecast, by Application 2019 & 2032
- Table 39: LATAM Oilfield Chemicals Industry Revenue Million Forecast, by Country 2019 & 2032
- Table 40: LATAM Oilfield Chemicals Industry Volume K Tons Forecast, by Country 2019 & 2032
- Table 41: China LATAM Oilfield Chemicals Industry Revenue (Million) Forecast, by Application 2019 & 2032
- Table 42: China LATAM Oilfield Chemicals Industry Volume (K Tons) Forecast, by Application 2019 & 2032
- Table 43: Japan LATAM Oilfield Chemicals Industry Revenue (Million) Forecast, by Application 2019 & 2032
- Table 44: Japan LATAM Oilfield Chemicals Industry Volume (K Tons) Forecast, by Application 2019 & 2032
- Table 45: India LATAM Oilfield Chemicals Industry Revenue (Million) Forecast, by Application 2019 & 2032
- Table 46: India LATAM Oilfield Chemicals Industry Volume (K Tons) Forecast, by Application 2019 & 2032
- Table 47: South Korea LATAM Oilfield Chemicals Industry Revenue (Million) Forecast, by Application 2019 & 2032
- Table 48: South Korea LATAM Oilfield Chemicals Industry Volume (K Tons) Forecast, by Application 2019 & 2032
- Table 49: Southeast Asia LATAM Oilfield Chemicals Industry Revenue (Million) Forecast, by Application 2019 & 2032
- Table 50: Southeast Asia LATAM Oilfield Chemicals Industry Volume (K Tons) Forecast, by Application 2019 & 2032
- Table 51: Australia LATAM Oilfield Chemicals Industry Revenue (Million) Forecast, by Application 2019 & 2032
- Table 52: Australia LATAM Oilfield Chemicals Industry Volume (K Tons) Forecast, by Application 2019 & 2032
- Table 53: Indonesia LATAM Oilfield Chemicals Industry Revenue (Million) Forecast, by Application 2019 & 2032
- Table 54: Indonesia LATAM Oilfield Chemicals Industry Volume (K Tons) Forecast, by Application 2019 & 2032
- Table 55: Phillipes LATAM Oilfield Chemicals Industry Revenue (Million) Forecast, by Application 2019 & 2032
- Table 56: Phillipes LATAM Oilfield Chemicals Industry Volume (K Tons) Forecast, by Application 2019 & 2032
- Table 57: Singapore LATAM Oilfield Chemicals Industry Revenue (Million) Forecast, by Application 2019 & 2032
- Table 58: Singapore LATAM Oilfield Chemicals Industry Volume (K Tons) Forecast, by Application 2019 & 2032
- Table 59: Thailandc LATAM Oilfield Chemicals Industry Revenue (Million) Forecast, by Application 2019 & 2032
- Table 60: Thailandc LATAM Oilfield Chemicals Industry Volume (K Tons) Forecast, by Application 2019 & 2032
- Table 61: Rest of Asia Pacific LATAM Oilfield Chemicals Industry Revenue (Million) Forecast, by Application 2019 & 2032
- Table 62: Rest of Asia Pacific LATAM Oilfield Chemicals Industry Volume (K Tons) Forecast, by Application 2019 & 2032
- Table 63: LATAM Oilfield Chemicals Industry Revenue Million Forecast, by Country 2019 & 2032
- Table 64: LATAM Oilfield Chemicals Industry Volume K Tons Forecast, by Country 2019 & 2032
- Table 65: Brazil LATAM Oilfield Chemicals Industry Revenue (Million) Forecast, by Application 2019 & 2032
- Table 66: Brazil LATAM Oilfield Chemicals Industry Volume (K Tons) Forecast, by Application 2019 & 2032
- Table 67: Argentina LATAM Oilfield Chemicals Industry Revenue (Million) Forecast, by Application 2019 & 2032
- Table 68: Argentina LATAM Oilfield Chemicals Industry Volume (K Tons) Forecast, by Application 2019 & 2032
- Table 69: Peru LATAM Oilfield Chemicals Industry Revenue (Million) Forecast, by Application 2019 & 2032
- Table 70: Peru LATAM Oilfield Chemicals Industry Volume (K Tons) Forecast, by Application 2019 & 2032
- Table 71: Chile LATAM Oilfield Chemicals Industry Revenue (Million) Forecast, by Application 2019 & 2032
- Table 72: Chile LATAM Oilfield Chemicals Industry Volume (K Tons) Forecast, by Application 2019 & 2032
- Table 73: Colombia LATAM Oilfield Chemicals Industry Revenue (Million) Forecast, by Application 2019 & 2032
- Table 74: Colombia LATAM Oilfield Chemicals Industry Volume (K Tons) Forecast, by Application 2019 & 2032
- Table 75: Ecuador LATAM Oilfield Chemicals Industry Revenue (Million) Forecast, by Application 2019 & 2032
- Table 76: Ecuador LATAM Oilfield Chemicals Industry Volume (K Tons) Forecast, by Application 2019 & 2032
- Table 77: Venezuela LATAM Oilfield Chemicals Industry Revenue (Million) Forecast, by Application 2019 & 2032
- Table 78: Venezuela LATAM Oilfield Chemicals Industry Volume (K Tons) Forecast, by Application 2019 & 2032
- Table 79: Rest of South America LATAM Oilfield Chemicals Industry Revenue (Million) Forecast, by Application 2019 & 2032
- Table 80: Rest of South America LATAM Oilfield Chemicals Industry Volume (K Tons) Forecast, by Application 2019 & 2032
- Table 81: LATAM Oilfield Chemicals Industry Revenue Million Forecast, by Country 2019 & 2032
- Table 82: LATAM Oilfield Chemicals Industry Volume K Tons Forecast, by Country 2019 & 2032
- Table 83: United States LATAM Oilfield Chemicals Industry Revenue (Million) Forecast, by Application 2019 & 2032
- Table 84: United States LATAM Oilfield Chemicals Industry Volume (K Tons) Forecast, by Application 2019 & 2032
- Table 85: Canada LATAM Oilfield Chemicals Industry Revenue (Million) Forecast, by Application 2019 & 2032
- Table 86: Canada LATAM Oilfield Chemicals Industry Volume (K Tons) Forecast, by Application 2019 & 2032
- Table 87: Mexico LATAM Oilfield Chemicals Industry Revenue (Million) Forecast, by Application 2019 & 2032
- Table 88: Mexico LATAM Oilfield Chemicals Industry Volume (K Tons) Forecast, by Application 2019 & 2032
- Table 89: LATAM Oilfield Chemicals Industry Revenue Million Forecast, by Country 2019 & 2032
- Table 90: LATAM Oilfield Chemicals Industry Volume K Tons Forecast, by Country 2019 & 2032
- Table 91: United Arab Emirates LATAM Oilfield Chemicals Industry Revenue (Million) Forecast, by Application 2019 & 2032
- Table 92: United Arab Emirates LATAM Oilfield Chemicals Industry Volume (K Tons) Forecast, by Application 2019 & 2032
- Table 93: Saudi Arabia LATAM Oilfield Chemicals Industry Revenue (Million) Forecast, by Application 2019 & 2032
- Table 94: Saudi Arabia LATAM Oilfield Chemicals Industry Volume (K Tons) Forecast, by Application 2019 & 2032
- Table 95: South Africa LATAM Oilfield Chemicals Industry Revenue (Million) Forecast, by Application 2019 & 2032
- Table 96: South Africa LATAM Oilfield Chemicals Industry Volume (K Tons) Forecast, by Application 2019 & 2032
- Table 97: Rest of Middle East and Africa LATAM Oilfield Chemicals Industry Revenue (Million) Forecast, by Application 2019 & 2032
- Table 98: Rest of Middle East and Africa LATAM Oilfield Chemicals Industry Volume (K Tons) Forecast, by Application 2019 & 2032
- Table 99: LATAM Oilfield Chemicals Industry Revenue Million Forecast, by Chemical Type 2019 & 2032
- Table 100: LATAM Oilfield Chemicals Industry Volume K Tons Forecast, by Chemical Type 2019 & 2032
- Table 101: LATAM Oilfield Chemicals Industry Revenue Million Forecast, by Application 2019 & 2032
- Table 102: LATAM Oilfield Chemicals Industry Volume K Tons Forecast, by Application 2019 & 2032
- Table 103: LATAM Oilfield Chemicals Industry Revenue Million Forecast, by Country 2019 & 2032
- Table 104: LATAM Oilfield Chemicals Industry Volume K Tons Forecast, by Country 2019 & 2032
- Table 105: LATAM Oilfield Chemicals Industry Revenue Million Forecast, by Chemical Type 2019 & 2032
- Table 106: LATAM Oilfield Chemicals Industry Volume K Tons Forecast, by Chemical Type 2019 & 2032
- Table 107: LATAM Oilfield Chemicals Industry Revenue Million Forecast, by Application 2019 & 2032
- Table 108: LATAM Oilfield Chemicals Industry Volume K Tons Forecast, by Application 2019 & 2032
- Table 109: LATAM Oilfield Chemicals Industry Revenue Million Forecast, by Country 2019 & 2032
- Table 110: LATAM Oilfield Chemicals Industry Volume K Tons Forecast, by Country 2019 & 2032
- Table 111: LATAM Oilfield Chemicals Industry Revenue Million Forecast, by Chemical Type 2019 & 2032
- Table 112: LATAM Oilfield Chemicals Industry Volume K Tons Forecast, by Chemical Type 2019 & 2032
- Table 113: LATAM Oilfield Chemicals Industry Revenue Million Forecast, by Application 2019 & 2032
- Table 114: LATAM Oilfield Chemicals Industry Volume K Tons Forecast, by Application 2019 & 2032
- Table 115: LATAM Oilfield Chemicals Industry Revenue Million Forecast, by Country 2019 & 2032
- Table 116: LATAM Oilfield Chemicals Industry Volume K Tons Forecast, by Country 2019 & 2032
- Table 117: LATAM Oilfield Chemicals Industry Revenue Million Forecast, by Chemical Type 2019 & 2032
- Table 118: LATAM Oilfield Chemicals Industry Volume K Tons Forecast, by Chemical Type 2019 & 2032
- Table 119: LATAM Oilfield Chemicals Industry Revenue Million Forecast, by Application 2019 & 2032
- Table 120: LATAM Oilfield Chemicals Industry Volume K Tons Forecast, by Application 2019 & 2032
- Table 121: LATAM Oilfield Chemicals Industry Revenue Million Forecast, by Country 2019 & 2032
- Table 122: LATAM Oilfield Chemicals Industry Volume K Tons Forecast, by Country 2019 & 2032
- Table 123: LATAM Oilfield Chemicals Industry Revenue Million Forecast, by Chemical Type 2019 & 2032
- Table 124: LATAM Oilfield Chemicals Industry Volume K Tons Forecast, by Chemical Type 2019 & 2032
- Table 125: LATAM Oilfield Chemicals Industry Revenue Million Forecast, by Application 2019 & 2032
- Table 126: LATAM Oilfield Chemicals Industry Volume K Tons Forecast, by Application 2019 & 2032
- Table 127: LATAM Oilfield Chemicals Industry Revenue Million Forecast, by Country 2019 & 2032
- Table 128: LATAM Oilfield Chemicals Industry Volume K Tons Forecast, by Country 2019 & 2032
- Table 129: LATAM Oilfield Chemicals Industry Revenue Million Forecast, by Chemical Type 2019 & 2032
- Table 130: LATAM Oilfield Chemicals Industry Volume K Tons Forecast, by Chemical Type 2019 & 2032
- Table 131: LATAM Oilfield Chemicals Industry Revenue Million Forecast, by Application 2019 & 2032
- Table 132: LATAM Oilfield Chemicals Industry Volume K Tons Forecast, by Application 2019 & 2032
- Table 133: LATAM Oilfield Chemicals Industry Revenue Million Forecast, by Country 2019 & 2032
- Table 134: LATAM Oilfield Chemicals Industry Volume K Tons Forecast, by Country 2019 & 2032
- Table 135: LATAM Oilfield Chemicals Industry Revenue Million Forecast, by Chemical Type 2019 & 2032
- Table 136: LATAM Oilfield Chemicals Industry Volume K Tons Forecast, by Chemical Type 2019 & 2032
- Table 137: LATAM Oilfield Chemicals Industry Revenue Million Forecast, by Application 2019 & 2032
- Table 138: LATAM Oilfield Chemicals Industry Volume K Tons Forecast, by Application 2019 & 2032
- Table 139: LATAM Oilfield Chemicals Industry Revenue Million Forecast, by Country 2019 & 2032
- Table 140: LATAM Oilfield Chemicals Industry Volume K Tons Forecast, by Country 2019 & 2032
Frequently Asked Questions
1. What is the projected Compound Annual Growth Rate (CAGR) of the LATAM Oilfield Chemicals Industry?
The projected CAGR is approximately > 2.00%.
2. Which companies are prominent players in the LATAM Oilfield Chemicals Industry?
Key companies in the market include Solvay S A, Ashland Inc, Exxon Mobil Corporation, Croda International PLC, Dow Inc, Weatherford International Plc, BASF SE, Huntsman International LLC, Baker Hughes Company, Halliburton, Ecolab Inc, Petrolab Industrial E Comercial Ltda, Schlumberger Limited, Clariant AG.
3. What are the main segments of the LATAM Oilfield Chemicals Industry?
The market segments include Chemical Type, Application.
4. Can you provide details about the market size?
The market size is estimated to be USD XX Million as of 2022.
5. What are some drivers contributing to market growth?
Increasing Offshore activities in Brazil. Mexico & Argentina.
6. What are the notable trends driving market growth?
Increasing Demand from the Drilling and Cementing Segment.
7. Are there any restraints impacting market growth?
Downfall of Venezuela Economy.
8. Can you provide examples of recent developments in the market?
August 2022: Baker Hughes expanded its presence in Asia by establishing a new oilfield services chemicals manufacturing facility in Singapore, allowing for manufacturing optimization and faster delivery of fit-for-purpose chemical solutions. The 40,000-square-meter facility will manufacture, store, and distribute chemical solutions for the upstream, midstream, downstream, and adjacent industries.
9. What pricing options are available for accessing the report?
Pricing options include single-user, multi-user, and enterprise licenses priced at USD 4750, USD 5250, and USD 8750 respectively.
10. Is the market size provided in terms of value or volume?
The market size is provided in terms of value, measured in Million and volume, measured in K Tons.
11. Are there any specific market keywords associated with the report?
Yes, the market keyword associated with the report is "LATAM Oilfield Chemicals Industry," which aids in identifying and referencing the specific market segment covered.
12. How do I determine which pricing option suits my needs best?
The pricing options vary based on user requirements and access needs. Individual users may opt for single-user licenses, while businesses requiring broader access may choose multi-user or enterprise licenses for cost-effective access to the report.
13. Are there any additional resources or data provided in the LATAM Oilfield Chemicals Industry report?
While the report offers comprehensive insights, it's advisable to review the specific contents or supplementary materials provided to ascertain if additional resources or data are available.
14. How can I stay updated on further developments or reports in the LATAM Oilfield Chemicals Industry?
To stay informed about further developments, trends, and reports in the LATAM Oilfield Chemicals Industry, consider subscribing to industry newsletters, following relevant companies and organizations, or regularly checking reputable industry news sources and publications.
Methodology
Step 1 - Identification of Relevant Samples Size from Population Database


Step 2 - Approaches for Defining Global Market Size (Value, Volume* & Price*)

Note*: In applicable scenarios
Step 3 - Data Sources
Primary Research
- Web Analytics
- Survey Reports
- Research Institute
- Latest Research Reports
- Opinion Leaders
Secondary Research
- Annual Reports
- White Paper
- Latest Press Release
- Industry Association
- Paid Database
- Investor Presentations

Step 4 - Data Triangulation
Involves using different sources of information in order to increase the validity of a study
These sources are likely to be stakeholders in a program - participants, other researchers, program staff, other community members, and so on.
Then we put all data in single framework & apply various statistical tools to find out the dynamic on the market.
During the analysis stage, feedback from the stakeholder groups would be compared to determine areas of agreement as well as areas of divergence


