Exploring Key Trends in Insect Food Industry Market

Insect Food Industry by Production Analysis, by Consumption Analysis, by Import Market Analysis (Value & Volume), by Export Market Analysis (Value & Volume), by Price Trend Analysis, by North America (United States, Canada, Mexico), by South America (Brazil, Argentina, Rest of South America), by Europe (United Kingdom, Germany, France, Italy, Spain, Russia, Benelux, Nordics, Rest of Europe), by Middle East & Africa (Turkey, Israel, GCC, North Africa, South Africa, Rest of Middle East & Africa), by Asia Pacific (China, India, Japan, South Korea, ASEAN, Oceania, Rest of Asia Pacific) Forecast 2025-2033

Jun 26 2025
Base Year: 2024

234 Pages
Main Logo

Exploring Key Trends in Insect Food Industry Market


Home
Industries
Agriculture
sponsor image

Tailored for you

  • In-depth Analysis Tailored to Specified Regions or Segments
  • Company Profiles Customized to User Preferences
  • Comprehensive Insights Focused on Specific Segments or Regions
  • Customized Evaluation of Competitive Landscape to Meet Your Needs
  • Tailored Customization to Address Other Specific Requirements
Ask for customization


Key Insights

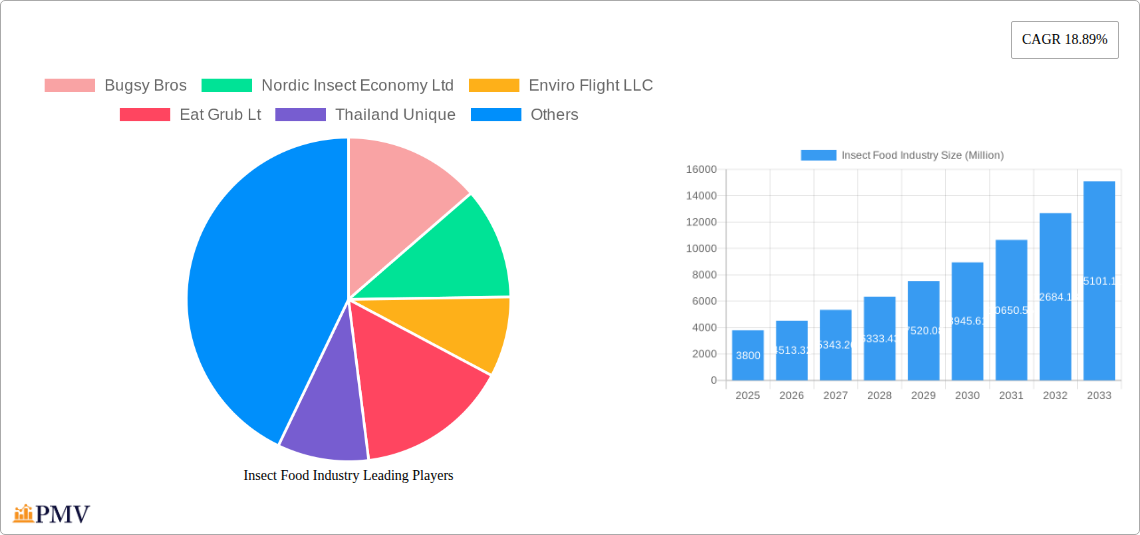
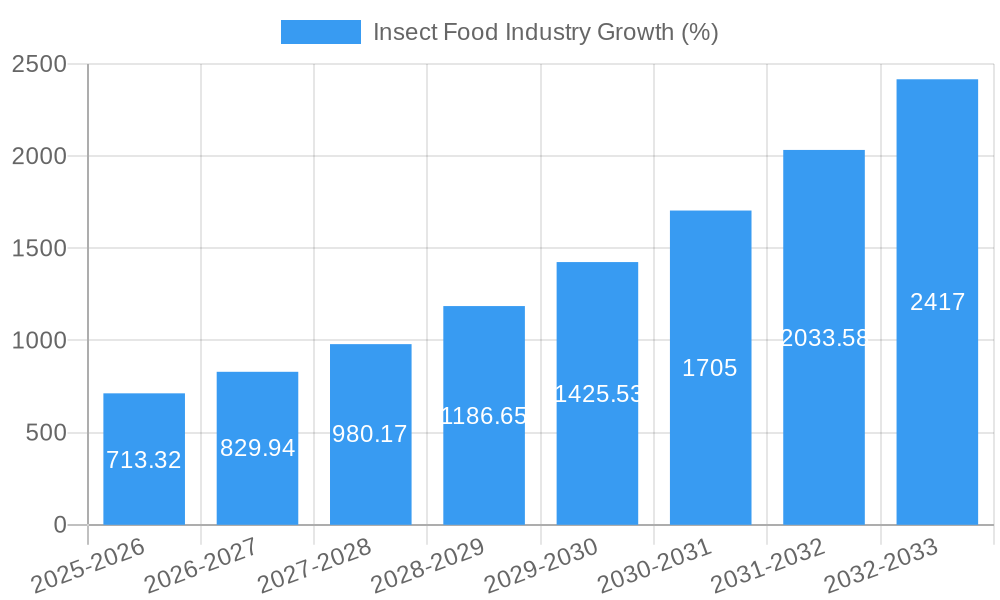
The global insect food market, valued at $3.80 billion in 2025, is experiencing robust growth, projected to expand at a compound annual growth rate (CAGR) of 18.89% from 2025 to 2033. This surge is driven by several key factors. Increasing consumer awareness of the environmental benefits of entomophagy (insect consumption) – significantly lower carbon footprint and land usage compared to traditional livestock – is a major driver. Furthermore, the rising global population and increasing demand for sustainable and alternative protein sources are fueling market expansion. The health benefits associated with insect consumption, including high protein content, essential vitamins, and minerals, are also attracting health-conscious consumers. Product innovation, with insects being processed into various forms such as flours, protein bars, and even whole insects, is broadening the market appeal and accessibility. Growth is further supported by supportive government policies and initiatives promoting sustainable food systems in several regions. While challenges remain, such as overcoming cultural barriers and establishing robust regulatory frameworks, the long-term prospects for the insect food industry appear extremely positive.

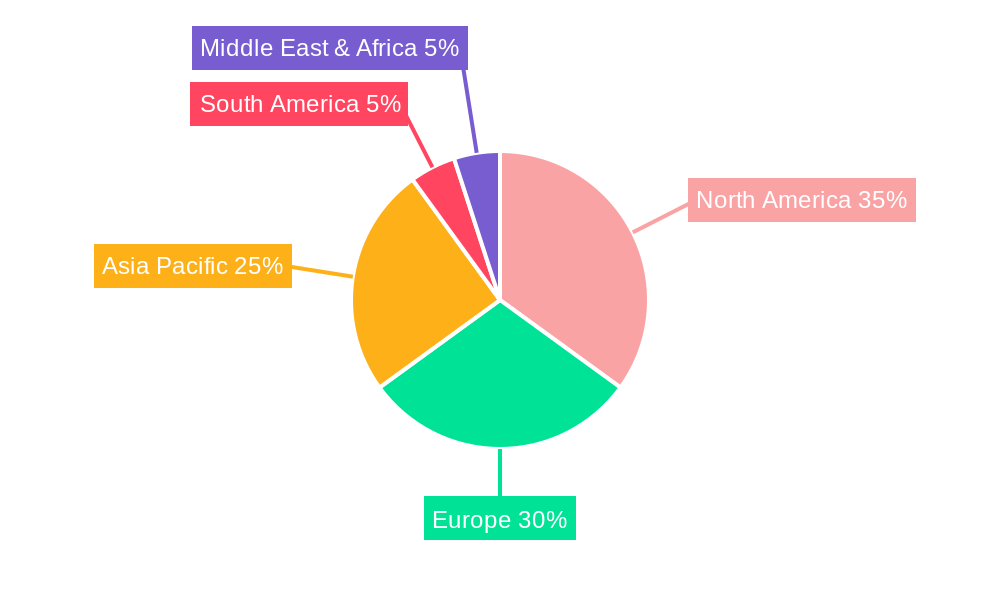
The market segmentation reveals key opportunities. Beetles, caterpillars, and Hymenoptera (ants, bees, wasps) currently dominate the insect type segment, reflecting established consumer acceptance and established supply chains. However, other insect types hold significant untapped potential. Similarly, the "as a whole" product type currently holds a larger market share, but processed forms such as flours and ingredients are showing strong growth and are expected to gain considerable market share as consumer familiarity increases. Geographically, North America and Europe are currently leading the market, reflecting higher consumer awareness and disposable income. However, Asia-Pacific, particularly China and Thailand, is predicted to experience significant growth in the coming years due to a large population and growing acceptance of insects as a food source. Companies involved in insect farming, processing, and distribution are playing an increasingly important role in driving market development and innovation. Ongoing research and development focusing on efficient insect farming techniques and diversified product development will be crucial for further market expansion.

Insect Food Industry Research Report - Market Size, Growth & Forecast

Insect Food Industry Market Report: 2019-2033

This comprehensive report provides an in-depth analysis of the burgeoning insect food industry, projecting a market valuation of xx Million by 2033. The study period covers 2019-2033, with 2025 as the base and estimated year. This report is crucial for investors, industry players (like Bugsy Bros, Nordic Insect Economy Ltd, Enviro Flight LLC, Eat Grub Ltd, Thailand Unique, Exo Inc, Proti-Farm, Entomo Farms Ltd, Deli Bugs Ltd, and Kreca Ento-Feed BV), and anyone seeking to understand this rapidly evolving sector. The report leverages extensive market research and incorporates real-world examples to illustrate key trends and opportunities.

Insect Food Industry Market Structure & Competitive Dynamics

The insect food market, while still nascent, displays increasing concentration with key players establishing significant market share. Innovation ecosystems are developing rapidly, driven by both established food companies and agile startups. Regulatory frameworks vary globally, creating both opportunities and challenges. Product substitutes, primarily traditional protein sources, face increasing competition due to sustainability concerns and the nutritional benefits of insects. End-user trends reveal a growing acceptance of insect-based foods, particularly amongst younger consumers. M&A activity is on the rise, with deals focusing on technology acquisition, market expansion, and securing supply chains. For example, the USD 250 Million investment in InnovaFeed highlights the considerable interest and capital influx in this sector. Deal values vary significantly, from small acquisitions to multi-million-dollar investments, reflecting the diversity of companies and strategies. The market share of individual companies is currently not completely consolidated, xx% of the market is dominated by the top 5 players with remaining market share is shared by numerous smaller companies.

Insect Food Industry Industry Trends & Insights

The insect food industry exhibits a robust Compound Annual Growth Rate (CAGR) of xx% during the forecast period (2025-2033). This growth is fueled by several key factors: increasing consumer awareness of sustainability issues, rising demand for alternative protein sources, and technological advancements that improve insect farming efficiency and product development. Technological disruptions, such as precision fermentation and advanced processing techniques, are transforming the production landscape, enabling larger-scale operations and improving product quality. Consumer preferences are shifting toward healthier and more sustainable food choices, creating a receptive market for insect-based products. Competitive dynamics are characterized by both collaboration and competition, with large food companies partnering with insect producers while smaller players innovate rapidly in niche markets. Market penetration remains relatively low in many regions but is expected to increase significantly by 2033, especially in developed countries where consumer awareness and acceptance of insect-based foods are growing the fastest.

Insect Food Industry Growth

Dominant Markets & Segments in Insect Food Industry

While the global market offers considerable potential, certain regions, countries, and product segments are demonstrating faster growth.

  • Leading Region: North America and Europe currently hold dominant positions due to higher consumer awareness and regulatory clarity. However, Asia is expected to experience significant growth in the coming years.
  • Leading Insect Type: Beetles and Crickets (Orthoptera) currently lead in terms of production volume and market availability. This is partly due to established farming practices and consumer familiarity.
  • Leading Product Type: "As an ingredient" currently dominates the market, with insect flour and protein powder finding application in a range of food products. The "As a Whole" segment is experiencing growth driven by innovative culinary applications.

Key drivers for regional dominance include supportive economic policies, well-developed infrastructure for food processing and distribution, and consumer acceptance of novel food sources. The dominance of beetles and crickets is linked to their ease of farming, nutritional profile, and acceptance by consumers. The prominence of "As an ingredient" reflects the current stage of market development, where integrating insects into existing food systems is prioritized.

Insect Food Industry Product Innovations

Recent innovations include the development of insect-based protein bars, snacks, and pet foods. The focus is on improving taste and texture to enhance consumer acceptance. Companies are leveraging technological advancements to create value-added products with specific nutritional profiles, such as high protein and fiber options. These products compete on the basis of taste, nutritional value, price, and sustainability. The market fit is steadily improving as consumer acceptance increases and production scales up, allowing for price competitiveness.

Report Segmentation & Scope

This report segments the insect food market based on insect type (Beetles, Caterpillar, Hymenoptera, Orthoptera, Tree Bugs, Other Insect Types) and product type (As a Whole, Raw, As an Ingredient). Each segment is analyzed in terms of growth projections, market size, and competitive dynamics. The growth projections vary across segments, with certain insect types and product forms experiencing faster growth than others. Competitive dynamics also vary depending on the segment; for instance, the "As an ingredient" segment is characterized by intense competition among ingredient suppliers, while the "As a Whole" segment may offer more opportunities for differentiation.

Key Drivers of Insect Food Industry Growth

Several factors drive the insect food industry's growth. Technological advancements in insect farming and processing lead to increased efficiency and scalability. Economic incentives, such as government subsidies and investments, promote development. Favorable regulatory changes and rising consumer awareness of sustainable food solutions boost market acceptance. For example, the growing acceptance of insect-based protein is due to its lower environmental impact compared to conventional livestock farming.

Challenges in the Insect Food Industry Sector

Despite the potential, several challenges hinder the sector's growth. Regulatory hurdles related to food safety and labeling vary across regions, creating complexities for companies. Supply chain issues, particularly related to securing reliable and sustainable insect farming operations, pose a significant constraint. Competitive pressures from established food companies and consumer hesitancy towards novel food sources limit market penetration. The cultural perception of insect consumption is also a major challenge, where negative connotations can limit market expansion.

Leading Players in the Insect Food Industry Market

  • Bugsy Bros
  • Nordic Insect Economy Ltd
  • Enviro Flight LLC
  • Eat Grub Ltd
  • Thailand Unique
  • Exo Inc
  • Proti-Farm
  • Entomo Farms Ltd
  • Deli Bugs Ltd
  • Kreca Ento-Feed BV

Key Developments in Insect Food Industry Sector

  • September 2022: Lotte Confectionery and Aspire Food Group signed a MOU to cooperate on protein alternatives and edible insects, signaling increased interest from major food companies.
  • September 2022: InnovaFeed secured USD 250 Million in investment to expand its black soldier fly production facility, indicating significant capital influx into the sector.
  • April 2022: The ValuSect consortium provided EUR 460,000 (USD 496,600) in services to 18 edible insect enterprises, supporting innovation and consumer acceptance.

Strategic Insect Food Industry Market Outlook

The insect food industry is poised for substantial growth, driven by increasing consumer demand for sustainable protein sources and technological innovations that improve production efficiency and product quality. Strategic opportunities exist in developing innovative products tailored to specific consumer preferences, expanding into new geographic markets, and forging strategic partnerships with established food companies. Companies that can overcome regulatory hurdles, manage supply chains effectively, and address consumer perceptions will be well-positioned to capitalize on this burgeoning market.

Insect Food Industry Segmentation

  • 1. Production Analysis
  • 2. Consumption Analysis
  • 3. Import Market Analysis (Value & Volume)
  • 4. Export Market Analysis (Value & Volume)
  • 5. Price Trend Analysis

Insect Food Industry Segmentation By Geography

  • 1. North America
    • 1.1. United States
    • 1.2. Canada
    • 1.3. Mexico
  • 2. South America
    • 2.1. Brazil
    • 2.2. Argentina
    • 2.3. Rest of South America
  • 3. Europe
    • 3.1. United Kingdom
    • 3.2. Germany
    • 3.3. France
    • 3.4. Italy
    • 3.5. Spain
    • 3.6. Russia
    • 3.7. Benelux
    • 3.8. Nordics
    • 3.9. Rest of Europe
  • 4. Middle East & Africa
    • 4.1. Turkey
    • 4.2. Israel
    • 4.3. GCC
    • 4.4. North Africa
    • 4.5. South Africa
    • 4.6. Rest of Middle East & Africa
  • 5. Asia Pacific
    • 5.1. China
    • 5.2. India
    • 5.3. Japan
    • 5.4. South Korea
    • 5.5. ASEAN
    • 5.6. Oceania
    • 5.7. Rest of Asia Pacific
Insect Food Industry Regional Share


Insect Food Industry REPORT HIGHLIGHTS

AspectsDetails
Study Period 2019-2033
Base Year 2024
Estimated Year 2025
Forecast Period2025-2033
Historical Period2019-2024
Growth RateCAGR of 18.89% from 2019-2033
Segmentation
    • By Production Analysis
    • By Consumption Analysis
    • By Import Market Analysis (Value & Volume)
    • By Export Market Analysis (Value & Volume)
    • By Price Trend Analysis
  • By Geography
    • North America
      • United States
      • Canada
      • Mexico
    • South America
      • Brazil
      • Argentina
      • Rest of South America
    • Europe
      • United Kingdom
      • Germany
      • France
      • Italy
      • Spain
      • Russia
      • Benelux
      • Nordics
      • Rest of Europe
    • Middle East & Africa
      • Turkey
      • Israel
      • GCC
      • North Africa
      • South Africa
      • Rest of Middle East & Africa
    • Asia Pacific
      • China
      • India
      • Japan
      • South Korea
      • ASEAN
      • Oceania
      • Rest of Asia Pacific


Table of Contents

  1. 1. Introduction
    • 1.1. Research Scope
    • 1.2. Market Segmentation
    • 1.3. Research Methodology
    • 1.4. Definitions and Assumptions
  2. 2. Executive Summary
    • 2.1. Introduction
  3. 3. Market Dynamics
    • 3.1. Introduction
      • 3.2. Market Drivers
        • 3.2.1. Decreasing Per Capita Arable Land; Increased Demand for Food
      • 3.3. Market Restrains
        • 3.3.1. High Initial Investments; Requirement of Precision Agriculture
      • 3.4. Market Trends
        • 3.4.1. Easy Availability and High Protein Content in The Edible Insects
  4. 4. Market Factor Analysis
    • 4.1. Porters Five Forces
    • 4.2. Supply/Value Chain
    • 4.3. PESTEL analysis
    • 4.4. Market Entropy
    • 4.5. Patent/Trademark Analysis
  5. 5. Global Insect Food Industry Analysis, Insights and Forecast, 2019-2031
    • 5.1. Market Analysis, Insights and Forecast - by Production Analysis
      • 5.2. Market Analysis, Insights and Forecast - by Consumption Analysis
        • 5.3. Market Analysis, Insights and Forecast - by Import Market Analysis (Value & Volume)
          • 5.4. Market Analysis, Insights and Forecast - by Export Market Analysis (Value & Volume)
            • 5.5. Market Analysis, Insights and Forecast - by Price Trend Analysis
              • 5.6. Market Analysis, Insights and Forecast - by Region
                • 5.6.1. North America
                • 5.6.2. South America
                • 5.6.3. Europe
                • 5.6.4. Middle East & Africa
                • 5.6.5. Asia Pacific
            • 6. North America Insect Food Industry Analysis, Insights and Forecast, 2019-2031
              • 6.1. Market Analysis, Insights and Forecast - by Production Analysis
                • 6.2. Market Analysis, Insights and Forecast - by Consumption Analysis
                  • 6.3. Market Analysis, Insights and Forecast - by Import Market Analysis (Value & Volume)
                    • 6.4. Market Analysis, Insights and Forecast - by Export Market Analysis (Value & Volume)
                      • 6.5. Market Analysis, Insights and Forecast - by Price Trend Analysis
                      • 7. South America Insect Food Industry Analysis, Insights and Forecast, 2019-2031
                        • 7.1. Market Analysis, Insights and Forecast - by Production Analysis
                          • 7.2. Market Analysis, Insights and Forecast - by Consumption Analysis
                            • 7.3. Market Analysis, Insights and Forecast - by Import Market Analysis (Value & Volume)
                              • 7.4. Market Analysis, Insights and Forecast - by Export Market Analysis (Value & Volume)
                                • 7.5. Market Analysis, Insights and Forecast - by Price Trend Analysis
                                • 8. Europe Insect Food Industry Analysis, Insights and Forecast, 2019-2031
                                  • 8.1. Market Analysis, Insights and Forecast - by Production Analysis
                                    • 8.2. Market Analysis, Insights and Forecast - by Consumption Analysis
                                      • 8.3. Market Analysis, Insights and Forecast - by Import Market Analysis (Value & Volume)
                                        • 8.4. Market Analysis, Insights and Forecast - by Export Market Analysis (Value & Volume)
                                          • 8.5. Market Analysis, Insights and Forecast - by Price Trend Analysis
                                          • 9. Middle East & Africa Insect Food Industry Analysis, Insights and Forecast, 2019-2031
                                            • 9.1. Market Analysis, Insights and Forecast - by Production Analysis
                                              • 9.2. Market Analysis, Insights and Forecast - by Consumption Analysis
                                                • 9.3. Market Analysis, Insights and Forecast - by Import Market Analysis (Value & Volume)
                                                  • 9.4. Market Analysis, Insights and Forecast - by Export Market Analysis (Value & Volume)
                                                    • 9.5. Market Analysis, Insights and Forecast - by Price Trend Analysis
                                                    • 10. Asia Pacific Insect Food Industry Analysis, Insights and Forecast, 2019-2031
                                                      • 10.1. Market Analysis, Insights and Forecast - by Production Analysis
                                                        • 10.2. Market Analysis, Insights and Forecast - by Consumption Analysis
                                                          • 10.3. Market Analysis, Insights and Forecast - by Import Market Analysis (Value & Volume)
                                                            • 10.4. Market Analysis, Insights and Forecast - by Export Market Analysis (Value & Volume)
                                                              • 10.5. Market Analysis, Insights and Forecast - by Price Trend Analysis
                                                              • 11. North America Insect Food Industry Analysis, Insights and Forecast, 2019-2031
                                                                  • 11.1. Market Analysis, Insights and Forecast - By Country/Sub-region
                                                                    • 11.1.1 United States
                                                                    • 11.1.2 Canada
                                                                    • 11.1.3 Mexico
                                                                    • 11.1.4 Rest of North America
                                                              • 12. Europe Insect Food Industry Analysis, Insights and Forecast, 2019-2031
                                                                  • 12.1. Market Analysis, Insights and Forecast - By Country/Sub-region
                                                                    • 12.1.1 Germany
                                                                    • 12.1.2 United Kingdom
                                                                    • 12.1.3 France
                                                                    • 12.1.4 Russia
                                                                    • 12.1.5 Poland
                                                                    • 12.1.6 Rest of Europe
                                                              • 13. Asia Pacific Insect Food Industry Analysis, Insights and Forecast, 2019-2031
                                                                  • 13.1. Market Analysis, Insights and Forecast - By Country/Sub-region
                                                                    • 13.1.1 China
                                                                    • 13.1.2 Japan
                                                                    • 13.1.3 Thailand
                                                                    • 13.1.4 Rest of Asia Pacific
                                                              • 14. South America Insect Food Industry Analysis, Insights and Forecast, 2019-2031
                                                                  • 14.1. Market Analysis, Insights and Forecast - By Country/Sub-region
                                                                    • 14.1.1 Brazil
                                                                    • 14.1.2 Argentina
                                                                    • 14.1.3 Rest of South America
                                                              • 15. Middle East Insect Food Industry Analysis, Insights and Forecast, 2019-2031
                                                                  • 15.1. Market Analysis, Insights and Forecast - By Country/Sub-region
                                                                    • 15.1.1.
                                                              • 16. South Africa Insect Food Industry Analysis, Insights and Forecast, 2019-2031
                                                                  • 16.1. Market Analysis, Insights and Forecast - By Country/Sub-region
                                                                    • 16.1.1. Rest of Middle East
                                                              • 17. Competitive Analysis
                                                                • 17.1. Global Market Share Analysis 2024
                                                                  • 17.2. Company Profiles
                                                                    • 17.2.1 Bugsy Bros
                                                                      • 17.2.1.1. Overview
                                                                      • 17.2.1.2. Products
                                                                      • 17.2.1.3. SWOT Analysis
                                                                      • 17.2.1.4. Recent Developments
                                                                      • 17.2.1.5. Financials (Based on Availability)
                                                                    • 17.2.2 Nordic Insect Economy Ltd
                                                                      • 17.2.2.1. Overview
                                                                      • 17.2.2.2. Products
                                                                      • 17.2.2.3. SWOT Analysis
                                                                      • 17.2.2.4. Recent Developments
                                                                      • 17.2.2.5. Financials (Based on Availability)
                                                                    • 17.2.3 Enviro Flight LLC
                                                                      • 17.2.3.1. Overview
                                                                      • 17.2.3.2. Products
                                                                      • 17.2.3.3. SWOT Analysis
                                                                      • 17.2.3.4. Recent Developments
                                                                      • 17.2.3.5. Financials (Based on Availability)
                                                                    • 17.2.4 Eat Grub Lt
                                                                      • 17.2.4.1. Overview
                                                                      • 17.2.4.2. Products
                                                                      • 17.2.4.3. SWOT Analysis
                                                                      • 17.2.4.4. Recent Developments
                                                                      • 17.2.4.5. Financials (Based on Availability)
                                                                    • 17.2.5 Thailand Unique
                                                                      • 17.2.5.1. Overview
                                                                      • 17.2.5.2. Products
                                                                      • 17.2.5.3. SWOT Analysis
                                                                      • 17.2.5.4. Recent Developments
                                                                      • 17.2.5.5. Financials (Based on Availability)
                                                                    • 17.2.6 Exo Inc
                                                                      • 17.2.6.1. Overview
                                                                      • 17.2.6.2. Products
                                                                      • 17.2.6.3. SWOT Analysis
                                                                      • 17.2.6.4. Recent Developments
                                                                      • 17.2.6.5. Financials (Based on Availability)
                                                                    • 17.2.7 Proti - Farm
                                                                      • 17.2.7.1. Overview
                                                                      • 17.2.7.2. Products
                                                                      • 17.2.7.3. SWOT Analysis
                                                                      • 17.2.7.4. Recent Developments
                                                                      • 17.2.7.5. Financials (Based on Availability)
                                                                    • 17.2.8 Entomo Farms Ltd
                                                                      • 17.2.8.1. Overview
                                                                      • 17.2.8.2. Products
                                                                      • 17.2.8.3. SWOT Analysis
                                                                      • 17.2.8.4. Recent Developments
                                                                      • 17.2.8.5. Financials (Based on Availability)
                                                                    • 17.2.9 Deli Bugs Ltd
                                                                      • 17.2.9.1. Overview
                                                                      • 17.2.9.2. Products
                                                                      • 17.2.9.3. SWOT Analysis
                                                                      • 17.2.9.4. Recent Developments
                                                                      • 17.2.9.5. Financials (Based on Availability)
                                                                    • 17.2.10 Kreca Ento - Feed BV
                                                                      • 17.2.10.1. Overview
                                                                      • 17.2.10.2. Products
                                                                      • 17.2.10.3. SWOT Analysis
                                                                      • 17.2.10.4. Recent Developments
                                                                      • 17.2.10.5. Financials (Based on Availability)

                                                              List of Figures

                                                              1. Figure 1: Global Insect Food Industry Revenue Breakdown (Million, %) by Region 2024 & 2032
                                                              2. Figure 2: North America Insect Food Industry Revenue (Million), by Country 2024 & 2032
                                                              3. Figure 3: North America Insect Food Industry Revenue Share (%), by Country 2024 & 2032
                                                              4. Figure 4: Europe Insect Food Industry Revenue (Million), by Country 2024 & 2032
                                                              5. Figure 5: Europe Insect Food Industry Revenue Share (%), by Country 2024 & 2032
                                                              6. Figure 6: Asia Pacific Insect Food Industry Revenue (Million), by Country 2024 & 2032
                                                              7. Figure 7: Asia Pacific Insect Food Industry Revenue Share (%), by Country 2024 & 2032
                                                              8. Figure 8: South America Insect Food Industry Revenue (Million), by Country 2024 & 2032
                                                              9. Figure 9: South America Insect Food Industry Revenue Share (%), by Country 2024 & 2032
                                                              10. Figure 10: Middle East Insect Food Industry Revenue (Million), by Country 2024 & 2032
                                                              11. Figure 11: Middle East Insect Food Industry Revenue Share (%), by Country 2024 & 2032
                                                              12. Figure 12: South Africa Insect Food Industry Revenue (Million), by Country 2024 & 2032
                                                              13. Figure 13: South Africa Insect Food Industry Revenue Share (%), by Country 2024 & 2032
                                                              14. Figure 14: North America Insect Food Industry Revenue (Million), by Production Analysis 2024 & 2032
                                                              15. Figure 15: North America Insect Food Industry Revenue Share (%), by Production Analysis 2024 & 2032
                                                              16. Figure 16: North America Insect Food Industry Revenue (Million), by Consumption Analysis 2024 & 2032
                                                              17. Figure 17: North America Insect Food Industry Revenue Share (%), by Consumption Analysis 2024 & 2032
                                                              18. Figure 18: North America Insect Food Industry Revenue (Million), by Import Market Analysis (Value & Volume) 2024 & 2032
                                                              19. Figure 19: North America Insect Food Industry Revenue Share (%), by Import Market Analysis (Value & Volume) 2024 & 2032
                                                              20. Figure 20: North America Insect Food Industry Revenue (Million), by Export Market Analysis (Value & Volume) 2024 & 2032
                                                              21. Figure 21: North America Insect Food Industry Revenue Share (%), by Export Market Analysis (Value & Volume) 2024 & 2032
                                                              22. Figure 22: North America Insect Food Industry Revenue (Million), by Price Trend Analysis 2024 & 2032
                                                              23. Figure 23: North America Insect Food Industry Revenue Share (%), by Price Trend Analysis 2024 & 2032
                                                              24. Figure 24: North America Insect Food Industry Revenue (Million), by Country 2024 & 2032
                                                              25. Figure 25: North America Insect Food Industry Revenue Share (%), by Country 2024 & 2032
                                                              26. Figure 26: South America Insect Food Industry Revenue (Million), by Production Analysis 2024 & 2032
                                                              27. Figure 27: South America Insect Food Industry Revenue Share (%), by Production Analysis 2024 & 2032
                                                              28. Figure 28: South America Insect Food Industry Revenue (Million), by Consumption Analysis 2024 & 2032
                                                              29. Figure 29: South America Insect Food Industry Revenue Share (%), by Consumption Analysis 2024 & 2032
                                                              30. Figure 30: South America Insect Food Industry Revenue (Million), by Import Market Analysis (Value & Volume) 2024 & 2032
                                                              31. Figure 31: South America Insect Food Industry Revenue Share (%), by Import Market Analysis (Value & Volume) 2024 & 2032
                                                              32. Figure 32: South America Insect Food Industry Revenue (Million), by Export Market Analysis (Value & Volume) 2024 & 2032
                                                              33. Figure 33: South America Insect Food Industry Revenue Share (%), by Export Market Analysis (Value & Volume) 2024 & 2032
                                                              34. Figure 34: South America Insect Food Industry Revenue (Million), by Price Trend Analysis 2024 & 2032
                                                              35. Figure 35: South America Insect Food Industry Revenue Share (%), by Price Trend Analysis 2024 & 2032
                                                              36. Figure 36: South America Insect Food Industry Revenue (Million), by Country 2024 & 2032
                                                              37. Figure 37: South America Insect Food Industry Revenue Share (%), by Country 2024 & 2032
                                                              38. Figure 38: Europe Insect Food Industry Revenue (Million), by Production Analysis 2024 & 2032
                                                              39. Figure 39: Europe Insect Food Industry Revenue Share (%), by Production Analysis 2024 & 2032
                                                              40. Figure 40: Europe Insect Food Industry Revenue (Million), by Consumption Analysis 2024 & 2032
                                                              41. Figure 41: Europe Insect Food Industry Revenue Share (%), by Consumption Analysis 2024 & 2032
                                                              42. Figure 42: Europe Insect Food Industry Revenue (Million), by Import Market Analysis (Value & Volume) 2024 & 2032
                                                              43. Figure 43: Europe Insect Food Industry Revenue Share (%), by Import Market Analysis (Value & Volume) 2024 & 2032
                                                              44. Figure 44: Europe Insect Food Industry Revenue (Million), by Export Market Analysis (Value & Volume) 2024 & 2032
                                                              45. Figure 45: Europe Insect Food Industry Revenue Share (%), by Export Market Analysis (Value & Volume) 2024 & 2032
                                                              46. Figure 46: Europe Insect Food Industry Revenue (Million), by Price Trend Analysis 2024 & 2032
                                                              47. Figure 47: Europe Insect Food Industry Revenue Share (%), by Price Trend Analysis 2024 & 2032
                                                              48. Figure 48: Europe Insect Food Industry Revenue (Million), by Country 2024 & 2032
                                                              49. Figure 49: Europe Insect Food Industry Revenue Share (%), by Country 2024 & 2032
                                                              50. Figure 50: Middle East & Africa Insect Food Industry Revenue (Million), by Production Analysis 2024 & 2032
                                                              51. Figure 51: Middle East & Africa Insect Food Industry Revenue Share (%), by Production Analysis 2024 & 2032
                                                              52. Figure 52: Middle East & Africa Insect Food Industry Revenue (Million), by Consumption Analysis 2024 & 2032
                                                              53. Figure 53: Middle East & Africa Insect Food Industry Revenue Share (%), by Consumption Analysis 2024 & 2032
                                                              54. Figure 54: Middle East & Africa Insect Food Industry Revenue (Million), by Import Market Analysis (Value & Volume) 2024 & 2032
                                                              55. Figure 55: Middle East & Africa Insect Food Industry Revenue Share (%), by Import Market Analysis (Value & Volume) 2024 & 2032
                                                              56. Figure 56: Middle East & Africa Insect Food Industry Revenue (Million), by Export Market Analysis (Value & Volume) 2024 & 2032
                                                              57. Figure 57: Middle East & Africa Insect Food Industry Revenue Share (%), by Export Market Analysis (Value & Volume) 2024 & 2032
                                                              58. Figure 58: Middle East & Africa Insect Food Industry Revenue (Million), by Price Trend Analysis 2024 & 2032
                                                              59. Figure 59: Middle East & Africa Insect Food Industry Revenue Share (%), by Price Trend Analysis 2024 & 2032
                                                              60. Figure 60: Middle East & Africa Insect Food Industry Revenue (Million), by Country 2024 & 2032
                                                              61. Figure 61: Middle East & Africa Insect Food Industry Revenue Share (%), by Country 2024 & 2032
                                                              62. Figure 62: Asia Pacific Insect Food Industry Revenue (Million), by Production Analysis 2024 & 2032
                                                              63. Figure 63: Asia Pacific Insect Food Industry Revenue Share (%), by Production Analysis 2024 & 2032
                                                              64. Figure 64: Asia Pacific Insect Food Industry Revenue (Million), by Consumption Analysis 2024 & 2032
                                                              65. Figure 65: Asia Pacific Insect Food Industry Revenue Share (%), by Consumption Analysis 2024 & 2032
                                                              66. Figure 66: Asia Pacific Insect Food Industry Revenue (Million), by Import Market Analysis (Value & Volume) 2024 & 2032
                                                              67. Figure 67: Asia Pacific Insect Food Industry Revenue Share (%), by Import Market Analysis (Value & Volume) 2024 & 2032
                                                              68. Figure 68: Asia Pacific Insect Food Industry Revenue (Million), by Export Market Analysis (Value & Volume) 2024 & 2032
                                                              69. Figure 69: Asia Pacific Insect Food Industry Revenue Share (%), by Export Market Analysis (Value & Volume) 2024 & 2032
                                                              70. Figure 70: Asia Pacific Insect Food Industry Revenue (Million), by Price Trend Analysis 2024 & 2032
                                                              71. Figure 71: Asia Pacific Insect Food Industry Revenue Share (%), by Price Trend Analysis 2024 & 2032
                                                              72. Figure 72: Asia Pacific Insect Food Industry Revenue (Million), by Country 2024 & 2032
                                                              73. Figure 73: Asia Pacific Insect Food Industry Revenue Share (%), by Country 2024 & 2032

                                                              List of Tables

                                                              1. Table 1: Global Insect Food Industry Revenue Million Forecast, by Region 2019 & 2032
                                                              2. Table 2: Global Insect Food Industry Revenue Million Forecast, by Production Analysis 2019 & 2032
                                                              3. Table 3: Global Insect Food Industry Revenue Million Forecast, by Consumption Analysis 2019 & 2032
                                                              4. Table 4: Global Insect Food Industry Revenue Million Forecast, by Import Market Analysis (Value & Volume) 2019 & 2032
                                                              5. Table 5: Global Insect Food Industry Revenue Million Forecast, by Export Market Analysis (Value & Volume) 2019 & 2032
                                                              6. Table 6: Global Insect Food Industry Revenue Million Forecast, by Price Trend Analysis 2019 & 2032
                                                              7. Table 7: Global Insect Food Industry Revenue Million Forecast, by Region 2019 & 2032
                                                              8. Table 8: Global Insect Food Industry Revenue Million Forecast, by Country 2019 & 2032
                                                              9. Table 9: United States Insect Food Industry Revenue (Million) Forecast, by Application 2019 & 2032
                                                              10. Table 10: Canada Insect Food Industry Revenue (Million) Forecast, by Application 2019 & 2032
                                                              11. Table 11: Mexico Insect Food Industry Revenue (Million) Forecast, by Application 2019 & 2032
                                                              12. Table 12: Rest of North America Insect Food Industry Revenue (Million) Forecast, by Application 2019 & 2032
                                                              13. Table 13: Global Insect Food Industry Revenue Million Forecast, by Country 2019 & 2032
                                                              14. Table 14: Germany Insect Food Industry Revenue (Million) Forecast, by Application 2019 & 2032
                                                              15. Table 15: United Kingdom Insect Food Industry Revenue (Million) Forecast, by Application 2019 & 2032
                                                              16. Table 16: France Insect Food Industry Revenue (Million) Forecast, by Application 2019 & 2032
                                                              17. Table 17: Russia Insect Food Industry Revenue (Million) Forecast, by Application 2019 & 2032
                                                              18. Table 18: Poland Insect Food Industry Revenue (Million) Forecast, by Application 2019 & 2032
                                                              19. Table 19: Rest of Europe Insect Food Industry Revenue (Million) Forecast, by Application 2019 & 2032
                                                              20. Table 20: Global Insect Food Industry Revenue Million Forecast, by Country 2019 & 2032
                                                              21. Table 21: China Insect Food Industry Revenue (Million) Forecast, by Application 2019 & 2032
                                                              22. Table 22: Japan Insect Food Industry Revenue (Million) Forecast, by Application 2019 & 2032
                                                              23. Table 23: Thailand Insect Food Industry Revenue (Million) Forecast, by Application 2019 & 2032
                                                              24. Table 24: Rest of Asia Pacific Insect Food Industry Revenue (Million) Forecast, by Application 2019 & 2032
                                                              25. Table 25: Global Insect Food Industry Revenue Million Forecast, by Country 2019 & 2032
                                                              26. Table 26: Brazil Insect Food Industry Revenue (Million) Forecast, by Application 2019 & 2032
                                                              27. Table 27: Argentina Insect Food Industry Revenue (Million) Forecast, by Application 2019 & 2032
                                                              28. Table 28: Rest of South America Insect Food Industry Revenue (Million) Forecast, by Application 2019 & 2032
                                                              29. Table 29: Global Insect Food Industry Revenue Million Forecast, by Country 2019 & 2032
                                                              30. Table 30: Insect Food Industry Revenue (Million) Forecast, by Application 2019 & 2032
                                                              31. Table 31: Global Insect Food Industry Revenue Million Forecast, by Country 2019 & 2032
                                                              32. Table 32: Rest of Middle East Insect Food Industry Revenue (Million) Forecast, by Application 2019 & 2032
                                                              33. Table 33: Global Insect Food Industry Revenue Million Forecast, by Production Analysis 2019 & 2032
                                                              34. Table 34: Global Insect Food Industry Revenue Million Forecast, by Consumption Analysis 2019 & 2032
                                                              35. Table 35: Global Insect Food Industry Revenue Million Forecast, by Import Market Analysis (Value & Volume) 2019 & 2032
                                                              36. Table 36: Global Insect Food Industry Revenue Million Forecast, by Export Market Analysis (Value & Volume) 2019 & 2032
                                                              37. Table 37: Global Insect Food Industry Revenue Million Forecast, by Price Trend Analysis 2019 & 2032
                                                              38. Table 38: Global Insect Food Industry Revenue Million Forecast, by Country 2019 & 2032
                                                              39. Table 39: United States Insect Food Industry Revenue (Million) Forecast, by Application 2019 & 2032
                                                              40. Table 40: Canada Insect Food Industry Revenue (Million) Forecast, by Application 2019 & 2032
                                                              41. Table 41: Mexico Insect Food Industry Revenue (Million) Forecast, by Application 2019 & 2032
                                                              42. Table 42: Global Insect Food Industry Revenue Million Forecast, by Production Analysis 2019 & 2032
                                                              43. Table 43: Global Insect Food Industry Revenue Million Forecast, by Consumption Analysis 2019 & 2032
                                                              44. Table 44: Global Insect Food Industry Revenue Million Forecast, by Import Market Analysis (Value & Volume) 2019 & 2032
                                                              45. Table 45: Global Insect Food Industry Revenue Million Forecast, by Export Market Analysis (Value & Volume) 2019 & 2032
                                                              46. Table 46: Global Insect Food Industry Revenue Million Forecast, by Price Trend Analysis 2019 & 2032
                                                              47. Table 47: Global Insect Food Industry Revenue Million Forecast, by Country 2019 & 2032
                                                              48. Table 48: Brazil Insect Food Industry Revenue (Million) Forecast, by Application 2019 & 2032
                                                              49. Table 49: Argentina Insect Food Industry Revenue (Million) Forecast, by Application 2019 & 2032
                                                              50. Table 50: Rest of South America Insect Food Industry Revenue (Million) Forecast, by Application 2019 & 2032
                                                              51. Table 51: Global Insect Food Industry Revenue Million Forecast, by Production Analysis 2019 & 2032
                                                              52. Table 52: Global Insect Food Industry Revenue Million Forecast, by Consumption Analysis 2019 & 2032
                                                              53. Table 53: Global Insect Food Industry Revenue Million Forecast, by Import Market Analysis (Value & Volume) 2019 & 2032
                                                              54. Table 54: Global Insect Food Industry Revenue Million Forecast, by Export Market Analysis (Value & Volume) 2019 & 2032
                                                              55. Table 55: Global Insect Food Industry Revenue Million Forecast, by Price Trend Analysis 2019 & 2032
                                                              56. Table 56: Global Insect Food Industry Revenue Million Forecast, by Country 2019 & 2032
                                                              57. Table 57: United Kingdom Insect Food Industry Revenue (Million) Forecast, by Application 2019 & 2032
                                                              58. Table 58: Germany Insect Food Industry Revenue (Million) Forecast, by Application 2019 & 2032
                                                              59. Table 59: France Insect Food Industry Revenue (Million) Forecast, by Application 2019 & 2032
                                                              60. Table 60: Italy Insect Food Industry Revenue (Million) Forecast, by Application 2019 & 2032
                                                              61. Table 61: Spain Insect Food Industry Revenue (Million) Forecast, by Application 2019 & 2032
                                                              62. Table 62: Russia Insect Food Industry Revenue (Million) Forecast, by Application 2019 & 2032
                                                              63. Table 63: Benelux Insect Food Industry Revenue (Million) Forecast, by Application 2019 & 2032
                                                              64. Table 64: Nordics Insect Food Industry Revenue (Million) Forecast, by Application 2019 & 2032
                                                              65. Table 65: Rest of Europe Insect Food Industry Revenue (Million) Forecast, by Application 2019 & 2032
                                                              66. Table 66: Global Insect Food Industry Revenue Million Forecast, by Production Analysis 2019 & 2032
                                                              67. Table 67: Global Insect Food Industry Revenue Million Forecast, by Consumption Analysis 2019 & 2032
                                                              68. Table 68: Global Insect Food Industry Revenue Million Forecast, by Import Market Analysis (Value & Volume) 2019 & 2032
                                                              69. Table 69: Global Insect Food Industry Revenue Million Forecast, by Export Market Analysis (Value & Volume) 2019 & 2032
                                                              70. Table 70: Global Insect Food Industry Revenue Million Forecast, by Price Trend Analysis 2019 & 2032
                                                              71. Table 71: Global Insect Food Industry Revenue Million Forecast, by Country 2019 & 2032
                                                              72. Table 72: Turkey Insect Food Industry Revenue (Million) Forecast, by Application 2019 & 2032
                                                              73. Table 73: Israel Insect Food Industry Revenue (Million) Forecast, by Application 2019 & 2032
                                                              74. Table 74: GCC Insect Food Industry Revenue (Million) Forecast, by Application 2019 & 2032
                                                              75. Table 75: North Africa Insect Food Industry Revenue (Million) Forecast, by Application 2019 & 2032
                                                              76. Table 76: South Africa Insect Food Industry Revenue (Million) Forecast, by Application 2019 & 2032
                                                              77. Table 77: Rest of Middle East & Africa Insect Food Industry Revenue (Million) Forecast, by Application 2019 & 2032
                                                              78. Table 78: Global Insect Food Industry Revenue Million Forecast, by Production Analysis 2019 & 2032
                                                              79. Table 79: Global Insect Food Industry Revenue Million Forecast, by Consumption Analysis 2019 & 2032
                                                              80. Table 80: Global Insect Food Industry Revenue Million Forecast, by Import Market Analysis (Value & Volume) 2019 & 2032
                                                              81. Table 81: Global Insect Food Industry Revenue Million Forecast, by Export Market Analysis (Value & Volume) 2019 & 2032
                                                              82. Table 82: Global Insect Food Industry Revenue Million Forecast, by Price Trend Analysis 2019 & 2032
                                                              83. Table 83: Global Insect Food Industry Revenue Million Forecast, by Country 2019 & 2032
                                                              84. Table 84: China Insect Food Industry Revenue (Million) Forecast, by Application 2019 & 2032
                                                              85. Table 85: India Insect Food Industry Revenue (Million) Forecast, by Application 2019 & 2032
                                                              86. Table 86: Japan Insect Food Industry Revenue (Million) Forecast, by Application 2019 & 2032
                                                              87. Table 87: South Korea Insect Food Industry Revenue (Million) Forecast, by Application 2019 & 2032
                                                              88. Table 88: ASEAN Insect Food Industry Revenue (Million) Forecast, by Application 2019 & 2032
                                                              89. Table 89: Oceania Insect Food Industry Revenue (Million) Forecast, by Application 2019 & 2032
                                                              90. Table 90: Rest of Asia Pacific Insect Food Industry Revenue (Million) Forecast, by Application 2019 & 2032


                                                              Frequently Asked Questions

                                                              1. What is the projected Compound Annual Growth Rate (CAGR) of the Insect Food Industry?

                                                              The projected CAGR is approximately 18.89%.

                                                              2. Which companies are prominent players in the Insect Food Industry?

                                                              Key companies in the market include Bugsy Bros, Nordic Insect Economy Ltd, Enviro Flight LLC, Eat Grub Lt, Thailand Unique, Exo Inc, Proti - Farm, Entomo Farms Ltd, Deli Bugs Ltd, Kreca Ento - Feed BV.

                                                              3. What are the main segments of the Insect Food Industry?

                                                              The market segments include Production Analysis, Consumption Analysis, Import Market Analysis (Value & Volume), Export Market Analysis (Value & Volume), Price Trend Analysis.

                                                              4. Can you provide details about the market size?

                                                              The market size is estimated to be USD 3.80 Million as of 2022.

                                                              5. What are some drivers contributing to market growth?

                                                              Decreasing Per Capita Arable Land; Increased Demand for Food.

                                                              6. What are the notable trends driving market growth?

                                                              Easy Availability and High Protein Content in The Edible Insects.

                                                              7. Are there any restraints impacting market growth?

                                                              High Initial Investments; Requirement of Precision Agriculture.

                                                              8. Can you provide examples of recent developments in the market?

                                                              September 2022: Lotte Confectionery, a leading South Korean snack and ice cream maker, signed a memorandum of understanding (MOU) with Aspire Food Group, a Canadian firm renowned for its advanced insect agriculture and food technology, to cooperate in areas of protein alternatives and edible insects.

                                                              9. What pricing options are available for accessing the report?

                                                              Pricing options include single-user, multi-user, and enterprise licenses priced at USD 4750, USD 5250, and USD 8750 respectively.

                                                              10. Is the market size provided in terms of value or volume?

                                                              The market size is provided in terms of value, measured in Million.

                                                              11. Are there any specific market keywords associated with the report?

                                                              Yes, the market keyword associated with the report is "Insect Food Industry," which aids in identifying and referencing the specific market segment covered.

                                                              12. How do I determine which pricing option suits my needs best?

                                                              The pricing options vary based on user requirements and access needs. Individual users may opt for single-user licenses, while businesses requiring broader access may choose multi-user or enterprise licenses for cost-effective access to the report.

                                                              13. Are there any additional resources or data provided in the Insect Food Industry report?

                                                              While the report offers comprehensive insights, it's advisable to review the specific contents or supplementary materials provided to ascertain if additional resources or data are available.

                                                              14. How can I stay updated on further developments or reports in the Insect Food Industry?

                                                              To stay informed about further developments, trends, and reports in the Insect Food Industry, consider subscribing to industry newsletters, following relevant companies and organizations, or regularly checking reputable industry news sources and publications.


                                                              Methodology

                                                              Step 1 - Identification of Relevant Samples Size from Population Database

                                                              Step Chart
                                                              Bar Chart
                                                              Method Chart

                                                              Step 2 - Approaches for Defining Global Market Size (Value, Volume* & Price*)

                                                              Approach Chart
                                                              Top-down and bottom-up approaches are used to validate the global market size and estimate the market size for manufactures, regional segments, product, and application.

                                                              Note*: In applicable scenarios

                                                              Step 3 - Data Sources

                                                              Primary Research

                                                              • Web Analytics
                                                              • Survey Reports
                                                              • Research Institute
                                                              • Latest Research Reports
                                                              • Opinion Leaders

                                                              Secondary Research

                                                              • Annual Reports
                                                              • White Paper
                                                              • Latest Press Release
                                                              • Industry Association
                                                              • Paid Database
                                                              • Investor Presentations
                                                              Analyst Chart

                                                              Step 4 - Data Triangulation

                                                              Involves using different sources of information in order to increase the validity of a study

                                                              These sources are likely to be stakeholders in a program - participants, other researchers, program staff, other community members, and so on.

                                                              Then we put all data in single framework & apply various statistical tools to find out the dynamic on the market.

                                                              During the analysis stage, feedback from the stakeholder groups would be compared to determine areas of agreement as well as areas of divergence

                                                              Additionally, after gathering mixed and scattered data from a wide range of sources, data is triangulated and correlated to come up with estimated figures which are further validated through primary mediums or industry experts, opinion leaders.

                                                              About Precision Market View

                                                              Precision Market View offers precise market research, industry intelligence, and data analysis for healthcare, manufacturing, technology, and energy. Our reports provide the clarity you need to make informed decisions and drive growth.

                                                              Our team combines primary research, advanced analytics, and industry expertise to deliver actionable intelligence. We offer syndicated reports, custom research, and consulting services tailored to your business needs.

                                                              At Precision Market View, we are committed to quality, transparency, and client satisfaction. Every report is rigorously validated to ensure accuracy and relevance. Our global perspective and local expertise help you understand both the big picture and the finer details of your market.

                                                              Stay informed with Precision Market View. Subscribe to our newsletter for the latest updates and research highlights, and follow us on social media for real-time insights.

                                                              Precision Market View – Clarity for Your Strategic Decisions.

                                                              artwork spiralartwork spiralRelated Reports
                                                              artwork underline

                                                              India Maize Seed Market Market Strategies for the Next Decade: 2025-2033

                                                              Discover the booming Indian maize seed market! This comprehensive analysis reveals a CAGR of 10.20% (2025-2033), driven by hybrid seed adoption and rising demand. Explore key players, regional trends, and growth projections for this lucrative sector.

                                                              July 2025
                                                              Base Year: 2024
                                                              No Of Pages: 197
                                                              Price: $3800

                                                              Future Forecasts for India Combine Harvester Market Industry Growth

                                                              The India Combine Harvester Market is booming, projected to reach ₹[estimated 2033 value] million by 2033 with a 5.70% CAGR. Discover key trends, drivers, and restraints shaping this dynamic sector, including leading players like Kubota and Mahindra. Explore regional market analysis and growth forecasts for self-propelled, track, and tractor-powered harvesters.

                                                              July 2025
                                                              Base Year: 2024
                                                              No Of Pages: 197
                                                              Price: $3800

                                                              Canada Crop Protection Chemicals Industry Unlocking Growth Potential: 2025-2033 Analysis and Forecasts

                                                              Discover the growth trajectory of Canada's crop protection chemicals market (2025-2033). This in-depth analysis reveals market size, CAGR, key segments (insecticides, fungicides, herbicides), leading companies, and regional trends. Learn about market drivers, restraints, and future opportunities in the Canadian agricultural sector.

                                                              July 2025
                                                              Base Year: 2024
                                                              No Of Pages: 150
                                                              Price: $3800

                                                              Turf & Ornamental Chemical Input Industry Market Report: Trends and Growth

                                                              The Turf & Ornamental Chemical Input market is booming, projected to reach $9.875 billion by 2033 with a 4.34% CAGR. Discover key trends, leading companies (FMC, Bayer, Syngenta), and regional insights in this comprehensive market analysis. Explore the impact of pesticides, fertilizers, and growth regulators on landscaping and gardening.

                                                              July 2025
                                                              Base Year: 2024
                                                              No Of Pages: 234
                                                              Price: $4750

                                                              Brazil Maize Market: Growth Opportunities and Competitive Landscape Overview 2025-2033

                                                              Discover the booming Brazil maize market forecast (2025-2033)! This in-depth analysis reveals key trends, drivers, and challenges impacting hybrid maize, conventional maize, and applications across animal feed, human consumption, and biofuels. Learn about major players like Syngenta and Corteva and the projected market size and CAGR.

                                                              July 2025
                                                              Base Year: 2024
                                                              No Of Pages: 180
                                                              Price: $3800

                                                              Opportunities in North America Crop Protection Chemicals Industry Market 2025-2033

                                                              The North American crop protection chemicals market is booming, projected to reach [estimated 2033 market size in millions] by 2033 with a 4.34% CAGR. Discover key trends, driving forces, and major players shaping this dynamic industry, including insecticides, herbicides, fungicides, and more. Learn about regional variations and market segmentation across various crop types and application methods.

                                                              July 2025
                                                              Base Year: 2024
                                                              No Of Pages: 180
                                                              Price: $3800

                                                              Apple Industry to Grow at XX CAGR: Market Size Analysis and Forecasts 2025-2033

                                                              Discover the latest trends in the global apple industry. This in-depth market analysis reveals a steady growth trajectory, driven by consumer demand, diverse product applications, and expanding online retail. Learn about key players, regional insights, and future projections for the apple market from 2025-2033.

                                                              July 2025
                                                              Base Year: 2024
                                                              No Of Pages: 234
                                                              Price: $4750

                                                              Digital Agriculture Market 2025-2033: Preparing for Growth and Change

                                                              The booming digital agriculture market is projected to reach \$44.14 billion by 2033, fueled by precision farming, AI, and drone technology. Explore market trends, key players (AGCO, Microsoft, Deere), and regional growth in this comprehensive analysis.

                                                              July 2025
                                                              Base Year: 2024
                                                              No Of Pages: 150
                                                              Price: $4750

                                                              North America Maize Industry Charting Growth Trajectories 2025-2033: Strategic Insights and Forecasts

                                                              Discover the booming North American maize market! This comprehensive analysis reveals key trends, drivers, and restraints, including insights into hybrid seeds, field corn, sweet corn, popcorn, and major players like Bayer & Syngenta. Project your business strategy with our forecast to 2033.

                                                              July 2025
                                                              Base Year: 2024
                                                              No Of Pages: 180
                                                              Price: $3800

                                                              North America Agricultural Tractors Machinery Market 2025-2033 Overview: Trends, Competitor Dynamics, and Opportunities

                                                              Discover the booming North American agricultural tractors market! This comprehensive analysis reveals key trends, drivers, and restraints impacting the $16.39 billion industry through 2033, focusing on key players like Deere & Company and Mahindra & Mahindra. Explore market segmentation by HP and drive type, plus regional breakdowns.

                                                              July 2025
                                                              Base Year: 2024
                                                              No Of Pages: 234
                                                              Price: $4750

                                                              APAC Biofertilizers Market Growth Opportunities: Market Size Forecast to 2033

                                                              Discover the booming APAC biofertilizers market! This comprehensive analysis reveals a CAGR of 10.80%, driven by sustainable agriculture and growing demand for organic food. Explore market size projections, key segments (Rhizobium, Azospirillum, etc.), and leading companies shaping this dynamic industry.

                                                              July 2025
                                                              Base Year: 2024
                                                              No Of Pages: 180
                                                              Price: $4750

                                                              Turkey Agricultural Tractor Market Dynamics and Forecasts: 2025-2033 Strategic Insights

                                                              Discover the booming Turkish agricultural tractor market! This comprehensive analysis reveals a 6.10% CAGR, driven by government support and technological advancements. Explore market trends, segmentation by horsepower (50HP, 75HP, 100HP, 200HP+), key players, and growth projections to 2033. Invest wisely in this expanding sector!

                                                              July 2025
                                                              Base Year: 2024
                                                              No Of Pages: 197
                                                              Price: $3800

                                                              North America Herbicide Market Insightful Analysis: Trends, Competitor Dynamics, and Opportunities 2025-2033

                                                              Discover the surging North American herbicide market, projected to reach $XX million by 2033 with a 4.34% CAGR. This in-depth analysis explores key drivers, trends, restraints, and competitive landscapes, covering chemigation, foliar application, crop types, and leading companies like FMC and Bayer. Gain insights into regional market shares and future growth projections.

                                                              July 2025
                                                              Base Year: 2024
                                                              No Of Pages: 180
                                                              Price: $3800

                                                              Vietnam Agro Machinery Market Insights: Growth at XX CAGR Through 2033

                                                              Discover the booming Vietnam agro-machinery market, projected to reach [estimated value] by 2033 with a CAGR of 11.50%. This in-depth analysis explores market drivers, trends, restraints, key players (Yanmar, Kubota, VEAM), and segment insights (tractors, rice transplanters, harvesting machinery). Learn about investment opportunities and future growth potential.

                                                              July 2025
                                                              Base Year: 2024
                                                              No Of Pages: 150
                                                              Price: $3800

                                                              Exploring Key Dynamics of Honey Industry Industry

                                                              Discover the booming honey market! This comprehensive analysis reveals a $11.08B industry with a 5.20% CAGR, exploring key drivers, trends, regional insights (North America, Europe, Asia-Pacific), and leading brands like Dabur Honey and Patanjali Ayurved. Learn about raw honey, organic honey, Manuka honey, and more. Get your free market research now!

                                                              July 2025
                                                              Base Year: 2024
                                                              No Of Pages: 234
                                                              Price: $4750

                                                              Emerging Market Insights in Cotton Trade Analysis Market: 2025-2033 Overview

                                                              Discover the latest insights into the booming global cotton trade market. This comprehensive analysis reveals a $60B market (2025) projected to grow at a 4.5% CAGR through 2033, driven by textile industry growth and sustainable cotton demand. Explore key trends, restraints, and regional market shares.

                                                              July 2025
                                                              Base Year: 2024
                                                              No Of Pages: 150
                                                              Price: $4750

                                                              Asia-pacific Tomato Seed Market Projected to Grow at XX CAGR: Insights and Forecasts 2025-2033

                                                              The Asia-Pacific tomato seed market is booming, driven by rising demand and advancements in breeding technology. Discover key market trends, growth projections (2025-2033), major players, and regional insights in this comprehensive market analysis.

                                                              July 2025
                                                              Base Year: 2024
                                                              No Of Pages: 180
                                                              Price: $3800

                                                              Uganda Agriculture Industry Market Strategies for the Next Decade: 2025-2033

                                                              Discover the booming Ugandan agriculture industry! Explore market size ($4.07B in 2025), 4.20% CAGR growth projections to 2033, key players, and regional trends in cereals, oilseeds, fruits, and vegetables. Invest in Uganda's agricultural future.

                                                              July 2025
                                                              Base Year: 2024
                                                              No Of Pages: 150
                                                              Price: $3800

                                                              Artichokes Industry: Harnessing Emerging Innovations for Growth 2025-2033

                                                              Discover the booming artichoke market! Explore key trends, regional analysis, and leading companies driving growth in this $XX million industry projected to reach [estimated 2033 value] by 2033. Learn about the rising demand for fresh, canned, frozen, and marinated artichokes in the food service, household, and industrial sectors.

                                                              July 2025
                                                              Base Year: 2024
                                                              No Of Pages: 197
                                                              Price: $3800

                                                              Agricultural Inoculants Market Growth Opportunities and Market Forecast 2025-2033: A Strategic Analysis

                                                              Discover the booming agricultural inoculants market! Our comprehensive analysis reveals a CAGR of 10.50%, driven by sustainable farming trends and rising food demands. Explore market size, segmentation, key players (Bioceres, Novozymes, BASF), and regional insights for 2025-2033. Learn how bio-based solutions are revolutionizing agriculture.

                                                              July 2025
                                                              Base Year: 2024
                                                              No Of Pages: 150
                                                              Price: $4750

                                                              Business Address

                                                              Head Office

                                                              Office no. A 5010, fifth floor, Solitaire Business Hub, Near Phoenix mall, Pune, Maharashtra 411014

                                                              Contact Information

                                                              Craig Francis

                                                              Business Development Head

                                                              +17162654855

                                                              [email protected]

                                                              Connect With Us

                                                              Secure Payment Partners

                                                              payment image
                                                              RetailLogisticsPackagingAutomotiveHealthcareAgricultureEnergy & PowerFood & BeverageAerospace & DefenseChemicals & MaterialsHospitality and TourismAnimal Nutrition & WellnessConsumer Goods and ServicesReal Estate and ConstructionHome and Property ImprovementTechnology, Media and TelecomManufacturing Products and ServicesFinancial Services and Investment Intelligence

                                                              © 2025 All rights reserved


                                                              Privacy Policy
                                                              Terms and Conditions
                                                              FAQ
                                                              • Home
                                                              • About Us
                                                              • Industries
                                                                • Aerospace & Defense
                                                                • Agriculture
                                                                • Animal Nutrition & Wellness
                                                                • Automotive
                                                                • Chemicals & Materials
                                                                • Consumer Goods and Services
                                                                • Energy & Power
                                                                • Financial Services and Investment Intelligence
                                                                • Food & Beverage
                                                                • Home and Property Improvement
                                                                • Hospitality and Tourism
                                                                • Logistics
                                                                • Manufacturing Products and Services
                                                                • Packaging
                                                                • Professional and Commercial Services
                                                                • Real Estate and Construction
                                                                • Retail
                                                                • Technology, Media and Telecom
                                                                • Healthcare
                                                              • Services
                                                              • Contact
                                                              Main Logo
                                                              • Home
                                                              • About Us
                                                              • Industries
                                                                • Aerospace & Defense
                                                                • Agriculture
                                                                • Animal Nutrition & Wellness
                                                                • Automotive
                                                                • Chemicals & Materials
                                                                • Consumer Goods and Services
                                                                • Energy & Power
                                                                • Financial Services and Investment Intelligence
                                                                • Food & Beverage
                                                                • Home and Property Improvement
                                                                • Hospitality and Tourism
                                                                • Logistics
                                                                • Manufacturing Products and Services
                                                                • Packaging
                                                                • Professional and Commercial Services
                                                                • Real Estate and Construction
                                                                • Retail
                                                                • Technology, Media and Telecom
                                                                • Healthcare
                                                              • Services
                                                              • Contact
                                                              +17162654855
                                                              [email protected]

                                                              +17162654855

                                                              [email protected]