

Key Insights
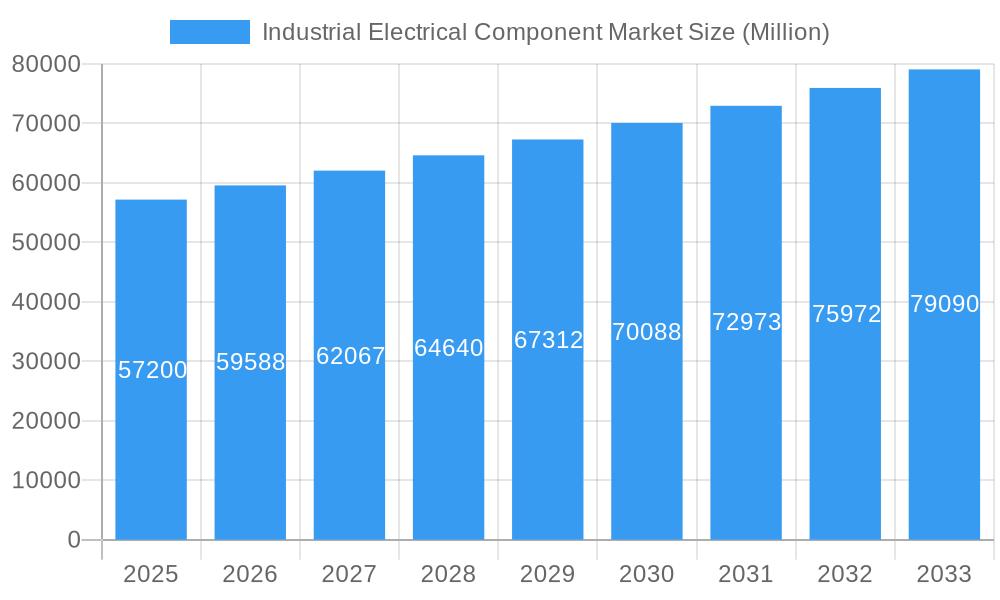
The Industrial Electrical Component market, valued at $57.20 billion in 2025, is poised for robust growth, exhibiting a Compound Annual Growth Rate (CAGR) exceeding 4.00% from 2025 to 2033. This expansion is driven by several key factors. The increasing automation across manufacturing, the burgeoning renewable energy sector demanding sophisticated power distribution and control systems, and the global push for smart infrastructure projects are all significant contributors. Furthermore, the growing adoption of Industry 4.0 principles, emphasizing data-driven decision-making and connected devices, fuels demand for advanced components like sensors, actuators, and smart controllers. Technological advancements leading to more efficient, reliable, and compact components further enhance market appeal. While challenges such as supply chain disruptions and material price fluctuations exist, the long-term outlook remains positive, fueled by consistent investments in infrastructure development and industrial modernization across major economies. Regional variations will likely occur, with North America and Asia Pacific leading the growth trajectory due to substantial investments in industrial upgrades and renewable energy projects.
Industrial Electrical Component Market Market Size (In Billion)
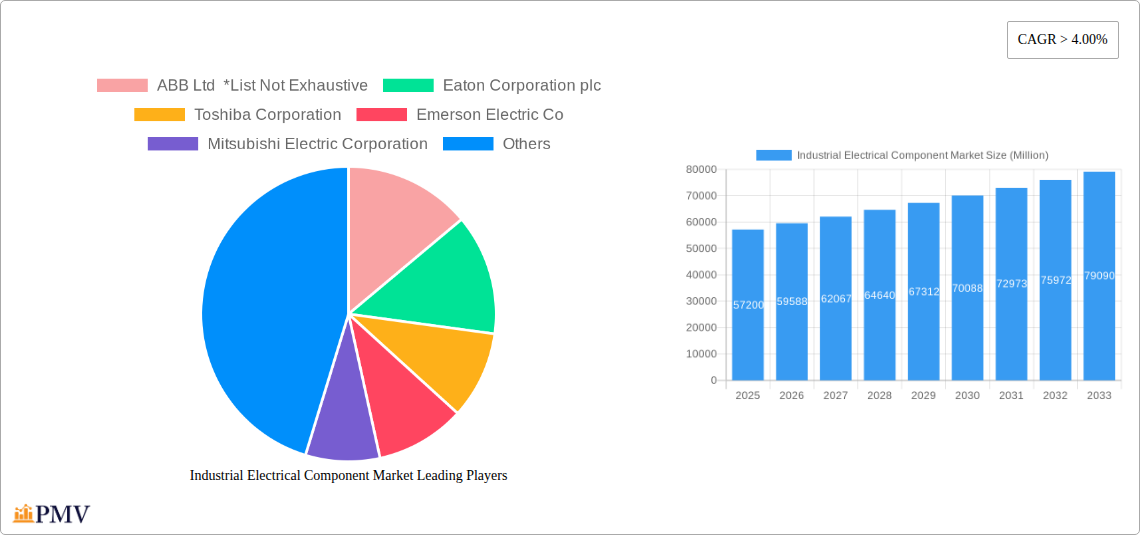
The market segmentation reveals a diverse landscape. Cables and wires constitute a significant portion, followed by power distribution units, transformers, and switchgears. Sales primarily occur through Original Equipment Manufacturers (OEMs) and the aftermarket channel. Key players like ABB Ltd., Eaton Corporation plc, Toshiba Corporation, Emerson Electric Co, Mitsubishi Electric Corporation, Siemens AG, Schneider Electric SE, OMRON Automotive Electronics Co Ltd, and General Electric Company are driving innovation and competition. The competitive landscape is dynamic, characterized by strategic alliances, mergers, and acquisitions, and ongoing efforts to develop sustainable and energy-efficient components to meet the evolving demands of industries worldwide. Future market growth will depend on continued technological innovation, the successful integration of smart technologies, and the pace of global industrial expansion.
Industrial Electrical Component Market Company Market Share
This in-depth report provides a comprehensive analysis of the Industrial Electrical Component Market, offering valuable insights for businesses, investors, and industry professionals. The study period spans from 2019 to 2033, with 2025 as the base and estimated year, and a forecast period from 2025 to 2033. The historical period covered is 2019-2024. This report unveils market dynamics, competitive landscapes, and future growth opportunities within this crucial sector. Expect detailed segmentation analysis, focusing on key types (Cables, Wires, Power Distribution Units, Transformers, Switchgears) and sales channels (OEM, Aftermarket), complemented by regional breakdowns and profiles of leading players.
Industrial Electrical Component Market Structure & Competitive Dynamics
The Industrial Electrical Component Market exhibits a moderately concentrated structure, with several multinational corporations holding significant market share. ABB Ltd, Eaton Corporation plc, Toshiba Corporation, Emerson Electric Co, Mitsubishi Electric Corporation, Siemens AG, Schneider Electric SE, OMRON Automotive Electronics Co Ltd, and General Electric Company are among the key players, collectively controlling an estimated xx% of the market in 2025. Innovation ecosystems are vibrant, driven by ongoing R&D investments in advanced materials, energy efficiency technologies, and smart grid solutions. Stringent regulatory frameworks governing safety, performance, and environmental impact shape product development and market access. The presence of substitutes, such as alternative energy sources and transmission technologies, presents competitive pressure, necessitating continuous product innovation. End-user trends, particularly the increasing adoption of automation and digitalization in industries, are pivotal drivers. M&A activities have been moderate in recent years, with deal values averaging approximately xx Million USD annually (2019-2024). Notable acquisitions have focused on expanding geographic reach, bolstering technological capabilities, and securing access to specialized components.
Industrial Electrical Component Market Industry Trends & Insights
The Industrial Electrical Component Market is projected to experience robust growth, with a Compound Annual Growth Rate (CAGR) of xx% during the forecast period (2025-2033). This growth is fueled by several factors, including the expanding industrial sector globally, rising investments in infrastructure development across various regions, and increasing demand for efficient and reliable power solutions. Technological disruptions, such as the advent of smart grids and the integration of renewable energy sources, are reshaping market dynamics. Consumer preferences are shifting towards sustainable and energy-efficient components, pushing manufacturers to adopt eco-friendly materials and designs. Competitive dynamics are intense, with companies focusing on product innovation, cost optimization, and strategic partnerships to maintain their market position. Market penetration of advanced components, such as smart sensors and intelligent protection devices, is gradually increasing, reaching an estimated xx% in 2025.
Dominant Markets & Segments in Industrial Electrical Component Market
The Asia-Pacific region currently dominates the Industrial Electrical Component Market, driven by rapid industrialization, robust economic growth, and substantial investments in infrastructure projects. Within this region, China and India are key contributors.
- Key Drivers in Asia-Pacific:
- Favorable government policies supporting industrial development.
- Expanding manufacturing base and increasing energy demand.
- Rising investments in renewable energy infrastructure.
The Transformers segment holds a significant market share, driven by the increasing need for power transmission and distribution in industrial settings, data centers, and renewable energy projects. The OEM sales channel accounts for a larger portion of the market compared to the aftermarket, reflecting the high demand for new equipment in newly constructed industrial facilities.
- Dominant Segment Analysis: The Transformers segment's dominance is attributed to the increasing capacity of power plants and the expanding electrical grid. The OEM channel's prominence stems from robust industrial construction activity globally.
Industrial Electrical Component Market Product Innovations
Recent product innovations have focused on improving energy efficiency, enhancing safety features, and integrating smart technologies. Miniaturization of components, improved thermal management solutions, and the development of advanced monitoring systems are notable trends. These innovations aim to improve the reliability, performance, and lifespan of industrial electrical components, ultimately providing a competitive advantage in the market. The increasing demand for sustainable and energy-efficient products is driving innovation in eco-friendly materials and manufacturing processes.
Report Segmentation & Scope
This report segments the Industrial Electrical Component Market by Type: Cables, Wires, Power Distribution Units, Transformers, and Switchgears. Each segment is analyzed based on its market size, growth rate, and competitive landscape. The market is further segmented by Sales Channel: OEM and Aftermarket, providing insights into the distribution channels and customer segments. Growth projections for each segment are provided, considering factors like technological advancements, regulatory changes, and end-user demand. Competitive dynamics within each segment are assessed, highlighting market share, competitive strategies, and potential disruptions.
Key Drivers of Industrial Electrical Component Market Growth
The growth of the Industrial Electrical Component Market is driven by several factors. Technological advancements, such as the development of smart grid technologies and automation in industries, are increasing demand for sophisticated and advanced components. Economic growth in emerging economies, particularly in Asia and Africa, is fueling the expansion of industrial sectors and driving infrastructure development, which necessitates substantial investments in electrical components. Favorable government regulations and policies promoting industrial development, energy efficiency, and renewable energy adoption are creating opportunities for market growth. For example, the significant investments in renewable energy projects worldwide are directly contributing to the high demand for transformers and other power transmission components.
Challenges in the Industrial Electrical Component Market Sector
The Industrial Electrical Component Market faces several challenges. Stringent regulatory compliance requirements, particularly regarding safety and environmental standards, can increase production costs and complexity. Supply chain disruptions, including material shortages and geopolitical instability, pose risks to production and timely delivery. Intense competition from established and emerging players necessitates continuous product innovation and cost optimization to maintain market share. These factors can collectively impact overall profitability and growth prospects.
Leading Players in the Industrial Electrical Component Market Market
- ABB Ltd
- Eaton Corporation plc
- Toshiba Corporation
- Emerson Electric Co
- Mitsubishi Electric Corporation
- Siemens AG
- Schneider Electric SE
- OMRON Automotive Electronics Co Ltd
- General Electric Company
Key Developments in Industrial Electrical Component Market Sector
- 2023: Foxconn Technology Co. Ltd signed an agreement with the Indian government to establish a USD 500 Million semiconductor fabrication unit in Hyderabad. This development is expected to significantly boost the local production of industrial electrical components.
- 2022: ABB India announced the expansion and upgrade of its small power manufacturing unit in Bengaluru, India, to meet the rising demand for low-voltage power equipment.
- 2022: Hitachi Energy invested USD 37 Million to expand its transformer manufacturing unit in Virginia, aiming to cater to increasing transformer demand from various sectors.
Strategic Industrial Electrical Component Market Outlook
The Industrial Electrical Component Market presents significant growth potential in the coming years. Continued investment in infrastructure development, rising adoption of automation and smart technologies in industrial processes, and the global push for renewable energy will create substantial demand. Strategic opportunities lie in developing innovative, energy-efficient, and sustainable components, focusing on niche applications and expanding into emerging markets. Companies that prioritize technological innovation, strategic partnerships, and efficient supply chain management are poised to capitalize on the expanding market opportunities.
Industrial Electrical Component Market Segmentation
-
1. Type
- 1.1. Cables
- 1.2. Wires
- 1.3. Power Distribution units
- 1.4. Transformers
- 1.5. Switchgears
-
2. Sales Channels
- 2.1. OEM
- 2.2. Aftermarket
Industrial Electrical Component Market Segmentation By Geography
-
1. North America
- 1.1. United States
- 1.2. Canada
- 1.3. Rest of North America
-
2. Europe
- 2.1. Germany
- 2.2. United Kingdom
- 2.3. France
- 2.4. Russia
- 2.5. Spain
- 2.6. Rest of Europe
-
3. Asia Pacific
- 3.1. India
- 3.2. China
- 3.3. Japan
- 3.4. Rest of Asia Pacific
-
4. South America
- 4.1. Brazil
- 4.2. Argentina
- 4.3. Rest of South America
- 5. Middle East
-
6. United Arab Emirates
- 6.1. Saudi Arabia
- 6.2. South Africa
- 6.3. Rest of Middle East
Industrial Electrical Component Market Regional Market Share
Geographic Coverage of Industrial Electrical Component Market
Industrial Electrical Component Market REPORT HIGHLIGHTS
| Aspects | Details |
|---|---|
| Study Period | 2020-2034 |
| Base Year | 2025 |
| Estimated Year | 2026 |
| Forecast Period | 2026-2034 |
| Historical Period | 2020-2025 |
| Growth Rate | CAGR of > 4.00% from 2020-2034 |
| Segmentation |
|
Table of Contents
- 1. Introduction
- 1.1. Research Scope
- 1.2. Market Segmentation
- 1.3. Research Objective
- 1.4. Definitions and Assumptions
- 2. Executive Summary
- 2.1. Market Snapshot
- 3. Market Dynamics
- 3.1. Market Drivers
- 3.2. Market Restrains
- 3.3. Market Trends
- 3.4. Market Opportunities
- 4. Market Factor Analysis
- 4.1. Porters Five Forces
- 4.1.1. Bargaining Power of Suppliers
- 4.1.2. Bargaining Power of Buyers
- 4.1.3. Threat of New Entrants
- 4.1.4. Threat of Substitutes
- 4.1.5. Competitive Rivalry
- 4.2. PESTEL analysis
- 4.3. BCG Analysis
- 4.3.1. Stars (High Growth, High Market Share)
- 4.3.2. Cash Cows (Low Growth, High Market Share)
- 4.3.3. Question Mark (High Growth, Low Market Share)
- 4.3.4. Dogs (Low Growth, Low Market Share)
- 4.4. Ansoff Matrix Analysis
- 4.5. Supply Chain Analysis
- 4.6. Regulatory Landscape
- 4.7. Current Market Potential and Opportunity Assessment (TAM–SAM–SOM Framework)
- 4.8. PMV Analyst Note
- 4.1. Porters Five Forces
- 5. Market Analysis, Insights and Forecast 2021-2033
- 5.1. Market Analysis, Insights and Forecast - by Type
- 5.1.1. Cables
- 5.1.2. Wires
- 5.1.3. Power Distribution units
- 5.1.4. Transformers
- 5.1.5. Switchgears
- 5.2. Market Analysis, Insights and Forecast - by Sales Channels
- 5.2.1. OEM
- 5.2.2. Aftermarket
- 5.3. Market Analysis, Insights and Forecast - by Region
- 5.3.1. North America
- 5.3.2. Europe
- 5.3.3. Asia Pacific
- 5.3.4. South America
- 5.3.5. Middle East
- 5.3.6. United Arab Emirates
- 5.1. Market Analysis, Insights and Forecast - by Type
- 6. Global Industrial Electrical Component Market Analysis, Insights and Forecast, 2021-2033
- 6.1. Market Analysis, Insights and Forecast - by Type
- 6.1.1. Cables
- 6.1.2. Wires
- 6.1.3. Power Distribution units
- 6.1.4. Transformers
- 6.1.5. Switchgears
- 6.2. Market Analysis, Insights and Forecast - by Sales Channels
- 6.2.1. OEM
- 6.2.2. Aftermarket
- 6.1. Market Analysis, Insights and Forecast - by Type
- 7. North America Industrial Electrical Component Market Analysis, Insights and Forecast, 2020-2032
- 7.1. Market Analysis, Insights and Forecast - by Type
- 7.1.1. Cables
- 7.1.2. Wires
- 7.1.3. Power Distribution units
- 7.1.4. Transformers
- 7.1.5. Switchgears
- 7.2. Market Analysis, Insights and Forecast - by Sales Channels
- 7.2.1. OEM
- 7.2.2. Aftermarket
- 7.1. Market Analysis, Insights and Forecast - by Type
- 8. Europe Industrial Electrical Component Market Analysis, Insights and Forecast, 2020-2032
- 8.1. Market Analysis, Insights and Forecast - by Type
- 8.1.1. Cables
- 8.1.2. Wires
- 8.1.3. Power Distribution units
- 8.1.4. Transformers
- 8.1.5. Switchgears
- 8.2. Market Analysis, Insights and Forecast - by Sales Channels
- 8.2.1. OEM
- 8.2.2. Aftermarket
- 8.1. Market Analysis, Insights and Forecast - by Type
- 9. Asia Pacific Industrial Electrical Component Market Analysis, Insights and Forecast, 2020-2032
- 9.1. Market Analysis, Insights and Forecast - by Type
- 9.1.1. Cables
- 9.1.2. Wires
- 9.1.3. Power Distribution units
- 9.1.4. Transformers
- 9.1.5. Switchgears
- 9.2. Market Analysis, Insights and Forecast - by Sales Channels
- 9.2.1. OEM
- 9.2.2. Aftermarket
- 9.1. Market Analysis, Insights and Forecast - by Type
- 10. South America Industrial Electrical Component Market Analysis, Insights and Forecast, 2020-2032
- 10.1. Market Analysis, Insights and Forecast - by Type
- 10.1.1. Cables
- 10.1.2. Wires
- 10.1.3. Power Distribution units
- 10.1.4. Transformers
- 10.1.5. Switchgears
- 10.2. Market Analysis, Insights and Forecast - by Sales Channels
- 10.2.1. OEM
- 10.2.2. Aftermarket
- 10.1. Market Analysis, Insights and Forecast - by Type
- 11. Middle East Industrial Electrical Component Market Analysis, Insights and Forecast, 2020-2032
- 11.1. Market Analysis, Insights and Forecast - by Type
- 11.1.1. Cables
- 11.1.2. Wires
- 11.1.3. Power Distribution units
- 11.1.4. Transformers
- 11.1.5. Switchgears
- 11.2. Market Analysis, Insights and Forecast - by Sales Channels
- 11.2.1. OEM
- 11.2.2. Aftermarket
- 11.1. Market Analysis, Insights and Forecast - by Type
- 12. United Arab Emirates Industrial Electrical Component Market Analysis, Insights and Forecast, 2020-2032
- 12.1. Market Analysis, Insights and Forecast - by Type
- 12.1.1. Cables
- 12.1.2. Wires
- 12.1.3. Power Distribution units
- 12.1.4. Transformers
- 12.1.5. Switchgears
- 12.2. Market Analysis, Insights and Forecast - by Sales Channels
- 12.2.1. OEM
- 12.2.2. Aftermarket
- 12.1. Market Analysis, Insights and Forecast - by Type
- 13. Competitive Analysis
- 13.1. Company Profiles
- 13.1.1 ABB Ltd *List Not Exhaustive
- 13.1.1.1. Company Overview
- 13.1.1.2. Products
- 13.1.1.3. Company Financials
- 13.1.1.4. SWOT Analysis
- 13.1.2 Eaton Corporation plc
- 13.1.2.1. Company Overview
- 13.1.2.2. Products
- 13.1.2.3. Company Financials
- 13.1.2.4. SWOT Analysis
- 13.1.3 Toshiba Corporation
- 13.1.3.1. Company Overview
- 13.1.3.2. Products
- 13.1.3.3. Company Financials
- 13.1.3.4. SWOT Analysis
- 13.1.4 Emerson Electric Co
- 13.1.4.1. Company Overview
- 13.1.4.2. Products
- 13.1.4.3. Company Financials
- 13.1.4.4. SWOT Analysis
- 13.1.5 Mitsubishi Electric Corporation
- 13.1.5.1. Company Overview
- 13.1.5.2. Products
- 13.1.5.3. Company Financials
- 13.1.5.4. SWOT Analysis
- 13.1.6 Siemens AG
- 13.1.6.1. Company Overview
- 13.1.6.2. Products
- 13.1.6.3. Company Financials
- 13.1.6.4. SWOT Analysis
- 13.1.7 Schneider Electric SE
- 13.1.7.1. Company Overview
- 13.1.7.2. Products
- 13.1.7.3. Company Financials
- 13.1.7.4. SWOT Analysis
- 13.1.8 OMRON Automotive Electronics Co Ltd
- 13.1.8.1. Company Overview
- 13.1.8.2. Products
- 13.1.8.3. Company Financials
- 13.1.8.4. SWOT Analysis
- 13.1.9 General Electric Company
- 13.1.9.1. Company Overview
- 13.1.9.2. Products
- 13.1.9.3. Company Financials
- 13.1.9.4. SWOT Analysis
- 13.1.1 ABB Ltd *List Not Exhaustive
- 13.2. Market Entropy
- 13.2.1 Company's Key Areas Served
- 13.2.2 Recent Developments
- 13.3. Company Market Share Analysis 2025
- 13.3.1 Top 5 Companies Market Share Analysis
- 13.3.2 Top 3 Companies Market Share Analysis
- 13.4. List of Potential Customers
- 14. Research Methodology
List of Figures
- Figure 1: Global Industrial Electrical Component Market Revenue Breakdown (Million, %) by Region 2025 & 2033
- Figure 2: Global Industrial Electrical Component Market Volume Breakdown (K Units, %) by Region 2025 & 2033
- Figure 3: North America Industrial Electrical Component Market Revenue (Million), by Type 2025 & 2033
- Figure 4: North America Industrial Electrical Component Market Volume (K Units), by Type 2025 & 2033
- Figure 5: North America Industrial Electrical Component Market Revenue Share (%), by Type 2025 & 2033
- Figure 6: North America Industrial Electrical Component Market Volume Share (%), by Type 2025 & 2033
- Figure 7: North America Industrial Electrical Component Market Revenue (Million), by Sales Channels 2025 & 2033
- Figure 8: North America Industrial Electrical Component Market Volume (K Units), by Sales Channels 2025 & 2033
- Figure 9: North America Industrial Electrical Component Market Revenue Share (%), by Sales Channels 2025 & 2033
- Figure 10: North America Industrial Electrical Component Market Volume Share (%), by Sales Channels 2025 & 2033
- Figure 11: North America Industrial Electrical Component Market Revenue (Million), by Country 2025 & 2033
- Figure 12: North America Industrial Electrical Component Market Volume (K Units), by Country 2025 & 2033
- Figure 13: North America Industrial Electrical Component Market Revenue Share (%), by Country 2025 & 2033
- Figure 14: North America Industrial Electrical Component Market Volume Share (%), by Country 2025 & 2033
- Figure 15: Europe Industrial Electrical Component Market Revenue (Million), by Type 2025 & 2033
- Figure 16: Europe Industrial Electrical Component Market Volume (K Units), by Type 2025 & 2033
- Figure 17: Europe Industrial Electrical Component Market Revenue Share (%), by Type 2025 & 2033
- Figure 18: Europe Industrial Electrical Component Market Volume Share (%), by Type 2025 & 2033
- Figure 19: Europe Industrial Electrical Component Market Revenue (Million), by Sales Channels 2025 & 2033
- Figure 20: Europe Industrial Electrical Component Market Volume (K Units), by Sales Channels 2025 & 2033
- Figure 21: Europe Industrial Electrical Component Market Revenue Share (%), by Sales Channels 2025 & 2033
- Figure 22: Europe Industrial Electrical Component Market Volume Share (%), by Sales Channels 2025 & 2033
- Figure 23: Europe Industrial Electrical Component Market Revenue (Million), by Country 2025 & 2033
- Figure 24: Europe Industrial Electrical Component Market Volume (K Units), by Country 2025 & 2033
- Figure 25: Europe Industrial Electrical Component Market Revenue Share (%), by Country 2025 & 2033
- Figure 26: Europe Industrial Electrical Component Market Volume Share (%), by Country 2025 & 2033
- Figure 27: Asia Pacific Industrial Electrical Component Market Revenue (Million), by Type 2025 & 2033
- Figure 28: Asia Pacific Industrial Electrical Component Market Volume (K Units), by Type 2025 & 2033
- Figure 29: Asia Pacific Industrial Electrical Component Market Revenue Share (%), by Type 2025 & 2033
- Figure 30: Asia Pacific Industrial Electrical Component Market Volume Share (%), by Type 2025 & 2033
- Figure 31: Asia Pacific Industrial Electrical Component Market Revenue (Million), by Sales Channels 2025 & 2033
- Figure 32: Asia Pacific Industrial Electrical Component Market Volume (K Units), by Sales Channels 2025 & 2033
- Figure 33: Asia Pacific Industrial Electrical Component Market Revenue Share (%), by Sales Channels 2025 & 2033
- Figure 34: Asia Pacific Industrial Electrical Component Market Volume Share (%), by Sales Channels 2025 & 2033
- Figure 35: Asia Pacific Industrial Electrical Component Market Revenue (Million), by Country 2025 & 2033
- Figure 36: Asia Pacific Industrial Electrical Component Market Volume (K Units), by Country 2025 & 2033
- Figure 37: Asia Pacific Industrial Electrical Component Market Revenue Share (%), by Country 2025 & 2033
- Figure 38: Asia Pacific Industrial Electrical Component Market Volume Share (%), by Country 2025 & 2033
- Figure 39: South America Industrial Electrical Component Market Revenue (Million), by Type 2025 & 2033
- Figure 40: South America Industrial Electrical Component Market Volume (K Units), by Type 2025 & 2033
- Figure 41: South America Industrial Electrical Component Market Revenue Share (%), by Type 2025 & 2033
- Figure 42: South America Industrial Electrical Component Market Volume Share (%), by Type 2025 & 2033
- Figure 43: South America Industrial Electrical Component Market Revenue (Million), by Sales Channels 2025 & 2033
- Figure 44: South America Industrial Electrical Component Market Volume (K Units), by Sales Channels 2025 & 2033
- Figure 45: South America Industrial Electrical Component Market Revenue Share (%), by Sales Channels 2025 & 2033
- Figure 46: South America Industrial Electrical Component Market Volume Share (%), by Sales Channels 2025 & 2033
- Figure 47: South America Industrial Electrical Component Market Revenue (Million), by Country 2025 & 2033
- Figure 48: South America Industrial Electrical Component Market Volume (K Units), by Country 2025 & 2033
- Figure 49: South America Industrial Electrical Component Market Revenue Share (%), by Country 2025 & 2033
- Figure 50: South America Industrial Electrical Component Market Volume Share (%), by Country 2025 & 2033
- Figure 51: Middle East Industrial Electrical Component Market Revenue (Million), by Type 2025 & 2033
- Figure 52: Middle East Industrial Electrical Component Market Volume (K Units), by Type 2025 & 2033
- Figure 53: Middle East Industrial Electrical Component Market Revenue Share (%), by Type 2025 & 2033
- Figure 54: Middle East Industrial Electrical Component Market Volume Share (%), by Type 2025 & 2033
- Figure 55: Middle East Industrial Electrical Component Market Revenue (Million), by Sales Channels 2025 & 2033
- Figure 56: Middle East Industrial Electrical Component Market Volume (K Units), by Sales Channels 2025 & 2033
- Figure 57: Middle East Industrial Electrical Component Market Revenue Share (%), by Sales Channels 2025 & 2033
- Figure 58: Middle East Industrial Electrical Component Market Volume Share (%), by Sales Channels 2025 & 2033
- Figure 59: Middle East Industrial Electrical Component Market Revenue (Million), by Country 2025 & 2033
- Figure 60: Middle East Industrial Electrical Component Market Volume (K Units), by Country 2025 & 2033
- Figure 61: Middle East Industrial Electrical Component Market Revenue Share (%), by Country 2025 & 2033
- Figure 62: Middle East Industrial Electrical Component Market Volume Share (%), by Country 2025 & 2033
- Figure 63: United Arab Emirates Industrial Electrical Component Market Revenue (Million), by Type 2025 & 2033
- Figure 64: United Arab Emirates Industrial Electrical Component Market Volume (K Units), by Type 2025 & 2033
- Figure 65: United Arab Emirates Industrial Electrical Component Market Revenue Share (%), by Type 2025 & 2033
- Figure 66: United Arab Emirates Industrial Electrical Component Market Volume Share (%), by Type 2025 & 2033
- Figure 67: United Arab Emirates Industrial Electrical Component Market Revenue (Million), by Sales Channels 2025 & 2033
- Figure 68: United Arab Emirates Industrial Electrical Component Market Volume (K Units), by Sales Channels 2025 & 2033
- Figure 69: United Arab Emirates Industrial Electrical Component Market Revenue Share (%), by Sales Channels 2025 & 2033
- Figure 70: United Arab Emirates Industrial Electrical Component Market Volume Share (%), by Sales Channels 2025 & 2033
- Figure 71: United Arab Emirates Industrial Electrical Component Market Revenue (Million), by Country 2025 & 2033
- Figure 72: United Arab Emirates Industrial Electrical Component Market Volume (K Units), by Country 2025 & 2033
- Figure 73: United Arab Emirates Industrial Electrical Component Market Revenue Share (%), by Country 2025 & 2033
- Figure 74: United Arab Emirates Industrial Electrical Component Market Volume Share (%), by Country 2025 & 2033
List of Tables
- Table 1: Global Industrial Electrical Component Market Revenue Million Forecast, by Type 2020 & 2033
- Table 2: Global Industrial Electrical Component Market Volume K Units Forecast, by Type 2020 & 2033
- Table 3: Global Industrial Electrical Component Market Revenue Million Forecast, by Sales Channels 2020 & 2033
- Table 4: Global Industrial Electrical Component Market Volume K Units Forecast, by Sales Channels 2020 & 2033
- Table 5: Global Industrial Electrical Component Market Revenue Million Forecast, by Region 2020 & 2033
- Table 6: Global Industrial Electrical Component Market Volume K Units Forecast, by Region 2020 & 2033
- Table 7: Global Industrial Electrical Component Market Revenue Million Forecast, by Type 2020 & 2033
- Table 8: Global Industrial Electrical Component Market Volume K Units Forecast, by Type 2020 & 2033
- Table 9: Global Industrial Electrical Component Market Revenue Million Forecast, by Sales Channels 2020 & 2033
- Table 10: Global Industrial Electrical Component Market Volume K Units Forecast, by Sales Channels 2020 & 2033
- Table 11: Global Industrial Electrical Component Market Revenue Million Forecast, by Country 2020 & 2033
- Table 12: Global Industrial Electrical Component Market Volume K Units Forecast, by Country 2020 & 2033
- Table 13: United States Industrial Electrical Component Market Revenue (Million) Forecast, by Application 2020 & 2033
- Table 14: United States Industrial Electrical Component Market Volume (K Units) Forecast, by Application 2020 & 2033
- Table 15: Canada Industrial Electrical Component Market Revenue (Million) Forecast, by Application 2020 & 2033
- Table 16: Canada Industrial Electrical Component Market Volume (K Units) Forecast, by Application 2020 & 2033
- Table 17: Rest of North America Industrial Electrical Component Market Revenue (Million) Forecast, by Application 2020 & 2033
- Table 18: Rest of North America Industrial Electrical Component Market Volume (K Units) Forecast, by Application 2020 & 2033
- Table 19: Global Industrial Electrical Component Market Revenue Million Forecast, by Type 2020 & 2033
- Table 20: Global Industrial Electrical Component Market Volume K Units Forecast, by Type 2020 & 2033
- Table 21: Global Industrial Electrical Component Market Revenue Million Forecast, by Sales Channels 2020 & 2033
- Table 22: Global Industrial Electrical Component Market Volume K Units Forecast, by Sales Channels 2020 & 2033
- Table 23: Global Industrial Electrical Component Market Revenue Million Forecast, by Country 2020 & 2033
- Table 24: Global Industrial Electrical Component Market Volume K Units Forecast, by Country 2020 & 2033
- Table 25: Germany Industrial Electrical Component Market Revenue (Million) Forecast, by Application 2020 & 2033
- Table 26: Germany Industrial Electrical Component Market Volume (K Units) Forecast, by Application 2020 & 2033
- Table 27: United Kingdom Industrial Electrical Component Market Revenue (Million) Forecast, by Application 2020 & 2033
- Table 28: United Kingdom Industrial Electrical Component Market Volume (K Units) Forecast, by Application 2020 & 2033
- Table 29: France Industrial Electrical Component Market Revenue (Million) Forecast, by Application 2020 & 2033
- Table 30: France Industrial Electrical Component Market Volume (K Units) Forecast, by Application 2020 & 2033
- Table 31: Russia Industrial Electrical Component Market Revenue (Million) Forecast, by Application 2020 & 2033
- Table 32: Russia Industrial Electrical Component Market Volume (K Units) Forecast, by Application 2020 & 2033
- Table 33: Spain Industrial Electrical Component Market Revenue (Million) Forecast, by Application 2020 & 2033
- Table 34: Spain Industrial Electrical Component Market Volume (K Units) Forecast, by Application 2020 & 2033
- Table 35: Rest of Europe Industrial Electrical Component Market Revenue (Million) Forecast, by Application 2020 & 2033
- Table 36: Rest of Europe Industrial Electrical Component Market Volume (K Units) Forecast, by Application 2020 & 2033
- Table 37: Global Industrial Electrical Component Market Revenue Million Forecast, by Type 2020 & 2033
- Table 38: Global Industrial Electrical Component Market Volume K Units Forecast, by Type 2020 & 2033
- Table 39: Global Industrial Electrical Component Market Revenue Million Forecast, by Sales Channels 2020 & 2033
- Table 40: Global Industrial Electrical Component Market Volume K Units Forecast, by Sales Channels 2020 & 2033
- Table 41: Global Industrial Electrical Component Market Revenue Million Forecast, by Country 2020 & 2033
- Table 42: Global Industrial Electrical Component Market Volume K Units Forecast, by Country 2020 & 2033
- Table 43: India Industrial Electrical Component Market Revenue (Million) Forecast, by Application 2020 & 2033
- Table 44: India Industrial Electrical Component Market Volume (K Units) Forecast, by Application 2020 & 2033
- Table 45: China Industrial Electrical Component Market Revenue (Million) Forecast, by Application 2020 & 2033
- Table 46: China Industrial Electrical Component Market Volume (K Units) Forecast, by Application 2020 & 2033
- Table 47: Japan Industrial Electrical Component Market Revenue (Million) Forecast, by Application 2020 & 2033
- Table 48: Japan Industrial Electrical Component Market Volume (K Units) Forecast, by Application 2020 & 2033
- Table 49: Rest of Asia Pacific Industrial Electrical Component Market Revenue (Million) Forecast, by Application 2020 & 2033
- Table 50: Rest of Asia Pacific Industrial Electrical Component Market Volume (K Units) Forecast, by Application 2020 & 2033
- Table 51: Global Industrial Electrical Component Market Revenue Million Forecast, by Type 2020 & 2033
- Table 52: Global Industrial Electrical Component Market Volume K Units Forecast, by Type 2020 & 2033
- Table 53: Global Industrial Electrical Component Market Revenue Million Forecast, by Sales Channels 2020 & 2033
- Table 54: Global Industrial Electrical Component Market Volume K Units Forecast, by Sales Channels 2020 & 2033
- Table 55: Global Industrial Electrical Component Market Revenue Million Forecast, by Country 2020 & 2033
- Table 56: Global Industrial Electrical Component Market Volume K Units Forecast, by Country 2020 & 2033
- Table 57: Brazil Industrial Electrical Component Market Revenue (Million) Forecast, by Application 2020 & 2033
- Table 58: Brazil Industrial Electrical Component Market Volume (K Units) Forecast, by Application 2020 & 2033
- Table 59: Argentina Industrial Electrical Component Market Revenue (Million) Forecast, by Application 2020 & 2033
- Table 60: Argentina Industrial Electrical Component Market Volume (K Units) Forecast, by Application 2020 & 2033
- Table 61: Rest of South America Industrial Electrical Component Market Revenue (Million) Forecast, by Application 2020 & 2033
- Table 62: Rest of South America Industrial Electrical Component Market Volume (K Units) Forecast, by Application 2020 & 2033
- Table 63: Global Industrial Electrical Component Market Revenue Million Forecast, by Type 2020 & 2033
- Table 64: Global Industrial Electrical Component Market Volume K Units Forecast, by Type 2020 & 2033
- Table 65: Global Industrial Electrical Component Market Revenue Million Forecast, by Sales Channels 2020 & 2033
- Table 66: Global Industrial Electrical Component Market Volume K Units Forecast, by Sales Channels 2020 & 2033
- Table 67: Global Industrial Electrical Component Market Revenue Million Forecast, by Country 2020 & 2033
- Table 68: Global Industrial Electrical Component Market Volume K Units Forecast, by Country 2020 & 2033
- Table 69: Global Industrial Electrical Component Market Revenue Million Forecast, by Type 2020 & 2033
- Table 70: Global Industrial Electrical Component Market Volume K Units Forecast, by Type 2020 & 2033
- Table 71: Global Industrial Electrical Component Market Revenue Million Forecast, by Sales Channels 2020 & 2033
- Table 72: Global Industrial Electrical Component Market Volume K Units Forecast, by Sales Channels 2020 & 2033
- Table 73: Global Industrial Electrical Component Market Revenue Million Forecast, by Country 2020 & 2033
- Table 74: Global Industrial Electrical Component Market Volume K Units Forecast, by Country 2020 & 2033
- Table 75: Saudi Arabia Industrial Electrical Component Market Revenue (Million) Forecast, by Application 2020 & 2033
- Table 76: Saudi Arabia Industrial Electrical Component Market Volume (K Units) Forecast, by Application 2020 & 2033
- Table 77: South Africa Industrial Electrical Component Market Revenue (Million) Forecast, by Application 2020 & 2033
- Table 78: South Africa Industrial Electrical Component Market Volume (K Units) Forecast, by Application 2020 & 2033
- Table 79: Rest of Middle East Industrial Electrical Component Market Revenue (Million) Forecast, by Application 2020 & 2033
- Table 80: Rest of Middle East Industrial Electrical Component Market Volume (K Units) Forecast, by Application 2020 & 2033
Frequently Asked Questions
1. What is the projected Compound Annual Growth Rate (CAGR) of the Industrial Electrical Component Market?
The projected CAGR is approximately > 4.00%.
2. Which companies are prominent players in the Industrial Electrical Component Market?
Key companies in the market include ABB Ltd *List Not Exhaustive, Eaton Corporation plc, Toshiba Corporation, Emerson Electric Co, Mitsubishi Electric Corporation, Siemens AG, Schneider Electric SE, OMRON Automotive Electronics Co Ltd, General Electric Company.
3. What are the main segments of the Industrial Electrical Component Market?
The market segments include Type, Sales Channels.
4. Can you provide details about the market size?
The market size is estimated to be USD 57.20 Million as of 2022.
5. What are some drivers contributing to market growth?
4.; High Electricity Demand from Industries4.; Enhancement in Economic Activities.
6. What are the notable trends driving market growth?
High Energy Demand from Industries is Expected to Drive the Market.
7. Are there any restraints impacting market growth?
4.; The Complex Maintenance Process of Components And the Emergence of Toxic Wastes that Affect the Environment.
8. Can you provide examples of recent developments in the market?
2023: Foxconn Technology Co. Ltd inked an agreement with the Indian government to set up a semiconductor fabrication manufacturing unit worth USD 500 million in Hyderabad. Semiconductors, a crucial part of manufacturing industrial electrical components, would help develop its market.
9. What pricing options are available for accessing the report?
Pricing options include single-user, multi-user, and enterprise licenses priced at USD 4750, USD 5250, and USD 8750 respectively.
10. Is the market size provided in terms of value or volume?
The market size is provided in terms of value, measured in Million and volume, measured in K Units.
11. Are there any specific market keywords associated with the report?
Yes, the market keyword associated with the report is "Industrial Electrical Component Market," which aids in identifying and referencing the specific market segment covered.
12. How do I determine which pricing option suits my needs best?
The pricing options vary based on user requirements and access needs. Individual users may opt for single-user licenses, while businesses requiring broader access may choose multi-user or enterprise licenses for cost-effective access to the report.
13. Are there any additional resources or data provided in the Industrial Electrical Component Market report?
While the report offers comprehensive insights, it's advisable to review the specific contents or supplementary materials provided to ascertain if additional resources or data are available.
14. How can I stay updated on further developments or reports in the Industrial Electrical Component Market?
To stay informed about further developments, trends, and reports in the Industrial Electrical Component Market, consider subscribing to industry newsletters, following relevant companies and organizations, or regularly checking reputable industry news sources and publications.
Methodology
Step 1 - Identification of Relevant Samples Size from Population Database


Step 2 - Approaches for Defining Global Market Size (Value, Volume* & Price*)

Note*: In applicable scenarios
Step 3 - Data Sources
Primary Research
- Web Analytics
- Survey Reports
- Research Institute
- Latest Research Reports
- Opinion Leaders
Secondary Research
- Annual Reports
- White Paper
- Latest Press Release
- Industry Association
- Paid Database
- Investor Presentations

Step 4 - Data Triangulation
Involves using different sources of information in order to increase the validity of a study
These sources are likely to be stakeholders in a program - participants, other researchers, program staff, other community members, and so on.
Then we put all data in single framework & apply various statistical tools to find out the dynamic on the market.
During the analysis stage, feedback from the stakeholder groups would be compared to determine areas of agreement as well as areas of divergence