
Key Insights
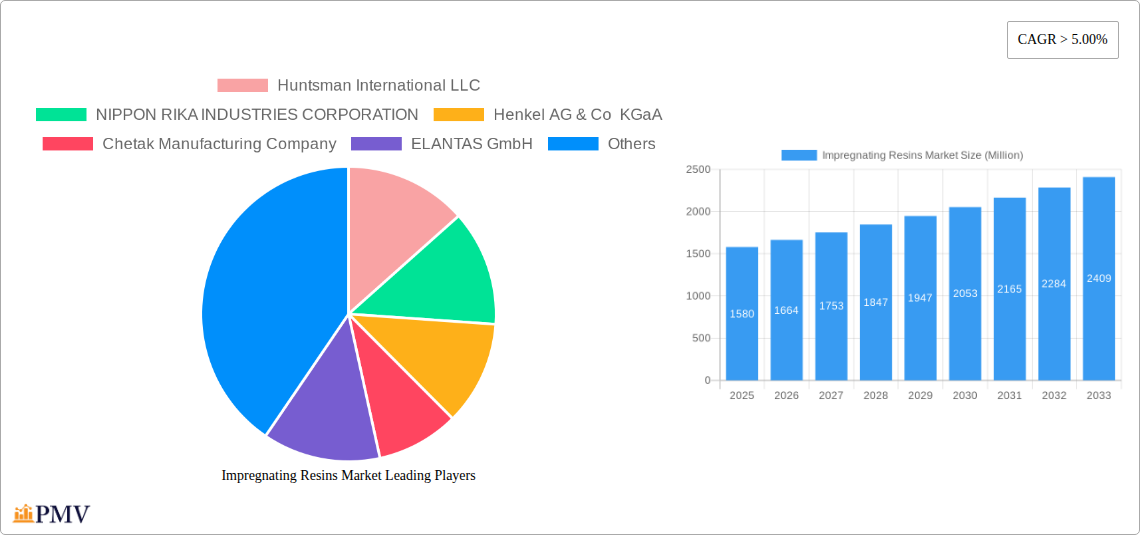
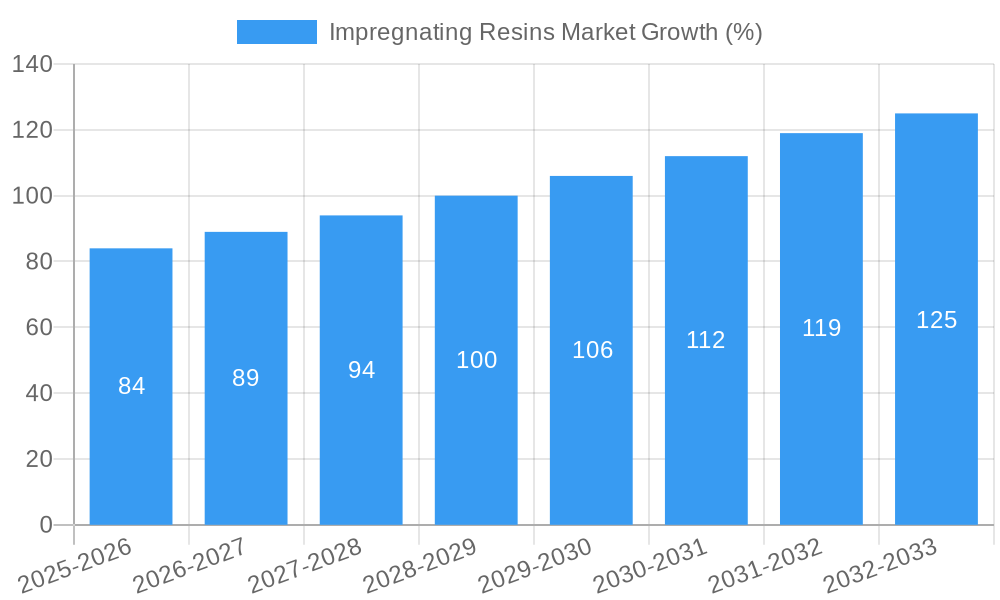
The global impregnating resins market, valued at $1.58 billion in 2025, is projected to experience robust growth, exhibiting a Compound Annual Growth Rate (CAGR) exceeding 5% from 2025 to 2033. This expansion is driven by the increasing demand for energy-efficient motors and generators across various sectors, including automotive and industrial applications. The rising adoption of electric vehicles (EVs) and hybrid electric vehicles (HEVs) further fuels market growth, as these vehicles rely heavily on advanced motor technology that requires high-performance impregnating resins for insulation and protection. Technological advancements in resin formulations, such as the development of solventless resins that offer improved environmental friendliness and reduced processing costs, are also contributing to market expansion. Furthermore, the growing emphasis on miniaturization and enhanced performance in electronic components necessitates the use of specialized impregnating resins with superior dielectric properties and thermal stability. However, fluctuating raw material prices and stringent environmental regulations pose potential challenges to market growth.
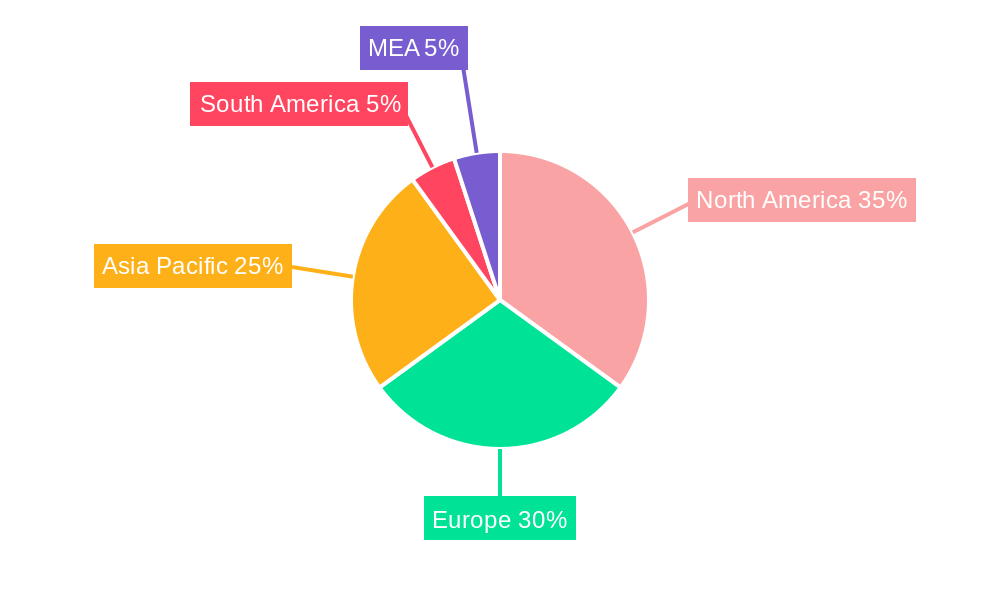
The market segmentation reveals a diverse landscape. Solventless resins are gaining traction due to their eco-friendly nature, while polyester and epoxy resins dominate the resin type segment owing to their cost-effectiveness and versatility. The application segment is led by motors and generators, reflecting the crucial role of impregnating resins in ensuring reliable operation and extended lifespan of these critical components. North America and Europe currently hold significant market shares, driven by established manufacturing bases and a strong focus on technological innovation. However, the Asia-Pacific region is anticipated to witness rapid growth in the coming years, fueled by increasing industrialization and rising disposable incomes in emerging economies like China and India. Key players like Huntsman International LLC, Nippon Rika Industries Corporation, and Henkel AG & Co KGaA are actively engaged in research and development, driving innovation and competition within the market. Strategic partnerships and mergers and acquisitions are expected to shape the competitive landscape in the years to come.
Impregnating Resins Market: A Comprehensive Report (2019-2033)
This comprehensive report provides a detailed analysis of the global Impregnating Resins market, offering invaluable insights for stakeholders across the value chain. Covering the period from 2019 to 2033, with 2025 as the base year and a forecast period of 2025-2033, this study meticulously examines market dynamics, competitive landscapes, and future growth trajectories. The report leverages rigorous data analysis and expert insights to provide actionable intelligence, enabling businesses to make informed strategic decisions. The global market size in 2025 is estimated at xx Million.
Impregnating Resins Market Market Structure & Competitive Dynamics
The Impregnating Resins market exhibits a moderately concentrated structure, with a few major players holding significant market share. The competitive landscape is characterized by ongoing innovation, strategic mergers and acquisitions (M&A), and a focus on developing high-performance, specialized resins. Regulatory frameworks, particularly concerning environmental compliance and safety standards, significantly impact market dynamics. The availability of substitute materials, such as alternative insulation methods, poses a moderate challenge to market growth. End-user trends, driven by increasing demand for energy-efficient and durable products in sectors like automotive and electronics, are shaping market demand.
- Market Concentration: The top five players account for approximately xx% of the global market share in 2025.
- Innovation Ecosystems: Significant R&D investments are fueling the development of novel resin formulations with enhanced properties like improved thermal stability and dielectric strength.
- Regulatory Frameworks: Stringent environmental regulations, particularly regarding volatile organic compound (VOC) emissions, are driving the adoption of solventless resin technologies.
- Product Substitutes: Competition from alternative insulation materials and technologies is a factor, although the inherent performance advantages of impregnating resins often outweigh the alternatives.
- M&A Activities: The past five years have witnessed xx M&A deals in the impregnating resins sector, with a total deal value of approximately xx Million. These activities reflect consolidation within the industry and efforts to expand product portfolios and market reach.
- End-User Trends: The rising demand for electric vehicles and advanced electronics is a key driver of market growth, as these applications require high-performance impregnating resins.
Impregnating Resins Market Industry Trends & Insights
The Impregnating Resins market is experiencing robust growth, driven by a confluence of factors. The increasing adoption of electric vehicles and hybrid vehicles is significantly boosting demand for high-performance insulation materials. Technological advancements, such as the development of nanotechnology-enhanced resins, are improving product capabilities and expanding applications. Consumer preference for energy-efficient and longer-lasting appliances is further fueling market expansion. The CAGR for the Impregnating Resins market is projected at xx% during the forecast period (2025-2033). Market penetration in key sectors, such as automotive and electrical & electronics, is expected to increase significantly. Competitive dynamics are marked by innovation, capacity expansions, and strategic partnerships. The market is also witnessing a shift towards sustainable and eco-friendly resin formulations to meet growing environmental concerns.
Dominant Markets & Segments in Impregnating Resins Market
The Asia-Pacific region currently holds the largest market share in the global Impregnating Resins market, driven by strong economic growth and increasing industrialization. Within the segments:
By Technology:
- Solventless Resins: This segment is experiencing rapid growth due to increasing environmental regulations and the inherent advantages of solventless formulations.
- Solvent-based Resins: While still significant, this segment faces pressure from stricter environmental regulations.
By Resin Type:
- Polyester: Polyester resins dominate the market due to their cost-effectiveness and versatility.
- Epoxy: Epoxy resins are gaining traction due to their superior performance characteristics, particularly in demanding applications.
- Polyesterimide: This niche segment is growing steadily, driven by its high-temperature resistance properties.
- Other Resin Types: This segment encompasses various specialized resins, catering to niche applications.
By Application:
- Motors and Generators: This application segment represents a major market for impregnating resins due to the high demand for efficient and reliable electrical motors.
- Automotive: The increasing use of electric and hybrid vehicles is significantly driving the demand for impregnating resins in the automotive industry.
- Transformer: This segment showcases robust growth because of the expansion of power grids and increased electricity demand.
- Electrical and Electronics Components: This broad application segment benefits from increasing electronics consumption and advanced technology development.
Key Drivers (Examples):
- Rapid industrialization and infrastructure development in emerging economies are fueling market expansion.
- Favorable government policies supporting renewable energy and electric vehicle adoption contribute significantly.
Impregnating Resins Market Product Innovations
Recent product developments focus on improving resin properties, such as thermal stability, dielectric strength, and moisture resistance. Manufacturers are increasingly incorporating nanotechnology and other advanced materials to enhance resin performance. This leads to higher efficiency and longevity of the end products. These innovations are driving market growth by enabling the use of impregnating resins in new and demanding applications.
Report Segmentation & Scope
This report provides a detailed segmentation of the Impregnating Resins market based on technology (solventless, solvent-based), resin type (polyester, epoxy, polyesterimide, others), and application (motors & generators, home appliances, transformers, electrical & electronics components, automotive, others). Each segment's market size, growth projections, and competitive dynamics are thoroughly analyzed, providing a comprehensive understanding of the market landscape.
Key Drivers of Impregnating Resins Market Growth
Key growth drivers include: rising demand for energy-efficient appliances, increased adoption of electric vehicles, expansion of the power grid, and the development of new applications in the electronics industry. Stringent environmental regulations are pushing the adoption of eco-friendly solventless resins, further stimulating growth. Technological advancements continue to improve resin performance and expand application possibilities.
Challenges in the Impregnating Resins Market Sector
Challenges include fluctuating raw material prices, stringent environmental regulations increasing production costs, and intense competition from substitute materials. Supply chain disruptions and the volatility of the global economy also pose risks to market stability. The overall impact of these factors is estimated to reduce the market growth rate by approximately xx% in specific years.
Leading Players in the Impregnating Resins Market Market
- Huntsman International LLC
- NIPPON RIKA INDUSTRIES CORPORATION
- Henkel AG & Co KGaA
- Chetak Manufacturing Company
- ELANTAS GmbH
- Axalta Coating Systems LLC
- AEV Ltd
- 3M
- Wacker Chemie AG
- Borger GmbH
- Polycast Industries Inc
- Momentive
Key Developments in Impregnating Resins Market Sector
- January 2023: Company X launched a new line of high-performance solventless resins.
- June 2022: Company Y acquired Company Z, expanding its product portfolio and market reach.
- October 2021: A new environmental regulation impacting solvent-based resins was implemented in Region A.
- (Further developments can be added here with specific dates and concise descriptions)
Strategic Impregnating Resins Market Market Outlook
The Impregnating Resins market is poised for continued growth, driven by technological innovations, increasing demand from key sectors, and supportive government policies. Strategic opportunities lie in developing sustainable and high-performance resin formulations, expanding into new applications, and focusing on efficient supply chain management. The market's long-term growth potential is considerable, particularly in emerging economies and sectors experiencing rapid technological advancements.
Impregnating Resins Market Segmentation
-
1. Technology
- 1.1. Solventless Resins
- 1.2. Solvent-based Resins
-
2. Resin Type
- 2.1. Polyester
- 2.2. Epoxy
- 2.3. Polyesterimide
- 2.4. Other Resin Types
-
3. Application
- 3.1. Motors and Generators
- 3.2. Home Appliances
- 3.3. Transformer
- 3.4. Electrical and Electronics Components
- 3.5. Automotive
- 3.6. Other Applications
Impregnating Resins Market Segmentation By Geography
-
1. Asia Pacific
- 1.1. China
- 1.2. India
- 1.3. Japan
- 1.4. South Korea
- 1.5. Malaysia
- 1.6. Thailand
- 1.7. Indonesia
- 1.8. Vietnam
- 1.9. Rest of Asia Pacific
-
2. North America
- 2.1. United States
- 2.2. Canada
- 2.3. Mexico
-
3. Europe
- 3.1. Germany
- 3.2. United Kingdom
- 3.3. France
- 3.4. Italy
- 3.5. Spain
- 3.6. NORDIC Countries
- 3.7. Turkey
- 3.8. Russia
- 3.9. Rest of Europe
-
4. South America
- 4.1. Brazil
- 4.2. Argentina
- 4.3. Colombia
- 4.4. Rest of South America
-
5. Middle East and Africa
- 5.1. Saudi Arabia
- 5.2. South Africa
- 5.3. Nigeria
- 5.4. Qatar
- 5.5. Egypt
- 5.6. United Arab Emirates
- 5.7. Rest of Middle East and Africa
Impregnating Resins Market REPORT HIGHLIGHTS
| Aspects | Details |
|---|---|
| Study Period | 2019-2033 |
| Base Year | 2024 |
| Estimated Year | 2025 |
| Forecast Period | 2025-2033 |
| Historical Period | 2019-2024 |
| Growth Rate | CAGR of > 5.00% from 2019-2033 |
| Segmentation |
|
Table of Contents
- 1. Introduction
- 1.1. Research Scope
- 1.2. Market Segmentation
- 1.3. Research Methodology
- 1.4. Definitions and Assumptions
- 2. Executive Summary
- 2.1. Introduction
- 3. Market Dynamics
- 3.1. Introduction
- 3.2. Market Drivers
- 3.2.1. Increasing Usage in the Electrical and Electronics Segment; Increasing Electric Veichles Production; Other Drivers
- 3.3. Market Restrains
- 3.3.1. Less Efficiency of Solvent-based Resin Systems; Other Restraints
- 3.4. Market Trends
- 3.4.1. Increasing Demand for Electrical and Electronics Components
- 4. Market Factor Analysis
- 4.1. Porters Five Forces
- 4.2. Supply/Value Chain
- 4.3. PESTEL analysis
- 4.4. Market Entropy
- 4.5. Patent/Trademark Analysis
- 5. Global Impregnating Resins Market Analysis, Insights and Forecast, 2019-2031
- 5.1. Market Analysis, Insights and Forecast - by Technology
- 5.1.1. Solventless Resins
- 5.1.2. Solvent-based Resins
- 5.2. Market Analysis, Insights and Forecast - by Resin Type
- 5.2.1. Polyester
- 5.2.2. Epoxy
- 5.2.3. Polyesterimide
- 5.2.4. Other Resin Types
- 5.3. Market Analysis, Insights and Forecast - by Application
- 5.3.1. Motors and Generators
- 5.3.2. Home Appliances
- 5.3.3. Transformer
- 5.3.4. Electrical and Electronics Components
- 5.3.5. Automotive
- 5.3.6. Other Applications
- 5.4. Market Analysis, Insights and Forecast - by Region
- 5.4.1. Asia Pacific
- 5.4.2. North America
- 5.4.3. Europe
- 5.4.4. South America
- 5.4.5. Middle East and Africa
- 5.1. Market Analysis, Insights and Forecast - by Technology
- 6. Asia Pacific Impregnating Resins Market Analysis, Insights and Forecast, 2019-2031
- 6.1. Market Analysis, Insights and Forecast - by Technology
- 6.1.1. Solventless Resins
- 6.1.2. Solvent-based Resins
- 6.2. Market Analysis, Insights and Forecast - by Resin Type
- 6.2.1. Polyester
- 6.2.2. Epoxy
- 6.2.3. Polyesterimide
- 6.2.4. Other Resin Types
- 6.3. Market Analysis, Insights and Forecast - by Application
- 6.3.1. Motors and Generators
- 6.3.2. Home Appliances
- 6.3.3. Transformer
- 6.3.4. Electrical and Electronics Components
- 6.3.5. Automotive
- 6.3.6. Other Applications
- 6.1. Market Analysis, Insights and Forecast - by Technology
- 7. North America Impregnating Resins Market Analysis, Insights and Forecast, 2019-2031
- 7.1. Market Analysis, Insights and Forecast - by Technology
- 7.1.1. Solventless Resins
- 7.1.2. Solvent-based Resins
- 7.2. Market Analysis, Insights and Forecast - by Resin Type
- 7.2.1. Polyester
- 7.2.2. Epoxy
- 7.2.3. Polyesterimide
- 7.2.4. Other Resin Types
- 7.3. Market Analysis, Insights and Forecast - by Application
- 7.3.1. Motors and Generators
- 7.3.2. Home Appliances
- 7.3.3. Transformer
- 7.3.4. Electrical and Electronics Components
- 7.3.5. Automotive
- 7.3.6. Other Applications
- 7.1. Market Analysis, Insights and Forecast - by Technology
- 8. Europe Impregnating Resins Market Analysis, Insights and Forecast, 2019-2031
- 8.1. Market Analysis, Insights and Forecast - by Technology
- 8.1.1. Solventless Resins
- 8.1.2. Solvent-based Resins
- 8.2. Market Analysis, Insights and Forecast - by Resin Type
- 8.2.1. Polyester
- 8.2.2. Epoxy
- 8.2.3. Polyesterimide
- 8.2.4. Other Resin Types
- 8.3. Market Analysis, Insights and Forecast - by Application
- 8.3.1. Motors and Generators
- 8.3.2. Home Appliances
- 8.3.3. Transformer
- 8.3.4. Electrical and Electronics Components
- 8.3.5. Automotive
- 8.3.6. Other Applications
- 8.1. Market Analysis, Insights and Forecast - by Technology
- 9. South America Impregnating Resins Market Analysis, Insights and Forecast, 2019-2031
- 9.1. Market Analysis, Insights and Forecast - by Technology
- 9.1.1. Solventless Resins
- 9.1.2. Solvent-based Resins
- 9.2. Market Analysis, Insights and Forecast - by Resin Type
- 9.2.1. Polyester
- 9.2.2. Epoxy
- 9.2.3. Polyesterimide
- 9.2.4. Other Resin Types
- 9.3. Market Analysis, Insights and Forecast - by Application
- 9.3.1. Motors and Generators
- 9.3.2. Home Appliances
- 9.3.3. Transformer
- 9.3.4. Electrical and Electronics Components
- 9.3.5. Automotive
- 9.3.6. Other Applications
- 9.1. Market Analysis, Insights and Forecast - by Technology
- 10. Middle East and Africa Impregnating Resins Market Analysis, Insights and Forecast, 2019-2031
- 10.1. Market Analysis, Insights and Forecast - by Technology
- 10.1.1. Solventless Resins
- 10.1.2. Solvent-based Resins
- 10.2. Market Analysis, Insights and Forecast - by Resin Type
- 10.2.1. Polyester
- 10.2.2. Epoxy
- 10.2.3. Polyesterimide
- 10.2.4. Other Resin Types
- 10.3. Market Analysis, Insights and Forecast - by Application
- 10.3.1. Motors and Generators
- 10.3.2. Home Appliances
- 10.3.3. Transformer
- 10.3.4. Electrical and Electronics Components
- 10.3.5. Automotive
- 10.3.6. Other Applications
- 10.1. Market Analysis, Insights and Forecast - by Technology
- 11. North America Impregnating Resins Market Analysis, Insights and Forecast, 2019-2031
- 11.1. Market Analysis, Insights and Forecast - By Country/Sub-region
- 11.1.1 United States
- 11.1.2 Canada
- 11.1.3 Mexico
- 12. Europe Impregnating Resins Market Analysis, Insights and Forecast, 2019-2031
- 12.1. Market Analysis, Insights and Forecast - By Country/Sub-region
- 12.1.1 Germany
- 12.1.2 United Kingdom
- 12.1.3 France
- 12.1.4 Spain
- 12.1.5 Italy
- 12.1.6 Spain
- 12.1.7 Belgium
- 12.1.8 Netherland
- 12.1.9 Nordics
- 12.1.10 Rest of Europe
- 13. Asia Pacific Impregnating Resins Market Analysis, Insights and Forecast, 2019-2031
- 13.1. Market Analysis, Insights and Forecast - By Country/Sub-region
- 13.1.1 China
- 13.1.2 Japan
- 13.1.3 India
- 13.1.4 South Korea
- 13.1.5 Southeast Asia
- 13.1.6 Australia
- 13.1.7 Indonesia
- 13.1.8 Phillipes
- 13.1.9 Singapore
- 13.1.10 Thailandc
- 13.1.11 Rest of Asia Pacific
- 14. South America Impregnating Resins Market Analysis, Insights and Forecast, 2019-2031
- 14.1. Market Analysis, Insights and Forecast - By Country/Sub-region
- 14.1.1 Brazil
- 14.1.2 Argentina
- 14.1.3 Peru
- 14.1.4 Chile
- 14.1.5 Colombia
- 14.1.6 Ecuador
- 14.1.7 Venezuela
- 14.1.8 Rest of South America
- 15. North America Impregnating Resins Market Analysis, Insights and Forecast, 2019-2031
- 15.1. Market Analysis, Insights and Forecast - By Country/Sub-region
- 15.1.1 United States
- 15.1.2 Canada
- 15.1.3 Mexico
- 16. MEA Impregnating Resins Market Analysis, Insights and Forecast, 2019-2031
- 16.1. Market Analysis, Insights and Forecast - By Country/Sub-region
- 16.1.1 United Arab Emirates
- 16.1.2 Saudi Arabia
- 16.1.3 South Africa
- 16.1.4 Rest of Middle East and Africa
- 17. Competitive Analysis
- 17.1. Global Market Share Analysis 2024
- 17.2. Company Profiles
- 17.2.1 Huntsman International LLC
- 17.2.1.1. Overview
- 17.2.1.2. Products
- 17.2.1.3. SWOT Analysis
- 17.2.1.4. Recent Developments
- 17.2.1.5. Financials (Based on Availability)
- 17.2.2 NIPPON RIKA INDUSTRIES CORPORATION
- 17.2.2.1. Overview
- 17.2.2.2. Products
- 17.2.2.3. SWOT Analysis
- 17.2.2.4. Recent Developments
- 17.2.2.5. Financials (Based on Availability)
- 17.2.3 Henkel AG & Co KGaA
- 17.2.3.1. Overview
- 17.2.3.2. Products
- 17.2.3.3. SWOT Analysis
- 17.2.3.4. Recent Developments
- 17.2.3.5. Financials (Based on Availability)
- 17.2.4 Chetak Manufacturing Company
- 17.2.4.1. Overview
- 17.2.4.2. Products
- 17.2.4.3. SWOT Analysis
- 17.2.4.4. Recent Developments
- 17.2.4.5. Financials (Based on Availability)
- 17.2.5 ELANTAS GmbH
- 17.2.5.1. Overview
- 17.2.5.2. Products
- 17.2.5.3. SWOT Analysis
- 17.2.5.4. Recent Developments
- 17.2.5.5. Financials (Based on Availability)
- 17.2.6 Axalta Coating Systems LLC
- 17.2.6.1. Overview
- 17.2.6.2. Products
- 17.2.6.3. SWOT Analysis
- 17.2.6.4. Recent Developments
- 17.2.6.5. Financials (Based on Availability)
- 17.2.7 AEV Ltd
- 17.2.7.1. Overview
- 17.2.7.2. Products
- 17.2.7.3. SWOT Analysis
- 17.2.7.4. Recent Developments
- 17.2.7.5. Financials (Based on Availability)
- 17.2.8 3M
- 17.2.8.1. Overview
- 17.2.8.2. Products
- 17.2.8.3. SWOT Analysis
- 17.2.8.4. Recent Developments
- 17.2.8.5. Financials (Based on Availability)
- 17.2.9 Wacker Chemie AG*List Not Exhaustive
- 17.2.9.1. Overview
- 17.2.9.2. Products
- 17.2.9.3. SWOT Analysis
- 17.2.9.4. Recent Developments
- 17.2.9.5. Financials (Based on Availability)
- 17.2.10 Borger GmbH
- 17.2.10.1. Overview
- 17.2.10.2. Products
- 17.2.10.3. SWOT Analysis
- 17.2.10.4. Recent Developments
- 17.2.10.5. Financials (Based on Availability)
- 17.2.11 Polycast Industries Inc
- 17.2.11.1. Overview
- 17.2.11.2. Products
- 17.2.11.3. SWOT Analysis
- 17.2.11.4. Recent Developments
- 17.2.11.5. Financials (Based on Availability)
- 17.2.12 Momentive
- 17.2.12.1. Overview
- 17.2.12.2. Products
- 17.2.12.3. SWOT Analysis
- 17.2.12.4. Recent Developments
- 17.2.12.5. Financials (Based on Availability)
- 17.2.1 Huntsman International LLC
List of Figures
- Figure 1: Global Impregnating Resins Market Revenue Breakdown (Million, %) by Region 2024 & 2032
- Figure 2: Global Impregnating Resins Market Volume Breakdown (Million, %) by Region 2024 & 2032
- Figure 3: North America Impregnating Resins Market Revenue (Million), by Country 2024 & 2032
- Figure 4: North America Impregnating Resins Market Volume (Million), by Country 2024 & 2032
- Figure 5: North America Impregnating Resins Market Revenue Share (%), by Country 2024 & 2032
- Figure 6: North America Impregnating Resins Market Volume Share (%), by Country 2024 & 2032
- Figure 7: Europe Impregnating Resins Market Revenue (Million), by Country 2024 & 2032
- Figure 8: Europe Impregnating Resins Market Volume (Million), by Country 2024 & 2032
- Figure 9: Europe Impregnating Resins Market Revenue Share (%), by Country 2024 & 2032
- Figure 10: Europe Impregnating Resins Market Volume Share (%), by Country 2024 & 2032
- Figure 11: Asia Pacific Impregnating Resins Market Revenue (Million), by Country 2024 & 2032
- Figure 12: Asia Pacific Impregnating Resins Market Volume (Million), by Country 2024 & 2032
- Figure 13: Asia Pacific Impregnating Resins Market Revenue Share (%), by Country 2024 & 2032
- Figure 14: Asia Pacific Impregnating Resins Market Volume Share (%), by Country 2024 & 2032
- Figure 15: South America Impregnating Resins Market Revenue (Million), by Country 2024 & 2032
- Figure 16: South America Impregnating Resins Market Volume (Million), by Country 2024 & 2032
- Figure 17: South America Impregnating Resins Market Revenue Share (%), by Country 2024 & 2032
- Figure 18: South America Impregnating Resins Market Volume Share (%), by Country 2024 & 2032
- Figure 19: North America Impregnating Resins Market Revenue (Million), by Country 2024 & 2032
- Figure 20: North America Impregnating Resins Market Volume (Million), by Country 2024 & 2032
- Figure 21: North America Impregnating Resins Market Revenue Share (%), by Country 2024 & 2032
- Figure 22: North America Impregnating Resins Market Volume Share (%), by Country 2024 & 2032
- Figure 23: MEA Impregnating Resins Market Revenue (Million), by Country 2024 & 2032
- Figure 24: MEA Impregnating Resins Market Volume (Million), by Country 2024 & 2032
- Figure 25: MEA Impregnating Resins Market Revenue Share (%), by Country 2024 & 2032
- Figure 26: MEA Impregnating Resins Market Volume Share (%), by Country 2024 & 2032
- Figure 27: Asia Pacific Impregnating Resins Market Revenue (Million), by Technology 2024 & 2032
- Figure 28: Asia Pacific Impregnating Resins Market Volume (Million), by Technology 2024 & 2032
- Figure 29: Asia Pacific Impregnating Resins Market Revenue Share (%), by Technology 2024 & 2032
- Figure 30: Asia Pacific Impregnating Resins Market Volume Share (%), by Technology 2024 & 2032
- Figure 31: Asia Pacific Impregnating Resins Market Revenue (Million), by Resin Type 2024 & 2032
- Figure 32: Asia Pacific Impregnating Resins Market Volume (Million), by Resin Type 2024 & 2032
- Figure 33: Asia Pacific Impregnating Resins Market Revenue Share (%), by Resin Type 2024 & 2032
- Figure 34: Asia Pacific Impregnating Resins Market Volume Share (%), by Resin Type 2024 & 2032
- Figure 35: Asia Pacific Impregnating Resins Market Revenue (Million), by Application 2024 & 2032
- Figure 36: Asia Pacific Impregnating Resins Market Volume (Million), by Application 2024 & 2032
- Figure 37: Asia Pacific Impregnating Resins Market Revenue Share (%), by Application 2024 & 2032
- Figure 38: Asia Pacific Impregnating Resins Market Volume Share (%), by Application 2024 & 2032
- Figure 39: Asia Pacific Impregnating Resins Market Revenue (Million), by Country 2024 & 2032
- Figure 40: Asia Pacific Impregnating Resins Market Volume (Million), by Country 2024 & 2032
- Figure 41: Asia Pacific Impregnating Resins Market Revenue Share (%), by Country 2024 & 2032
- Figure 42: Asia Pacific Impregnating Resins Market Volume Share (%), by Country 2024 & 2032
- Figure 43: North America Impregnating Resins Market Revenue (Million), by Technology 2024 & 2032
- Figure 44: North America Impregnating Resins Market Volume (Million), by Technology 2024 & 2032
- Figure 45: North America Impregnating Resins Market Revenue Share (%), by Technology 2024 & 2032
- Figure 46: North America Impregnating Resins Market Volume Share (%), by Technology 2024 & 2032
- Figure 47: North America Impregnating Resins Market Revenue (Million), by Resin Type 2024 & 2032
- Figure 48: North America Impregnating Resins Market Volume (Million), by Resin Type 2024 & 2032
- Figure 49: North America Impregnating Resins Market Revenue Share (%), by Resin Type 2024 & 2032
- Figure 50: North America Impregnating Resins Market Volume Share (%), by Resin Type 2024 & 2032
- Figure 51: North America Impregnating Resins Market Revenue (Million), by Application 2024 & 2032
- Figure 52: North America Impregnating Resins Market Volume (Million), by Application 2024 & 2032
- Figure 53: North America Impregnating Resins Market Revenue Share (%), by Application 2024 & 2032
- Figure 54: North America Impregnating Resins Market Volume Share (%), by Application 2024 & 2032
- Figure 55: North America Impregnating Resins Market Revenue (Million), by Country 2024 & 2032
- Figure 56: North America Impregnating Resins Market Volume (Million), by Country 2024 & 2032
- Figure 57: North America Impregnating Resins Market Revenue Share (%), by Country 2024 & 2032
- Figure 58: North America Impregnating Resins Market Volume Share (%), by Country 2024 & 2032
- Figure 59: Europe Impregnating Resins Market Revenue (Million), by Technology 2024 & 2032
- Figure 60: Europe Impregnating Resins Market Volume (Million), by Technology 2024 & 2032
- Figure 61: Europe Impregnating Resins Market Revenue Share (%), by Technology 2024 & 2032
- Figure 62: Europe Impregnating Resins Market Volume Share (%), by Technology 2024 & 2032
- Figure 63: Europe Impregnating Resins Market Revenue (Million), by Resin Type 2024 & 2032
- Figure 64: Europe Impregnating Resins Market Volume (Million), by Resin Type 2024 & 2032
- Figure 65: Europe Impregnating Resins Market Revenue Share (%), by Resin Type 2024 & 2032
- Figure 66: Europe Impregnating Resins Market Volume Share (%), by Resin Type 2024 & 2032
- Figure 67: Europe Impregnating Resins Market Revenue (Million), by Application 2024 & 2032
- Figure 68: Europe Impregnating Resins Market Volume (Million), by Application 2024 & 2032
- Figure 69: Europe Impregnating Resins Market Revenue Share (%), by Application 2024 & 2032
- Figure 70: Europe Impregnating Resins Market Volume Share (%), by Application 2024 & 2032
- Figure 71: Europe Impregnating Resins Market Revenue (Million), by Country 2024 & 2032
- Figure 72: Europe Impregnating Resins Market Volume (Million), by Country 2024 & 2032
- Figure 73: Europe Impregnating Resins Market Revenue Share (%), by Country 2024 & 2032
- Figure 74: Europe Impregnating Resins Market Volume Share (%), by Country 2024 & 2032
- Figure 75: South America Impregnating Resins Market Revenue (Million), by Technology 2024 & 2032
- Figure 76: South America Impregnating Resins Market Volume (Million), by Technology 2024 & 2032
- Figure 77: South America Impregnating Resins Market Revenue Share (%), by Technology 2024 & 2032
- Figure 78: South America Impregnating Resins Market Volume Share (%), by Technology 2024 & 2032
- Figure 79: South America Impregnating Resins Market Revenue (Million), by Resin Type 2024 & 2032
- Figure 80: South America Impregnating Resins Market Volume (Million), by Resin Type 2024 & 2032
- Figure 81: South America Impregnating Resins Market Revenue Share (%), by Resin Type 2024 & 2032
- Figure 82: South America Impregnating Resins Market Volume Share (%), by Resin Type 2024 & 2032
- Figure 83: South America Impregnating Resins Market Revenue (Million), by Application 2024 & 2032
- Figure 84: South America Impregnating Resins Market Volume (Million), by Application 2024 & 2032
- Figure 85: South America Impregnating Resins Market Revenue Share (%), by Application 2024 & 2032
- Figure 86: South America Impregnating Resins Market Volume Share (%), by Application 2024 & 2032
- Figure 87: South America Impregnating Resins Market Revenue (Million), by Country 2024 & 2032
- Figure 88: South America Impregnating Resins Market Volume (Million), by Country 2024 & 2032
- Figure 89: South America Impregnating Resins Market Revenue Share (%), by Country 2024 & 2032
- Figure 90: South America Impregnating Resins Market Volume Share (%), by Country 2024 & 2032
- Figure 91: Middle East and Africa Impregnating Resins Market Revenue (Million), by Technology 2024 & 2032
- Figure 92: Middle East and Africa Impregnating Resins Market Volume (Million), by Technology 2024 & 2032
- Figure 93: Middle East and Africa Impregnating Resins Market Revenue Share (%), by Technology 2024 & 2032
- Figure 94: Middle East and Africa Impregnating Resins Market Volume Share (%), by Technology 2024 & 2032
- Figure 95: Middle East and Africa Impregnating Resins Market Revenue (Million), by Resin Type 2024 & 2032
- Figure 96: Middle East and Africa Impregnating Resins Market Volume (Million), by Resin Type 2024 & 2032
- Figure 97: Middle East and Africa Impregnating Resins Market Revenue Share (%), by Resin Type 2024 & 2032
- Figure 98: Middle East and Africa Impregnating Resins Market Volume Share (%), by Resin Type 2024 & 2032
- Figure 99: Middle East and Africa Impregnating Resins Market Revenue (Million), by Application 2024 & 2032
- Figure 100: Middle East and Africa Impregnating Resins Market Volume (Million), by Application 2024 & 2032
- Figure 101: Middle East and Africa Impregnating Resins Market Revenue Share (%), by Application 2024 & 2032
- Figure 102: Middle East and Africa Impregnating Resins Market Volume Share (%), by Application 2024 & 2032
- Figure 103: Middle East and Africa Impregnating Resins Market Revenue (Million), by Country 2024 & 2032
- Figure 104: Middle East and Africa Impregnating Resins Market Volume (Million), by Country 2024 & 2032
- Figure 105: Middle East and Africa Impregnating Resins Market Revenue Share (%), by Country 2024 & 2032
- Figure 106: Middle East and Africa Impregnating Resins Market Volume Share (%), by Country 2024 & 2032
List of Tables
- Table 1: Global Impregnating Resins Market Revenue Million Forecast, by Region 2019 & 2032
- Table 2: Global Impregnating Resins Market Volume Million Forecast, by Region 2019 & 2032
- Table 3: Global Impregnating Resins Market Revenue Million Forecast, by Technology 2019 & 2032
- Table 4: Global Impregnating Resins Market Volume Million Forecast, by Technology 2019 & 2032
- Table 5: Global Impregnating Resins Market Revenue Million Forecast, by Resin Type 2019 & 2032
- Table 6: Global Impregnating Resins Market Volume Million Forecast, by Resin Type 2019 & 2032
- Table 7: Global Impregnating Resins Market Revenue Million Forecast, by Application 2019 & 2032
- Table 8: Global Impregnating Resins Market Volume Million Forecast, by Application 2019 & 2032
- Table 9: Global Impregnating Resins Market Revenue Million Forecast, by Region 2019 & 2032
- Table 10: Global Impregnating Resins Market Volume Million Forecast, by Region 2019 & 2032
- Table 11: Global Impregnating Resins Market Revenue Million Forecast, by Country 2019 & 2032
- Table 12: Global Impregnating Resins Market Volume Million Forecast, by Country 2019 & 2032
- Table 13: United States Impregnating Resins Market Revenue (Million) Forecast, by Application 2019 & 2032
- Table 14: United States Impregnating Resins Market Volume (Million) Forecast, by Application 2019 & 2032
- Table 15: Canada Impregnating Resins Market Revenue (Million) Forecast, by Application 2019 & 2032
- Table 16: Canada Impregnating Resins Market Volume (Million) Forecast, by Application 2019 & 2032
- Table 17: Mexico Impregnating Resins Market Revenue (Million) Forecast, by Application 2019 & 2032
- Table 18: Mexico Impregnating Resins Market Volume (Million) Forecast, by Application 2019 & 2032
- Table 19: Global Impregnating Resins Market Revenue Million Forecast, by Country 2019 & 2032
- Table 20: Global Impregnating Resins Market Volume Million Forecast, by Country 2019 & 2032
- Table 21: Germany Impregnating Resins Market Revenue (Million) Forecast, by Application 2019 & 2032
- Table 22: Germany Impregnating Resins Market Volume (Million) Forecast, by Application 2019 & 2032
- Table 23: United Kingdom Impregnating Resins Market Revenue (Million) Forecast, by Application 2019 & 2032
- Table 24: United Kingdom Impregnating Resins Market Volume (Million) Forecast, by Application 2019 & 2032
- Table 25: France Impregnating Resins Market Revenue (Million) Forecast, by Application 2019 & 2032
- Table 26: France Impregnating Resins Market Volume (Million) Forecast, by Application 2019 & 2032
- Table 27: Spain Impregnating Resins Market Revenue (Million) Forecast, by Application 2019 & 2032
- Table 28: Spain Impregnating Resins Market Volume (Million) Forecast, by Application 2019 & 2032
- Table 29: Italy Impregnating Resins Market Revenue (Million) Forecast, by Application 2019 & 2032
- Table 30: Italy Impregnating Resins Market Volume (Million) Forecast, by Application 2019 & 2032
- Table 31: Spain Impregnating Resins Market Revenue (Million) Forecast, by Application 2019 & 2032
- Table 32: Spain Impregnating Resins Market Volume (Million) Forecast, by Application 2019 & 2032
- Table 33: Belgium Impregnating Resins Market Revenue (Million) Forecast, by Application 2019 & 2032
- Table 34: Belgium Impregnating Resins Market Volume (Million) Forecast, by Application 2019 & 2032
- Table 35: Netherland Impregnating Resins Market Revenue (Million) Forecast, by Application 2019 & 2032
- Table 36: Netherland Impregnating Resins Market Volume (Million) Forecast, by Application 2019 & 2032
- Table 37: Nordics Impregnating Resins Market Revenue (Million) Forecast, by Application 2019 & 2032
- Table 38: Nordics Impregnating Resins Market Volume (Million) Forecast, by Application 2019 & 2032
- Table 39: Rest of Europe Impregnating Resins Market Revenue (Million) Forecast, by Application 2019 & 2032
- Table 40: Rest of Europe Impregnating Resins Market Volume (Million) Forecast, by Application 2019 & 2032
- Table 41: Global Impregnating Resins Market Revenue Million Forecast, by Country 2019 & 2032
- Table 42: Global Impregnating Resins Market Volume Million Forecast, by Country 2019 & 2032
- Table 43: China Impregnating Resins Market Revenue (Million) Forecast, by Application 2019 & 2032
- Table 44: China Impregnating Resins Market Volume (Million) Forecast, by Application 2019 & 2032
- Table 45: Japan Impregnating Resins Market Revenue (Million) Forecast, by Application 2019 & 2032
- Table 46: Japan Impregnating Resins Market Volume (Million) Forecast, by Application 2019 & 2032
- Table 47: India Impregnating Resins Market Revenue (Million) Forecast, by Application 2019 & 2032
- Table 48: India Impregnating Resins Market Volume (Million) Forecast, by Application 2019 & 2032
- Table 49: South Korea Impregnating Resins Market Revenue (Million) Forecast, by Application 2019 & 2032
- Table 50: South Korea Impregnating Resins Market Volume (Million) Forecast, by Application 2019 & 2032
- Table 51: Southeast Asia Impregnating Resins Market Revenue (Million) Forecast, by Application 2019 & 2032
- Table 52: Southeast Asia Impregnating Resins Market Volume (Million) Forecast, by Application 2019 & 2032
- Table 53: Australia Impregnating Resins Market Revenue (Million) Forecast, by Application 2019 & 2032
- Table 54: Australia Impregnating Resins Market Volume (Million) Forecast, by Application 2019 & 2032
- Table 55: Indonesia Impregnating Resins Market Revenue (Million) Forecast, by Application 2019 & 2032
- Table 56: Indonesia Impregnating Resins Market Volume (Million) Forecast, by Application 2019 & 2032
- Table 57: Phillipes Impregnating Resins Market Revenue (Million) Forecast, by Application 2019 & 2032
- Table 58: Phillipes Impregnating Resins Market Volume (Million) Forecast, by Application 2019 & 2032
- Table 59: Singapore Impregnating Resins Market Revenue (Million) Forecast, by Application 2019 & 2032
- Table 60: Singapore Impregnating Resins Market Volume (Million) Forecast, by Application 2019 & 2032
- Table 61: Thailandc Impregnating Resins Market Revenue (Million) Forecast, by Application 2019 & 2032
- Table 62: Thailandc Impregnating Resins Market Volume (Million) Forecast, by Application 2019 & 2032
- Table 63: Rest of Asia Pacific Impregnating Resins Market Revenue (Million) Forecast, by Application 2019 & 2032
- Table 64: Rest of Asia Pacific Impregnating Resins Market Volume (Million) Forecast, by Application 2019 & 2032
- Table 65: Global Impregnating Resins Market Revenue Million Forecast, by Country 2019 & 2032
- Table 66: Global Impregnating Resins Market Volume Million Forecast, by Country 2019 & 2032
- Table 67: Brazil Impregnating Resins Market Revenue (Million) Forecast, by Application 2019 & 2032
- Table 68: Brazil Impregnating Resins Market Volume (Million) Forecast, by Application 2019 & 2032
- Table 69: Argentina Impregnating Resins Market Revenue (Million) Forecast, by Application 2019 & 2032
- Table 70: Argentina Impregnating Resins Market Volume (Million) Forecast, by Application 2019 & 2032
- Table 71: Peru Impregnating Resins Market Revenue (Million) Forecast, by Application 2019 & 2032
- Table 72: Peru Impregnating Resins Market Volume (Million) Forecast, by Application 2019 & 2032
- Table 73: Chile Impregnating Resins Market Revenue (Million) Forecast, by Application 2019 & 2032
- Table 74: Chile Impregnating Resins Market Volume (Million) Forecast, by Application 2019 & 2032
- Table 75: Colombia Impregnating Resins Market Revenue (Million) Forecast, by Application 2019 & 2032
- Table 76: Colombia Impregnating Resins Market Volume (Million) Forecast, by Application 2019 & 2032
- Table 77: Ecuador Impregnating Resins Market Revenue (Million) Forecast, by Application 2019 & 2032
- Table 78: Ecuador Impregnating Resins Market Volume (Million) Forecast, by Application 2019 & 2032
- Table 79: Venezuela Impregnating Resins Market Revenue (Million) Forecast, by Application 2019 & 2032
- Table 80: Venezuela Impregnating Resins Market Volume (Million) Forecast, by Application 2019 & 2032
- Table 81: Rest of South America Impregnating Resins Market Revenue (Million) Forecast, by Application 2019 & 2032
- Table 82: Rest of South America Impregnating Resins Market Volume (Million) Forecast, by Application 2019 & 2032
- Table 83: Global Impregnating Resins Market Revenue Million Forecast, by Country 2019 & 2032
- Table 84: Global Impregnating Resins Market Volume Million Forecast, by Country 2019 & 2032
- Table 85: United States Impregnating Resins Market Revenue (Million) Forecast, by Application 2019 & 2032
- Table 86: United States Impregnating Resins Market Volume (Million) Forecast, by Application 2019 & 2032
- Table 87: Canada Impregnating Resins Market Revenue (Million) Forecast, by Application 2019 & 2032
- Table 88: Canada Impregnating Resins Market Volume (Million) Forecast, by Application 2019 & 2032
- Table 89: Mexico Impregnating Resins Market Revenue (Million) Forecast, by Application 2019 & 2032
- Table 90: Mexico Impregnating Resins Market Volume (Million) Forecast, by Application 2019 & 2032
- Table 91: Global Impregnating Resins Market Revenue Million Forecast, by Country 2019 & 2032
- Table 92: Global Impregnating Resins Market Volume Million Forecast, by Country 2019 & 2032
- Table 93: United Arab Emirates Impregnating Resins Market Revenue (Million) Forecast, by Application 2019 & 2032
- Table 94: United Arab Emirates Impregnating Resins Market Volume (Million) Forecast, by Application 2019 & 2032
- Table 95: Saudi Arabia Impregnating Resins Market Revenue (Million) Forecast, by Application 2019 & 2032
- Table 96: Saudi Arabia Impregnating Resins Market Volume (Million) Forecast, by Application 2019 & 2032
- Table 97: South Africa Impregnating Resins Market Revenue (Million) Forecast, by Application 2019 & 2032
- Table 98: South Africa Impregnating Resins Market Volume (Million) Forecast, by Application 2019 & 2032
- Table 99: Rest of Middle East and Africa Impregnating Resins Market Revenue (Million) Forecast, by Application 2019 & 2032
- Table 100: Rest of Middle East and Africa Impregnating Resins Market Volume (Million) Forecast, by Application 2019 & 2032
- Table 101: Global Impregnating Resins Market Revenue Million Forecast, by Technology 2019 & 2032
- Table 102: Global Impregnating Resins Market Volume Million Forecast, by Technology 2019 & 2032
- Table 103: Global Impregnating Resins Market Revenue Million Forecast, by Resin Type 2019 & 2032
- Table 104: Global Impregnating Resins Market Volume Million Forecast, by Resin Type 2019 & 2032
- Table 105: Global Impregnating Resins Market Revenue Million Forecast, by Application 2019 & 2032
- Table 106: Global Impregnating Resins Market Volume Million Forecast, by Application 2019 & 2032
- Table 107: Global Impregnating Resins Market Revenue Million Forecast, by Country 2019 & 2032
- Table 108: Global Impregnating Resins Market Volume Million Forecast, by Country 2019 & 2032
- Table 109: China Impregnating Resins Market Revenue (Million) Forecast, by Application 2019 & 2032
- Table 110: China Impregnating Resins Market Volume (Million) Forecast, by Application 2019 & 2032
- Table 111: India Impregnating Resins Market Revenue (Million) Forecast, by Application 2019 & 2032
- Table 112: India Impregnating Resins Market Volume (Million) Forecast, by Application 2019 & 2032
- Table 113: Japan Impregnating Resins Market Revenue (Million) Forecast, by Application 2019 & 2032
- Table 114: Japan Impregnating Resins Market Volume (Million) Forecast, by Application 2019 & 2032
- Table 115: South Korea Impregnating Resins Market Revenue (Million) Forecast, by Application 2019 & 2032
- Table 116: South Korea Impregnating Resins Market Volume (Million) Forecast, by Application 2019 & 2032
- Table 117: Malaysia Impregnating Resins Market Revenue (Million) Forecast, by Application 2019 & 2032
- Table 118: Malaysia Impregnating Resins Market Volume (Million) Forecast, by Application 2019 & 2032
- Table 119: Thailand Impregnating Resins Market Revenue (Million) Forecast, by Application 2019 & 2032
- Table 120: Thailand Impregnating Resins Market Volume (Million) Forecast, by Application 2019 & 2032
- Table 121: Indonesia Impregnating Resins Market Revenue (Million) Forecast, by Application 2019 & 2032
- Table 122: Indonesia Impregnating Resins Market Volume (Million) Forecast, by Application 2019 & 2032
- Table 123: Vietnam Impregnating Resins Market Revenue (Million) Forecast, by Application 2019 & 2032
- Table 124: Vietnam Impregnating Resins Market Volume (Million) Forecast, by Application 2019 & 2032
- Table 125: Rest of Asia Pacific Impregnating Resins Market Revenue (Million) Forecast, by Application 2019 & 2032
- Table 126: Rest of Asia Pacific Impregnating Resins Market Volume (Million) Forecast, by Application 2019 & 2032
- Table 127: Global Impregnating Resins Market Revenue Million Forecast, by Technology 2019 & 2032
- Table 128: Global Impregnating Resins Market Volume Million Forecast, by Technology 2019 & 2032
- Table 129: Global Impregnating Resins Market Revenue Million Forecast, by Resin Type 2019 & 2032
- Table 130: Global Impregnating Resins Market Volume Million Forecast, by Resin Type 2019 & 2032
- Table 131: Global Impregnating Resins Market Revenue Million Forecast, by Application 2019 & 2032
- Table 132: Global Impregnating Resins Market Volume Million Forecast, by Application 2019 & 2032
- Table 133: Global Impregnating Resins Market Revenue Million Forecast, by Country 2019 & 2032
- Table 134: Global Impregnating Resins Market Volume Million Forecast, by Country 2019 & 2032
- Table 135: United States Impregnating Resins Market Revenue (Million) Forecast, by Application 2019 & 2032
- Table 136: United States Impregnating Resins Market Volume (Million) Forecast, by Application 2019 & 2032
- Table 137: Canada Impregnating Resins Market Revenue (Million) Forecast, by Application 2019 & 2032
- Table 138: Canada Impregnating Resins Market Volume (Million) Forecast, by Application 2019 & 2032
- Table 139: Mexico Impregnating Resins Market Revenue (Million) Forecast, by Application 2019 & 2032
- Table 140: Mexico Impregnating Resins Market Volume (Million) Forecast, by Application 2019 & 2032
- Table 141: Global Impregnating Resins Market Revenue Million Forecast, by Technology 2019 & 2032
- Table 142: Global Impregnating Resins Market Volume Million Forecast, by Technology 2019 & 2032
- Table 143: Global Impregnating Resins Market Revenue Million Forecast, by Resin Type 2019 & 2032
- Table 144: Global Impregnating Resins Market Volume Million Forecast, by Resin Type 2019 & 2032
- Table 145: Global Impregnating Resins Market Revenue Million Forecast, by Application 2019 & 2032
- Table 146: Global Impregnating Resins Market Volume Million Forecast, by Application 2019 & 2032
- Table 147: Global Impregnating Resins Market Revenue Million Forecast, by Country 2019 & 2032
- Table 148: Global Impregnating Resins Market Volume Million Forecast, by Country 2019 & 2032
- Table 149: Germany Impregnating Resins Market Revenue (Million) Forecast, by Application 2019 & 2032
- Table 150: Germany Impregnating Resins Market Volume (Million) Forecast, by Application 2019 & 2032
- Table 151: United Kingdom Impregnating Resins Market Revenue (Million) Forecast, by Application 2019 & 2032
- Table 152: United Kingdom Impregnating Resins Market Volume (Million) Forecast, by Application 2019 & 2032
- Table 153: France Impregnating Resins Market Revenue (Million) Forecast, by Application 2019 & 2032
- Table 154: France Impregnating Resins Market Volume (Million) Forecast, by Application 2019 & 2032
- Table 155: Italy Impregnating Resins Market Revenue (Million) Forecast, by Application 2019 & 2032
- Table 156: Italy Impregnating Resins Market Volume (Million) Forecast, by Application 2019 & 2032
- Table 157: Spain Impregnating Resins Market Revenue (Million) Forecast, by Application 2019 & 2032
- Table 158: Spain Impregnating Resins Market Volume (Million) Forecast, by Application 2019 & 2032
- Table 159: NORDIC Countries Impregnating Resins Market Revenue (Million) Forecast, by Application 2019 & 2032
- Table 160: NORDIC Countries Impregnating Resins Market Volume (Million) Forecast, by Application 2019 & 2032
- Table 161: Turkey Impregnating Resins Market Revenue (Million) Forecast, by Application 2019 & 2032
- Table 162: Turkey Impregnating Resins Market Volume (Million) Forecast, by Application 2019 & 2032
- Table 163: Russia Impregnating Resins Market Revenue (Million) Forecast, by Application 2019 & 2032
- Table 164: Russia Impregnating Resins Market Volume (Million) Forecast, by Application 2019 & 2032
- Table 165: Rest of Europe Impregnating Resins Market Revenue (Million) Forecast, by Application 2019 & 2032
- Table 166: Rest of Europe Impregnating Resins Market Volume (Million) Forecast, by Application 2019 & 2032
- Table 167: Global Impregnating Resins Market Revenue Million Forecast, by Technology 2019 & 2032
- Table 168: Global Impregnating Resins Market Volume Million Forecast, by Technology 2019 & 2032
- Table 169: Global Impregnating Resins Market Revenue Million Forecast, by Resin Type 2019 & 2032
- Table 170: Global Impregnating Resins Market Volume Million Forecast, by Resin Type 2019 & 2032
- Table 171: Global Impregnating Resins Market Revenue Million Forecast, by Application 2019 & 2032
- Table 172: Global Impregnating Resins Market Volume Million Forecast, by Application 2019 & 2032
- Table 173: Global Impregnating Resins Market Revenue Million Forecast, by Country 2019 & 2032
- Table 174: Global Impregnating Resins Market Volume Million Forecast, by Country 2019 & 2032
- Table 175: Brazil Impregnating Resins Market Revenue (Million) Forecast, by Application 2019 & 2032
- Table 176: Brazil Impregnating Resins Market Volume (Million) Forecast, by Application 2019 & 2032
- Table 177: Argentina Impregnating Resins Market Revenue (Million) Forecast, by Application 2019 & 2032
- Table 178: Argentina Impregnating Resins Market Volume (Million) Forecast, by Application 2019 & 2032
- Table 179: Colombia Impregnating Resins Market Revenue (Million) Forecast, by Application 2019 & 2032
- Table 180: Colombia Impregnating Resins Market Volume (Million) Forecast, by Application 2019 & 2032
- Table 181: Rest of South America Impregnating Resins Market Revenue (Million) Forecast, by Application 2019 & 2032
- Table 182: Rest of South America Impregnating Resins Market Volume (Million) Forecast, by Application 2019 & 2032
- Table 183: Global Impregnating Resins Market Revenue Million Forecast, by Technology 2019 & 2032
- Table 184: Global Impregnating Resins Market Volume Million Forecast, by Technology 2019 & 2032
- Table 185: Global Impregnating Resins Market Revenue Million Forecast, by Resin Type 2019 & 2032
- Table 186: Global Impregnating Resins Market Volume Million Forecast, by Resin Type 2019 & 2032
- Table 187: Global Impregnating Resins Market Revenue Million Forecast, by Application 2019 & 2032
- Table 188: Global Impregnating Resins Market Volume Million Forecast, by Application 2019 & 2032
- Table 189: Global Impregnating Resins Market Revenue Million Forecast, by Country 2019 & 2032
- Table 190: Global Impregnating Resins Market Volume Million Forecast, by Country 2019 & 2032
- Table 191: Saudi Arabia Impregnating Resins Market Revenue (Million) Forecast, by Application 2019 & 2032
- Table 192: Saudi Arabia Impregnating Resins Market Volume (Million) Forecast, by Application 2019 & 2032
- Table 193: South Africa Impregnating Resins Market Revenue (Million) Forecast, by Application 2019 & 2032
- Table 194: South Africa Impregnating Resins Market Volume (Million) Forecast, by Application 2019 & 2032
- Table 195: Nigeria Impregnating Resins Market Revenue (Million) Forecast, by Application 2019 & 2032
- Table 196: Nigeria Impregnating Resins Market Volume (Million) Forecast, by Application 2019 & 2032
- Table 197: Qatar Impregnating Resins Market Revenue (Million) Forecast, by Application 2019 & 2032
- Table 198: Qatar Impregnating Resins Market Volume (Million) Forecast, by Application 2019 & 2032
- Table 199: Egypt Impregnating Resins Market Revenue (Million) Forecast, by Application 2019 & 2032
- Table 200: Egypt Impregnating Resins Market Volume (Million) Forecast, by Application 2019 & 2032
- Table 201: United Arab Emirates Impregnating Resins Market Revenue (Million) Forecast, by Application 2019 & 2032
- Table 202: United Arab Emirates Impregnating Resins Market Volume (Million) Forecast, by Application 2019 & 2032
- Table 203: Rest of Middle East and Africa Impregnating Resins Market Revenue (Million) Forecast, by Application 2019 & 2032
- Table 204: Rest of Middle East and Africa Impregnating Resins Market Volume (Million) Forecast, by Application 2019 & 2032
Frequently Asked Questions
1. What is the projected Compound Annual Growth Rate (CAGR) of the Impregnating Resins Market?
The projected CAGR is approximately > 5.00%.
2. Which companies are prominent players in the Impregnating Resins Market?
Key companies in the market include Huntsman International LLC, NIPPON RIKA INDUSTRIES CORPORATION, Henkel AG & Co KGaA, Chetak Manufacturing Company, ELANTAS GmbH, Axalta Coating Systems LLC, AEV Ltd, 3M, Wacker Chemie AG*List Not Exhaustive, Borger GmbH, Polycast Industries Inc, Momentive.
3. What are the main segments of the Impregnating Resins Market?
The market segments include Technology, Resin Type, Application.
4. Can you provide details about the market size?
The market size is estimated to be USD 1.58 Million as of 2022.
5. What are some drivers contributing to market growth?
Increasing Usage in the Electrical and Electronics Segment; Increasing Electric Veichles Production; Other Drivers.
6. What are the notable trends driving market growth?
Increasing Demand for Electrical and Electronics Components.
7. Are there any restraints impacting market growth?
Less Efficiency of Solvent-based Resin Systems; Other Restraints.
8. Can you provide examples of recent developments in the market?
N/A
9. What pricing options are available for accessing the report?
Pricing options include single-user, multi-user, and enterprise licenses priced at USD 4750, USD 5250, and USD 8750 respectively.
10. Is the market size provided in terms of value or volume?
The market size is provided in terms of value, measured in Million and volume, measured in Million.
11. Are there any specific market keywords associated with the report?
Yes, the market keyword associated with the report is "Impregnating Resins Market," which aids in identifying and referencing the specific market segment covered.
12. How do I determine which pricing option suits my needs best?
The pricing options vary based on user requirements and access needs. Individual users may opt for single-user licenses, while businesses requiring broader access may choose multi-user or enterprise licenses for cost-effective access to the report.
13. Are there any additional resources or data provided in the Impregnating Resins Market report?
While the report offers comprehensive insights, it's advisable to review the specific contents or supplementary materials provided to ascertain if additional resources or data are available.
14. How can I stay updated on further developments or reports in the Impregnating Resins Market?
To stay informed about further developments, trends, and reports in the Impregnating Resins Market, consider subscribing to industry newsletters, following relevant companies and organizations, or regularly checking reputable industry news sources and publications.
Methodology
Step 1 - Identification of Relevant Samples Size from Population Database


Step 2 - Approaches for Defining Global Market Size (Value, Volume* & Price*)

Note*: In applicable scenarios
Step 3 - Data Sources
Primary Research
- Web Analytics
- Survey Reports
- Research Institute
- Latest Research Reports
- Opinion Leaders
Secondary Research
- Annual Reports
- White Paper
- Latest Press Release
- Industry Association
- Paid Database
- Investor Presentations

Step 4 - Data Triangulation
Involves using different sources of information in order to increase the validity of a study
These sources are likely to be stakeholders in a program - participants, other researchers, program staff, other community members, and so on.
Then we put all data in single framework & apply various statistical tools to find out the dynamic on the market.
During the analysis stage, feedback from the stakeholder groups would be compared to determine areas of agreement as well as areas of divergence


