

Key Insights
The global holographic tapes market is poised for substantial expansion, projected to reach USD 10.51 billion in 2025, with an impressive Compound Annual Growth Rate (CAGR) of 12.1% from 2025 to 2033. This robust growth is fueled by increasing demand across diverse industries seeking enhanced product security, authentication, and visual appeal. The Food and Beverage Industry is a primary driver, utilizing holographic tapes for tamper-evident packaging and counterfeit prevention of high-value food products. Similarly, the Pharmaceutical Industry relies heavily on these tapes to combat the pervasive issue of counterfeit drugs, ensuring patient safety and brand integrity. The Personal Care and Cosmetics Industry is also a significant contributor, employing holographic tapes for premium branding, anti-counterfeiting measures, and to attract consumer attention with their visually striking effects. Further adoption in the Electrical and Electronics Industry for product authentication and anti-tampering purposes, alongside the traditional Tobacco Industry for brand protection, solidifies the market's upward trajectory.

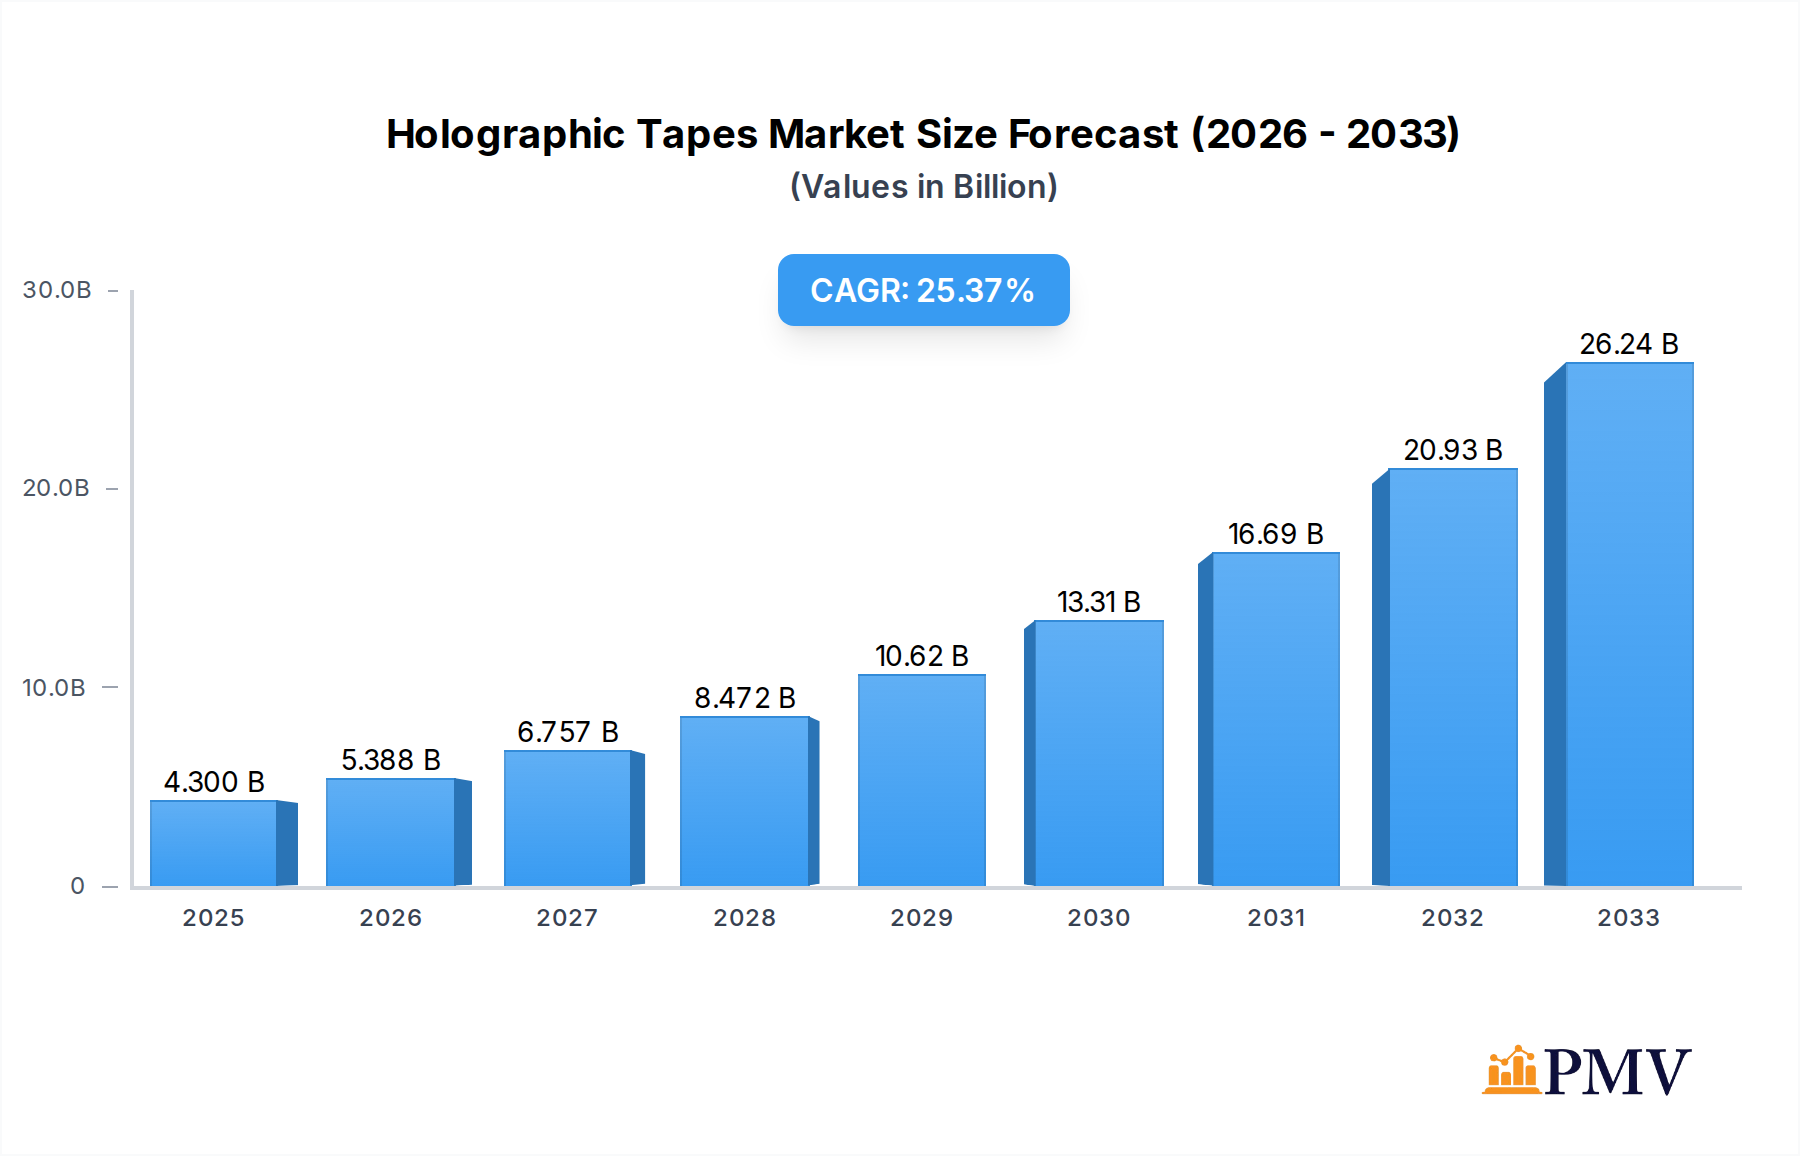
Holographic Tapes Market Size (In Billion)
The market's expansion is further supported by technological advancements leading to more sophisticated and cost-effective holographic solutions. The increasing awareness among consumers and businesses about the threat of counterfeiting and the need for product traceability are paramount drivers. While the market benefits from strong demand, potential restraints could include the initial investment costs for advanced holographic tape manufacturing and the complexity of integration into existing packaging lines. However, ongoing innovations in material science and printing techniques are expected to mitigate these challenges. The market is segmented by type, with Polyethylene Terephthalate (PET) Type and Polypropylene (PP) Type likely dominating due to their versatility and cost-effectiveness. Geographically, the Asia Pacific region, particularly China and India, is expected to lead market growth owing to its burgeoning manufacturing sector and increasing demand for secure packaging solutions. North America and Europe will continue to be significant markets driven by stringent regulatory requirements and high consumer expectations for product authenticity.
Holographic Tapes Company Market Share
This comprehensive report delves into the dynamic holographic tapes market, analyzing its structure, trends, competitive landscape, and future trajectory from 2019 to 2033. With a base year of 2025 and a forecast period from 2025 to 2033, this research provides invaluable insights for industry stakeholders seeking to capitalize on the growing demand for high-security, branding, and decorative holographic packaging solutions. The study covers key segments including Polypropylene (PP) Type, Polyvinyl Chloride (PVC) Type, Polyethylene (PE) Type, Polyethylene Terephthalate (PET) Type, and applications across the Food and Beverage Industry, Tobacco Industry, Pharmaceutical Industry, Personal Care and Cosmetics Industry, Electrical and Electronics Industry, and Others.
Holographic Tapes Market Structure & Competitive Dynamics
The global holographic tapes market exhibits a moderately concentrated structure, with key players investing heavily in research and development to enhance anti-counterfeiting features and aesthetic appeal. Innovation ecosystems are driven by advancements in holographic origination techniques, material science, and high-speed manufacturing processes. Regulatory frameworks, particularly concerning product authenticity and consumer safety, play a crucial role in shaping market entry and product development. While direct product substitutes are limited, alternative anti-counterfeiting measures, such as specialized inks and RFID tags, present indirect competition. End-user trends highlight a growing preference for visually striking and secure packaging, especially within the pharmaceutical, cosmetic, and food and beverage sectors. Mergers and acquisitions (M&A) activities, valued in the billions, are anticipated to consolidate the market, allowing leading companies to expand their technological capabilities and geographical reach. For instance, the acquisition of smaller specialized holographic film manufacturers by larger tape producers is a recurring theme, significantly impacting market share and overall industry consolidation. The total market value is projected to reach over one billion dollars by the end of the forecast period, with strategic M&A deals contributing a substantial portion of this valuation.
Holographic Tapes Industry Trends & Insights
The holographic tapes industry is poised for robust growth, driven by an escalating need for sophisticated anti-counterfeiting solutions and enhanced brand differentiation. The market is experiencing a significant Compound Annual Growth Rate (CAGR) of approximately xx% over the forecast period. Key growth drivers include the increasing globalization of trade, which amplifies the risk of product counterfeiting, and the growing consumer awareness and demand for authentic products, especially in the pharmaceutical and personal care industries. Technological disruptions, such as advancements in nano-structuring and laser engraving technologies, are enabling the creation of more intricate and secure holographic patterns, thereby increasing the barriers to counterfeiting. Consumer preferences are shifting towards visually appealing packaging that conveys a sense of premium quality and authenticity. This trend is particularly evident in the food and beverage and cosmetics sectors, where holographic tapes are used to enhance shelf appeal and build brand loyalty. Competitive dynamics are characterized by intense innovation, with companies continuously introducing new holographic designs, security features, and substrate combinations. The market penetration of advanced holographic tapes is steadily increasing, reaching over xx% by 2025, indicating a strong adoption rate across various end-use industries. The overall market size is projected to exceed several billion dollars by 2033, fueled by these prevailing trends and emerging opportunities. The increasing adoption of eco-friendly holographic tape solutions also presents a significant growth avenue, aligning with global sustainability initiatives.
Dominant Markets & Segments in Holographic Tapes
The holographic tapes market is experiencing dominance in specific regions and segments, driven by a confluence of economic policies, robust infrastructure, and evolving consumer demands.
Leading Region: North America and Europe currently hold a dominant position in the holographic tapes market.
- Key Drivers: Stringent regulations regarding product authenticity in the pharmaceutical and food and beverage industries, coupled with a high consumer disposable income and a well-established retail infrastructure, contribute to this dominance.
- Economic Policies: Supportive government policies promoting product security and intellectual property rights enforcement create a favorable environment for holographic tape adoption.
- Infrastructure: Advanced manufacturing and logistics infrastructure ensure efficient supply chains and widespread availability of holographic tape solutions.
Dominant Application Segment: The Food and Beverage Industry and the Pharmaceutical Industry represent the largest application segments.
- Food and Beverage Industry:
- Key Drivers: The need to combat food fraud, enhance brand visibility on crowded shelves, and provide tamper-evident seals drives significant demand. Holographic tapes add a premium appeal and perceived authenticity to a wide range of products, from confectioneries to beverages. Market penetration in this segment is projected to exceed xx% by 2025, with an estimated market value in the billions.
- Pharmaceutical Industry:
- Key Drivers: The critical importance of preventing counterfeit drugs and ensuring patient safety makes the pharmaceutical sector a primary adopter of high-security holographic tapes. These tapes offer robust tamper-evident features and verifiable authenticity, crucial for regulatory compliance. This segment's market share is expected to remain substantial, contributing significantly to the overall market size, estimated to be in the billions.
- Personal Care and Cosmetics Industry:
- Key Drivers: Brand protection against counterfeiting and the desire to create luxurious and visually appealing packaging are key drivers. Holographic elements elevate the perceived value of cosmetic products. This segment is expected to witness a CAGR of xx% during the forecast period.
- Tobacco Industry:
- Key Drivers: Government regulations mandating track-and-trace systems and anti-counterfeiting measures for tobacco products are significant growth catalysts.
- Electrical and Electronics Industry:
- Key Drivers: Protecting high-value electronic components and devices from counterfeiting and ensuring supply chain integrity are key applications.
- Others: This segment includes applications in secure documents, credit cards, and luxury goods, all contributing to market diversification.
- Food and Beverage Industry:
Dominant Type Segment: The Polypropylene (PP) Type and Polyethylene Terephthalate (PET) Type holographic tapes are leading the market.
- Polypropylene (PP) Type:
- Key Drivers: Its cost-effectiveness, excellent printability, and good tensile strength make it a popular choice for general-purpose holographic tapes, especially in the food and beverage and personal care sectors. The market size for PP type tapes is estimated to be in the billions.
- Polyethylene Terephthalate (PET) Type:
- Key Drivers: Offers superior clarity, durability, and heat resistance, making it ideal for high-security applications in pharmaceuticals and electronics. The demand for PET-based holographic tapes is projected to grow at a xx% CAGR.
- Polyvinyl Chloride (PVC) Type:
- Key Drivers: Provides good adhesion and is cost-effective, finding applications in various packaging solutions.
- Polyethylene (PE) Type:
- Key Drivers: Offers flexibility and tear resistance, suitable for certain industrial and consumer goods packaging.
- Polypropylene (PP) Type:
Holographic Tapes Product Innovations
Recent product innovations in the holographic tapes market focus on enhancing security features and expanding application versatility. Developments include the integration of advanced overt and covert security elements, such as micro-text, hidden images, and machine-readable features, making counterfeiting increasingly difficult. Novel materials and adhesive formulations are being introduced to improve durability, environmental resistance, and compatibility with diverse substrates. Furthermore, advancements in holographic origination techniques are enabling the creation of more visually stunning and dynamic holographic effects, elevating brand aesthetics. These innovations offer a competitive advantage by providing superior brand protection and enhanced consumer engagement. The market size for these innovative products is expected to reach billions within the forecast period.
Report Segmentation & Scope
This report segments the holographic tapes market across key applications and types to provide granular insights.
Application Segmentation: The report details the market dynamics for the Food and Beverage Industry, Tobacco Industry, Pharmaceutical Industry, Personal Care and Cosmetics Industry, Electrical and Electronics Industry, and Others. Each segment's growth projections, estimated market sizes in the billions, and competitive landscapes are analyzed. The Food and Beverage and Pharmaceutical industries are projected to show significant growth, with CAGRs exceeding xx%.
Type Segmentation: The analysis covers Polypropylene (PP) Type, Polyvinyl Chloride (PVC) Type, Polyethylene (PE) Type, Polyethylene Terephthalate (PET) Type, and Others. The market share and growth trajectory for each tape type are meticulously examined, with PP and PET types expected to dominate the market, contributing significantly to the overall market value in the billions.
Key Drivers of Holographic Tapes Growth
The holographic tapes market is propelled by several key drivers:
- Technological Advancement: Continuous innovation in holographic origination and security features significantly enhances anti-counterfeiting capabilities and visual appeal.
- Rising Counterfeiting Threats: The escalating global problem of product counterfeiting across industries like pharmaceuticals and electronics necessitates robust security solutions.
- Brand Protection and Differentiation: Companies are increasingly using holographic tapes to protect their brand integrity and differentiate their products on crowded retail shelves, adding a premium perception.
- Consumer Demand for Authenticity: Growing consumer awareness and preference for genuine products are driving demand for verifiable authenticity markers on packaging.
- Regulatory Compliance: Mandates and regulations in sectors like pharmaceuticals and tobacco are pushing for the adoption of advanced track-and-trace and anti-counterfeiting technologies.
Challenges in the Holographic Tapes Sector
Despite robust growth, the holographic tapes sector faces several challenges:
- High Initial Investment: The advanced technology required for producing high-quality holographic tapes can lead to significant upfront capital expenditure for manufacturers.
- Technological Obsolescence: Rapid advancements in holographic technology necessitate continuous investment in R&D to keep pace with evolving security needs and competitive offerings.
- Supply Chain Disruptions: Geopolitical factors, raw material availability, and logistics issues can impact the consistent supply of specialized holographic films and adhesives.
- Competition from Alternative Technologies: While holographic tapes offer unique benefits, other anti-counterfeiting solutions like RFID, NFC tags, and specialized inks present ongoing competitive pressure.
- Cost Sensitivity in Certain Segments: While premium segments readily adopt holographic tapes, cost-sensitive markets may opt for less sophisticated and cheaper packaging solutions. The total estimated impact of these challenges on market growth is a reduction of xx% in the projected market size if not addressed effectively.
Leading Players in the Holographic Tapes Market
- ESSENTRA
- TANN GERMANY
- Suzhou Image Laser
- OCTPAK
- Wavelock Advanced Technology
- Taibao Group
- Shanghai Okay-Packaging
- Bagla Group
- Matrix Technologies
- Mexim Adhesive Tapes
- Hira Holovision
- Guangzhou Binhao Technology
Key Developments in Holographic Tapes Sector
- 2024 (Q1): Wavelock Advanced Technology launched a new series of high-security holographic tapes with integrated covert features for the pharmaceutical industry.
- 2023 (Q4): ESSENTRA acquired a specialized holographic film manufacturer, expanding its production capacity and technological portfolio.
- 2023 (Q2): Suzhou Image Laser introduced cost-effective holographic label solutions targeting small and medium-sized enterprises.
- 2022 (Q3): Taibao Group invested in advanced laser engraving technology to enhance the complexity and security of their holographic tape designs.
- 2022 (Q1): OCTPAK developed eco-friendly, biodegradable holographic tapes to cater to growing sustainability demands.
Strategic Holographic Tapes Market Outlook
The holographic tapes market presents a promising outlook, driven by sustained demand for advanced security and branding solutions. Growth accelerators include the ongoing digitalization of supply chains, which amplifies the need for verifiable product authenticity, and the increasing adoption of customized and high-impact holographic designs by brands seeking to enhance consumer engagement. Strategic opportunities lie in the development of smart holographic tapes with embedded IoT functionalities for real-time tracking and authentication. Furthermore, expansion into emerging markets with a growing middle class and increasing concerns about counterfeiting will offer significant growth potential. The market is projected to witness a sustained growth trajectory, with strategic investments in innovation and market penetration key to long-term success, potentially reaching several billion dollars in value.
Holographic Tapes Segmentation
-
1. Application
- 1.1. Food and Beverage Industry
- 1.2. Tobacco Industry
- 1.3. Pharmaceutical Industry
- 1.4. Personal Care and Cosmetics Industry
- 1.5. Electrical and Electronics Industry
- 1.6. Others
-
2. Types
- 2.1. Polypropylene (PP) Type
- 2.2. Polyvinyl Chloride (PVC) Type
- 2.3. Polyethylene (PE) Type
- 2.4. Polyethylene Terephthalate (PET) Type
- 2.5. Others
Holographic Tapes Segmentation By Geography
-
1. North America
- 1.1. United States
- 1.2. Canada
- 1.3. Mexico
-
2. South America
- 2.1. Brazil
- 2.2. Argentina
- 2.3. Rest of South America
-
3. Europe
- 3.1. United Kingdom
- 3.2. Germany
- 3.3. France
- 3.4. Italy
- 3.5. Spain
- 3.6. Russia
- 3.7. Benelux
- 3.8. Nordics
- 3.9. Rest of Europe
-
4. Middle East & Africa
- 4.1. Turkey
- 4.2. Israel
- 4.3. GCC
- 4.4. North Africa
- 4.5. South Africa
- 4.6. Rest of Middle East & Africa
-
5. Asia Pacific
- 5.1. China
- 5.2. India
- 5.3. Japan
- 5.4. South Korea
- 5.5. ASEAN
- 5.6. Oceania
- 5.7. Rest of Asia Pacific
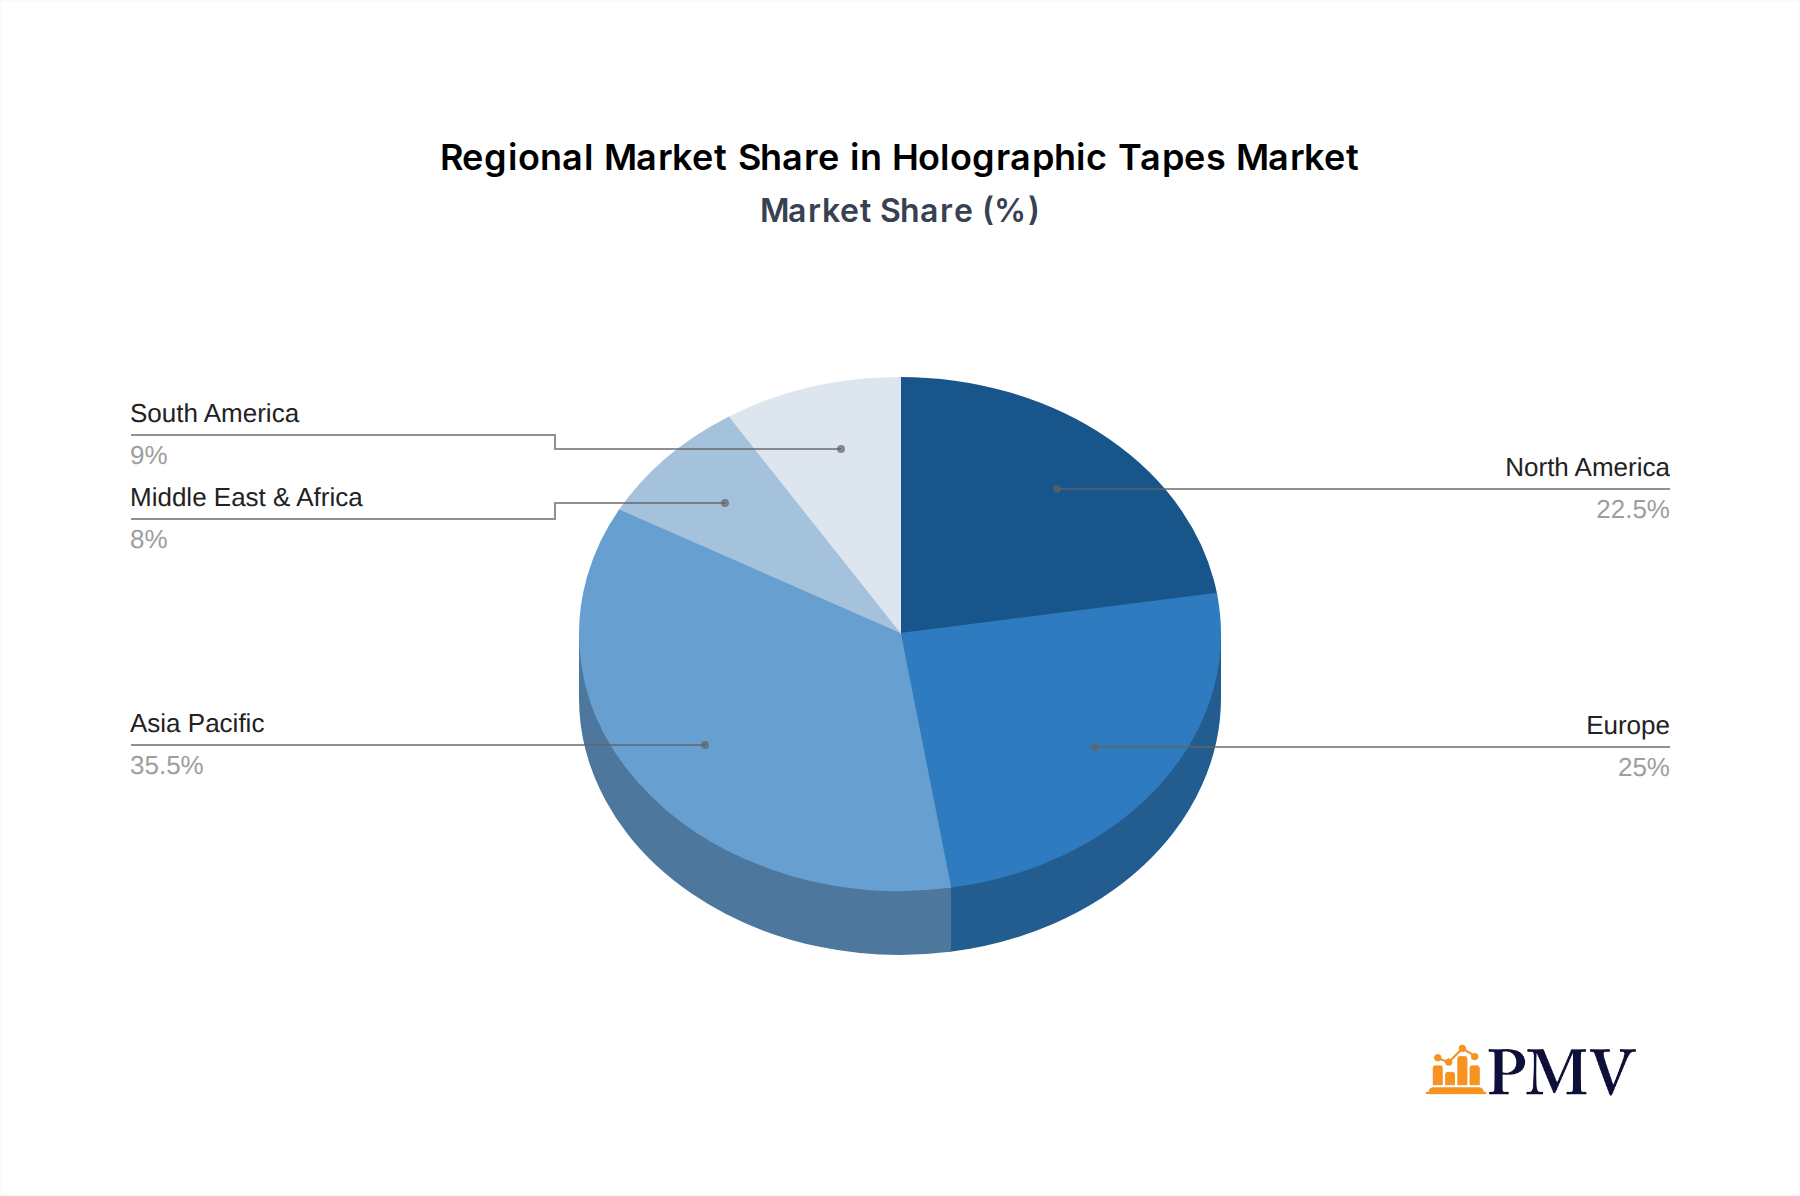
Holographic Tapes Regional Market Share
Geographic Coverage of Holographic Tapes
Holographic Tapes REPORT HIGHLIGHTS
| Aspects | Details |
|---|---|
| Study Period | 2020-2034 |
| Base Year | 2025 |
| Estimated Year | 2026 |
| Forecast Period | 2026-2034 |
| Historical Period | 2020-2025 |
| Growth Rate | CAGR of 25.2% from 2020-2034 |
| Segmentation |
|
Table of Contents
- 1. Introduction
- 1.1. Research Scope
- 1.2. Market Segmentation
- 1.3. Research Objective
- 1.4. Definitions and Assumptions
- 2. Executive Summary
- 2.1. Market Snapshot
- 3. Market Dynamics
- 3.1. Market Drivers
- 3.2. Market Restrains
- 3.3. Market Trends
- 3.4. Market Opportunities
- 4. Market Factor Analysis
- 4.1. Porters Five Forces
- 4.1.1. Bargaining Power of Suppliers
- 4.1.2. Bargaining Power of Buyers
- 4.1.3. Threat of New Entrants
- 4.1.4. Threat of Substitutes
- 4.1.5. Competitive Rivalry
- 4.2. PESTEL analysis
- 4.3. BCG Analysis
- 4.3.1. Stars (High Growth, High Market Share)
- 4.3.2. Cash Cows (Low Growth, High Market Share)
- 4.3.3. Question Mark (High Growth, Low Market Share)
- 4.3.4. Dogs (Low Growth, Low Market Share)
- 4.4. Ansoff Matrix Analysis
- 4.5. Supply Chain Analysis
- 4.6. Regulatory Landscape
- 4.7. Current Market Potential and Opportunity Assessment (TAM–SAM–SOM Framework)
- 4.8. PMV Analyst Note
- 4.1. Porters Five Forces
- 5. Market Analysis, Insights and Forecast 2021-2033
- 5.1. Market Analysis, Insights and Forecast - by Application
- 5.1.1. Food and Beverage Industry
- 5.1.2. Tobacco Industry
- 5.1.3. Pharmaceutical Industry
- 5.1.4. Personal Care and Cosmetics Industry
- 5.1.5. Electrical and Electronics Industry
- 5.1.6. Others
- 5.2. Market Analysis, Insights and Forecast - by Types
- 5.2.1. Polypropylene (PP) Type
- 5.2.2. Polyvinyl Chloride (PVC) Type
- 5.2.3. Polyethylene (PE) Type
- 5.2.4. Polyethylene Terephthalate (PET) Type
- 5.2.5. Others
- 5.3. Market Analysis, Insights and Forecast - by Region
- 5.3.1. North America
- 5.3.2. South America
- 5.3.3. Europe
- 5.3.4. Middle East & Africa
- 5.3.5. Asia Pacific
- 5.1. Market Analysis, Insights and Forecast - by Application
- 6. Global Holographic Tapes Analysis, Insights and Forecast, 2021-2033
- 6.1. Market Analysis, Insights and Forecast - by Application
- 6.1.1. Food and Beverage Industry
- 6.1.2. Tobacco Industry
- 6.1.3. Pharmaceutical Industry
- 6.1.4. Personal Care and Cosmetics Industry
- 6.1.5. Electrical and Electronics Industry
- 6.1.6. Others
- 6.2. Market Analysis, Insights and Forecast - by Types
- 6.2.1. Polypropylene (PP) Type
- 6.2.2. Polyvinyl Chloride (PVC) Type
- 6.2.3. Polyethylene (PE) Type
- 6.2.4. Polyethylene Terephthalate (PET) Type
- 6.2.5. Others
- 6.1. Market Analysis, Insights and Forecast - by Application
- 7. North America Holographic Tapes Analysis, Insights and Forecast, 2020-2032
- 7.1. Market Analysis, Insights and Forecast - by Application
- 7.1.1. Food and Beverage Industry
- 7.1.2. Tobacco Industry
- 7.1.3. Pharmaceutical Industry
- 7.1.4. Personal Care and Cosmetics Industry
- 7.1.5. Electrical and Electronics Industry
- 7.1.6. Others
- 7.2. Market Analysis, Insights and Forecast - by Types
- 7.2.1. Polypropylene (PP) Type
- 7.2.2. Polyvinyl Chloride (PVC) Type
- 7.2.3. Polyethylene (PE) Type
- 7.2.4. Polyethylene Terephthalate (PET) Type
- 7.2.5. Others
- 7.1. Market Analysis, Insights and Forecast - by Application
- 8. South America Holographic Tapes Analysis, Insights and Forecast, 2020-2032
- 8.1. Market Analysis, Insights and Forecast - by Application
- 8.1.1. Food and Beverage Industry
- 8.1.2. Tobacco Industry
- 8.1.3. Pharmaceutical Industry
- 8.1.4. Personal Care and Cosmetics Industry
- 8.1.5. Electrical and Electronics Industry
- 8.1.6. Others
- 8.2. Market Analysis, Insights and Forecast - by Types
- 8.2.1. Polypropylene (PP) Type
- 8.2.2. Polyvinyl Chloride (PVC) Type
- 8.2.3. Polyethylene (PE) Type
- 8.2.4. Polyethylene Terephthalate (PET) Type
- 8.2.5. Others
- 8.1. Market Analysis, Insights and Forecast - by Application
- 9. Europe Holographic Tapes Analysis, Insights and Forecast, 2020-2032
- 9.1. Market Analysis, Insights and Forecast - by Application
- 9.1.1. Food and Beverage Industry
- 9.1.2. Tobacco Industry
- 9.1.3. Pharmaceutical Industry
- 9.1.4. Personal Care and Cosmetics Industry
- 9.1.5. Electrical and Electronics Industry
- 9.1.6. Others
- 9.2. Market Analysis, Insights and Forecast - by Types
- 9.2.1. Polypropylene (PP) Type
- 9.2.2. Polyvinyl Chloride (PVC) Type
- 9.2.3. Polyethylene (PE) Type
- 9.2.4. Polyethylene Terephthalate (PET) Type
- 9.2.5. Others
- 9.1. Market Analysis, Insights and Forecast - by Application
- 10. Middle East & Africa Holographic Tapes Analysis, Insights and Forecast, 2020-2032
- 10.1. Market Analysis, Insights and Forecast - by Application
- 10.1.1. Food and Beverage Industry
- 10.1.2. Tobacco Industry
- 10.1.3. Pharmaceutical Industry
- 10.1.4. Personal Care and Cosmetics Industry
- 10.1.5. Electrical and Electronics Industry
- 10.1.6. Others
- 10.2. Market Analysis, Insights and Forecast - by Types
- 10.2.1. Polypropylene (PP) Type
- 10.2.2. Polyvinyl Chloride (PVC) Type
- 10.2.3. Polyethylene (PE) Type
- 10.2.4. Polyethylene Terephthalate (PET) Type
- 10.2.5. Others
- 10.1. Market Analysis, Insights and Forecast - by Application
- 11. Asia Pacific Holographic Tapes Analysis, Insights and Forecast, 2020-2032
- 11.1. Market Analysis, Insights and Forecast - by Application
- 11.1.1. Food and Beverage Industry
- 11.1.2. Tobacco Industry
- 11.1.3. Pharmaceutical Industry
- 11.1.4. Personal Care and Cosmetics Industry
- 11.1.5. Electrical and Electronics Industry
- 11.1.6. Others
- 11.2. Market Analysis, Insights and Forecast - by Types
- 11.2.1. Polypropylene (PP) Type
- 11.2.2. Polyvinyl Chloride (PVC) Type
- 11.2.3. Polyethylene (PE) Type
- 11.2.4. Polyethylene Terephthalate (PET) Type
- 11.2.5. Others
- 11.1. Market Analysis, Insights and Forecast - by Application
- 12. Competitive Analysis
- 12.1. Company Profiles
- 12.1.1 ESSENTRA
- 12.1.1.1. Company Overview
- 12.1.1.2. Products
- 12.1.1.3. Company Financials
- 12.1.1.4. SWOT Analysis
- 12.1.2 TANN GERMANY
- 12.1.2.1. Company Overview
- 12.1.2.2. Products
- 12.1.2.3. Company Financials
- 12.1.2.4. SWOT Analysis
- 12.1.3 Suzhou Image Laser
- 12.1.3.1. Company Overview
- 12.1.3.2. Products
- 12.1.3.3. Company Financials
- 12.1.3.4. SWOT Analysis
- 12.1.4 OCTPAK
- 12.1.4.1. Company Overview
- 12.1.4.2. Products
- 12.1.4.3. Company Financials
- 12.1.4.4. SWOT Analysis
- 12.1.5 Wavelock Advanced Technology
- 12.1.5.1. Company Overview
- 12.1.5.2. Products
- 12.1.5.3. Company Financials
- 12.1.5.4. SWOT Analysis
- 12.1.6 Taibao Group
- 12.1.6.1. Company Overview
- 12.1.6.2. Products
- 12.1.6.3. Company Financials
- 12.1.6.4. SWOT Analysis
- 12.1.7 Shanghai Okay-Packaging
- 12.1.7.1. Company Overview
- 12.1.7.2. Products
- 12.1.7.3. Company Financials
- 12.1.7.4. SWOT Analysis
- 12.1.8 Bagla Group
- 12.1.8.1. Company Overview
- 12.1.8.2. Products
- 12.1.8.3. Company Financials
- 12.1.8.4. SWOT Analysis
- 12.1.9 Matrix Technologies
- 12.1.9.1. Company Overview
- 12.1.9.2. Products
- 12.1.9.3. Company Financials
- 12.1.9.4. SWOT Analysis
- 12.1.10 Mexim Adhesive Tapes
- 12.1.10.1. Company Overview
- 12.1.10.2. Products
- 12.1.10.3. Company Financials
- 12.1.10.4. SWOT Analysis
- 12.1.11 Hira Holovision
- 12.1.11.1. Company Overview
- 12.1.11.2. Products
- 12.1.11.3. Company Financials
- 12.1.11.4. SWOT Analysis
- 12.1.12 Guangzhou Binhao Technology
- 12.1.12.1. Company Overview
- 12.1.12.2. Products
- 12.1.12.3. Company Financials
- 12.1.12.4. SWOT Analysis
- 12.1.1 ESSENTRA
- 12.2. Market Entropy
- 12.2.1 Company's Key Areas Served
- 12.2.2 Recent Developments
- 12.3. Company Market Share Analysis 2025
- 12.3.1 Top 5 Companies Market Share Analysis
- 12.3.2 Top 3 Companies Market Share Analysis
- 12.4. List of Potential Customers
- 13. Research Methodology
List of Figures
- Figure 1: Global Holographic Tapes Revenue Breakdown (undefined, %) by Region 2025 & 2033
- Figure 2: Global Holographic Tapes Volume Breakdown (K, %) by Region 2025 & 2033
- Figure 3: North America Holographic Tapes Revenue (undefined), by Application 2025 & 2033
- Figure 4: North America Holographic Tapes Volume (K), by Application 2025 & 2033
- Figure 5: North America Holographic Tapes Revenue Share (%), by Application 2025 & 2033
- Figure 6: North America Holographic Tapes Volume Share (%), by Application 2025 & 2033
- Figure 7: North America Holographic Tapes Revenue (undefined), by Types 2025 & 2033
- Figure 8: North America Holographic Tapes Volume (K), by Types 2025 & 2033
- Figure 9: North America Holographic Tapes Revenue Share (%), by Types 2025 & 2033
- Figure 10: North America Holographic Tapes Volume Share (%), by Types 2025 & 2033
- Figure 11: North America Holographic Tapes Revenue (undefined), by Country 2025 & 2033
- Figure 12: North America Holographic Tapes Volume (K), by Country 2025 & 2033
- Figure 13: North America Holographic Tapes Revenue Share (%), by Country 2025 & 2033
- Figure 14: North America Holographic Tapes Volume Share (%), by Country 2025 & 2033
- Figure 15: South America Holographic Tapes Revenue (undefined), by Application 2025 & 2033
- Figure 16: South America Holographic Tapes Volume (K), by Application 2025 & 2033
- Figure 17: South America Holographic Tapes Revenue Share (%), by Application 2025 & 2033
- Figure 18: South America Holographic Tapes Volume Share (%), by Application 2025 & 2033
- Figure 19: South America Holographic Tapes Revenue (undefined), by Types 2025 & 2033
- Figure 20: South America Holographic Tapes Volume (K), by Types 2025 & 2033
- Figure 21: South America Holographic Tapes Revenue Share (%), by Types 2025 & 2033
- Figure 22: South America Holographic Tapes Volume Share (%), by Types 2025 & 2033
- Figure 23: South America Holographic Tapes Revenue (undefined), by Country 2025 & 2033
- Figure 24: South America Holographic Tapes Volume (K), by Country 2025 & 2033
- Figure 25: South America Holographic Tapes Revenue Share (%), by Country 2025 & 2033
- Figure 26: South America Holographic Tapes Volume Share (%), by Country 2025 & 2033
- Figure 27: Europe Holographic Tapes Revenue (undefined), by Application 2025 & 2033
- Figure 28: Europe Holographic Tapes Volume (K), by Application 2025 & 2033
- Figure 29: Europe Holographic Tapes Revenue Share (%), by Application 2025 & 2033
- Figure 30: Europe Holographic Tapes Volume Share (%), by Application 2025 & 2033
- Figure 31: Europe Holographic Tapes Revenue (undefined), by Types 2025 & 2033
- Figure 32: Europe Holographic Tapes Volume (K), by Types 2025 & 2033
- Figure 33: Europe Holographic Tapes Revenue Share (%), by Types 2025 & 2033
- Figure 34: Europe Holographic Tapes Volume Share (%), by Types 2025 & 2033
- Figure 35: Europe Holographic Tapes Revenue (undefined), by Country 2025 & 2033
- Figure 36: Europe Holographic Tapes Volume (K), by Country 2025 & 2033
- Figure 37: Europe Holographic Tapes Revenue Share (%), by Country 2025 & 2033
- Figure 38: Europe Holographic Tapes Volume Share (%), by Country 2025 & 2033
- Figure 39: Middle East & Africa Holographic Tapes Revenue (undefined), by Application 2025 & 2033
- Figure 40: Middle East & Africa Holographic Tapes Volume (K), by Application 2025 & 2033
- Figure 41: Middle East & Africa Holographic Tapes Revenue Share (%), by Application 2025 & 2033
- Figure 42: Middle East & Africa Holographic Tapes Volume Share (%), by Application 2025 & 2033
- Figure 43: Middle East & Africa Holographic Tapes Revenue (undefined), by Types 2025 & 2033
- Figure 44: Middle East & Africa Holographic Tapes Volume (K), by Types 2025 & 2033
- Figure 45: Middle East & Africa Holographic Tapes Revenue Share (%), by Types 2025 & 2033
- Figure 46: Middle East & Africa Holographic Tapes Volume Share (%), by Types 2025 & 2033
- Figure 47: Middle East & Africa Holographic Tapes Revenue (undefined), by Country 2025 & 2033
- Figure 48: Middle East & Africa Holographic Tapes Volume (K), by Country 2025 & 2033
- Figure 49: Middle East & Africa Holographic Tapes Revenue Share (%), by Country 2025 & 2033
- Figure 50: Middle East & Africa Holographic Tapes Volume Share (%), by Country 2025 & 2033
- Figure 51: Asia Pacific Holographic Tapes Revenue (undefined), by Application 2025 & 2033
- Figure 52: Asia Pacific Holographic Tapes Volume (K), by Application 2025 & 2033
- Figure 53: Asia Pacific Holographic Tapes Revenue Share (%), by Application 2025 & 2033
- Figure 54: Asia Pacific Holographic Tapes Volume Share (%), by Application 2025 & 2033
- Figure 55: Asia Pacific Holographic Tapes Revenue (undefined), by Types 2025 & 2033
- Figure 56: Asia Pacific Holographic Tapes Volume (K), by Types 2025 & 2033
- Figure 57: Asia Pacific Holographic Tapes Revenue Share (%), by Types 2025 & 2033
- Figure 58: Asia Pacific Holographic Tapes Volume Share (%), by Types 2025 & 2033
- Figure 59: Asia Pacific Holographic Tapes Revenue (undefined), by Country 2025 & 2033
- Figure 60: Asia Pacific Holographic Tapes Volume (K), by Country 2025 & 2033
- Figure 61: Asia Pacific Holographic Tapes Revenue Share (%), by Country 2025 & 2033
- Figure 62: Asia Pacific Holographic Tapes Volume Share (%), by Country 2025 & 2033
List of Tables
- Table 1: Global Holographic Tapes Revenue undefined Forecast, by Application 2020 & 2033
- Table 2: Global Holographic Tapes Volume K Forecast, by Application 2020 & 2033
- Table 3: Global Holographic Tapes Revenue undefined Forecast, by Types 2020 & 2033
- Table 4: Global Holographic Tapes Volume K Forecast, by Types 2020 & 2033
- Table 5: Global Holographic Tapes Revenue undefined Forecast, by Region 2020 & 2033
- Table 6: Global Holographic Tapes Volume K Forecast, by Region 2020 & 2033
- Table 7: Global Holographic Tapes Revenue undefined Forecast, by Application 2020 & 2033
- Table 8: Global Holographic Tapes Volume K Forecast, by Application 2020 & 2033
- Table 9: Global Holographic Tapes Revenue undefined Forecast, by Types 2020 & 2033
- Table 10: Global Holographic Tapes Volume K Forecast, by Types 2020 & 2033
- Table 11: Global Holographic Tapes Revenue undefined Forecast, by Country 2020 & 2033
- Table 12: Global Holographic Tapes Volume K Forecast, by Country 2020 & 2033
- Table 13: United States Holographic Tapes Revenue (undefined) Forecast, by Application 2020 & 2033
- Table 14: United States Holographic Tapes Volume (K) Forecast, by Application 2020 & 2033
- Table 15: Canada Holographic Tapes Revenue (undefined) Forecast, by Application 2020 & 2033
- Table 16: Canada Holographic Tapes Volume (K) Forecast, by Application 2020 & 2033
- Table 17: Mexico Holographic Tapes Revenue (undefined) Forecast, by Application 2020 & 2033
- Table 18: Mexico Holographic Tapes Volume (K) Forecast, by Application 2020 & 2033
- Table 19: Global Holographic Tapes Revenue undefined Forecast, by Application 2020 & 2033
- Table 20: Global Holographic Tapes Volume K Forecast, by Application 2020 & 2033
- Table 21: Global Holographic Tapes Revenue undefined Forecast, by Types 2020 & 2033
- Table 22: Global Holographic Tapes Volume K Forecast, by Types 2020 & 2033
- Table 23: Global Holographic Tapes Revenue undefined Forecast, by Country 2020 & 2033
- Table 24: Global Holographic Tapes Volume K Forecast, by Country 2020 & 2033
- Table 25: Brazil Holographic Tapes Revenue (undefined) Forecast, by Application 2020 & 2033
- Table 26: Brazil Holographic Tapes Volume (K) Forecast, by Application 2020 & 2033
- Table 27: Argentina Holographic Tapes Revenue (undefined) Forecast, by Application 2020 & 2033
- Table 28: Argentina Holographic Tapes Volume (K) Forecast, by Application 2020 & 2033
- Table 29: Rest of South America Holographic Tapes Revenue (undefined) Forecast, by Application 2020 & 2033
- Table 30: Rest of South America Holographic Tapes Volume (K) Forecast, by Application 2020 & 2033
- Table 31: Global Holographic Tapes Revenue undefined Forecast, by Application 2020 & 2033
- Table 32: Global Holographic Tapes Volume K Forecast, by Application 2020 & 2033
- Table 33: Global Holographic Tapes Revenue undefined Forecast, by Types 2020 & 2033
- Table 34: Global Holographic Tapes Volume K Forecast, by Types 2020 & 2033
- Table 35: Global Holographic Tapes Revenue undefined Forecast, by Country 2020 & 2033
- Table 36: Global Holographic Tapes Volume K Forecast, by Country 2020 & 2033
- Table 37: United Kingdom Holographic Tapes Revenue (undefined) Forecast, by Application 2020 & 2033
- Table 38: United Kingdom Holographic Tapes Volume (K) Forecast, by Application 2020 & 2033
- Table 39: Germany Holographic Tapes Revenue (undefined) Forecast, by Application 2020 & 2033
- Table 40: Germany Holographic Tapes Volume (K) Forecast, by Application 2020 & 2033
- Table 41: France Holographic Tapes Revenue (undefined) Forecast, by Application 2020 & 2033
- Table 42: France Holographic Tapes Volume (K) Forecast, by Application 2020 & 2033
- Table 43: Italy Holographic Tapes Revenue (undefined) Forecast, by Application 2020 & 2033
- Table 44: Italy Holographic Tapes Volume (K) Forecast, by Application 2020 & 2033
- Table 45: Spain Holographic Tapes Revenue (undefined) Forecast, by Application 2020 & 2033
- Table 46: Spain Holographic Tapes Volume (K) Forecast, by Application 2020 & 2033
- Table 47: Russia Holographic Tapes Revenue (undefined) Forecast, by Application 2020 & 2033
- Table 48: Russia Holographic Tapes Volume (K) Forecast, by Application 2020 & 2033
- Table 49: Benelux Holographic Tapes Revenue (undefined) Forecast, by Application 2020 & 2033
- Table 50: Benelux Holographic Tapes Volume (K) Forecast, by Application 2020 & 2033
- Table 51: Nordics Holographic Tapes Revenue (undefined) Forecast, by Application 2020 & 2033
- Table 52: Nordics Holographic Tapes Volume (K) Forecast, by Application 2020 & 2033
- Table 53: Rest of Europe Holographic Tapes Revenue (undefined) Forecast, by Application 2020 & 2033
- Table 54: Rest of Europe Holographic Tapes Volume (K) Forecast, by Application 2020 & 2033
- Table 55: Global Holographic Tapes Revenue undefined Forecast, by Application 2020 & 2033
- Table 56: Global Holographic Tapes Volume K Forecast, by Application 2020 & 2033
- Table 57: Global Holographic Tapes Revenue undefined Forecast, by Types 2020 & 2033
- Table 58: Global Holographic Tapes Volume K Forecast, by Types 2020 & 2033
- Table 59: Global Holographic Tapes Revenue undefined Forecast, by Country 2020 & 2033
- Table 60: Global Holographic Tapes Volume K Forecast, by Country 2020 & 2033
- Table 61: Turkey Holographic Tapes Revenue (undefined) Forecast, by Application 2020 & 2033
- Table 62: Turkey Holographic Tapes Volume (K) Forecast, by Application 2020 & 2033
- Table 63: Israel Holographic Tapes Revenue (undefined) Forecast, by Application 2020 & 2033
- Table 64: Israel Holographic Tapes Volume (K) Forecast, by Application 2020 & 2033
- Table 65: GCC Holographic Tapes Revenue (undefined) Forecast, by Application 2020 & 2033
- Table 66: GCC Holographic Tapes Volume (K) Forecast, by Application 2020 & 2033
- Table 67: North Africa Holographic Tapes Revenue (undefined) Forecast, by Application 2020 & 2033
- Table 68: North Africa Holographic Tapes Volume (K) Forecast, by Application 2020 & 2033
- Table 69: South Africa Holographic Tapes Revenue (undefined) Forecast, by Application 2020 & 2033
- Table 70: South Africa Holographic Tapes Volume (K) Forecast, by Application 2020 & 2033
- Table 71: Rest of Middle East & Africa Holographic Tapes Revenue (undefined) Forecast, by Application 2020 & 2033
- Table 72: Rest of Middle East & Africa Holographic Tapes Volume (K) Forecast, by Application 2020 & 2033
- Table 73: Global Holographic Tapes Revenue undefined Forecast, by Application 2020 & 2033
- Table 74: Global Holographic Tapes Volume K Forecast, by Application 2020 & 2033
- Table 75: Global Holographic Tapes Revenue undefined Forecast, by Types 2020 & 2033
- Table 76: Global Holographic Tapes Volume K Forecast, by Types 2020 & 2033
- Table 77: Global Holographic Tapes Revenue undefined Forecast, by Country 2020 & 2033
- Table 78: Global Holographic Tapes Volume K Forecast, by Country 2020 & 2033
- Table 79: China Holographic Tapes Revenue (undefined) Forecast, by Application 2020 & 2033
- Table 80: China Holographic Tapes Volume (K) Forecast, by Application 2020 & 2033
- Table 81: India Holographic Tapes Revenue (undefined) Forecast, by Application 2020 & 2033
- Table 82: India Holographic Tapes Volume (K) Forecast, by Application 2020 & 2033
- Table 83: Japan Holographic Tapes Revenue (undefined) Forecast, by Application 2020 & 2033
- Table 84: Japan Holographic Tapes Volume (K) Forecast, by Application 2020 & 2033
- Table 85: South Korea Holographic Tapes Revenue (undefined) Forecast, by Application 2020 & 2033
- Table 86: South Korea Holographic Tapes Volume (K) Forecast, by Application 2020 & 2033
- Table 87: ASEAN Holographic Tapes Revenue (undefined) Forecast, by Application 2020 & 2033
- Table 88: ASEAN Holographic Tapes Volume (K) Forecast, by Application 2020 & 2033
- Table 89: Oceania Holographic Tapes Revenue (undefined) Forecast, by Application 2020 & 2033
- Table 90: Oceania Holographic Tapes Volume (K) Forecast, by Application 2020 & 2033
- Table 91: Rest of Asia Pacific Holographic Tapes Revenue (undefined) Forecast, by Application 2020 & 2033
- Table 92: Rest of Asia Pacific Holographic Tapes Volume (K) Forecast, by Application 2020 & 2033
Frequently Asked Questions
1. What is the projected Compound Annual Growth Rate (CAGR) of the Holographic Tapes?
The projected CAGR is approximately 25.2%.
2. Which companies are prominent players in the Holographic Tapes?
Key companies in the market include ESSENTRA, TANN GERMANY, Suzhou Image Laser, OCTPAK, Wavelock Advanced Technology, Taibao Group, Shanghai Okay-Packaging, Bagla Group, Matrix Technologies, Mexim Adhesive Tapes, Hira Holovision, Guangzhou Binhao Technology.
3. What are the main segments of the Holographic Tapes?
The market segments include Application, Types.
4. Can you provide details about the market size?
The market size is estimated to be USD XXX N/A as of 2022.
5. What are some drivers contributing to market growth?
N/A
6. What are the notable trends driving market growth?
N/A
7. Are there any restraints impacting market growth?
N/A
8. Can you provide examples of recent developments in the market?
N/A
9. What pricing options are available for accessing the report?
Pricing options include single-user, multi-user, and enterprise licenses priced at USD 3950.00, USD 5925.00, and USD 7900.00 respectively.
10. Is the market size provided in terms of value or volume?
The market size is provided in terms of value, measured in N/A and volume, measured in K.
11. Are there any specific market keywords associated with the report?
Yes, the market keyword associated with the report is "Holographic Tapes," which aids in identifying and referencing the specific market segment covered.
12. How do I determine which pricing option suits my needs best?
The pricing options vary based on user requirements and access needs. Individual users may opt for single-user licenses, while businesses requiring broader access may choose multi-user or enterprise licenses for cost-effective access to the report.
13. Are there any additional resources or data provided in the Holographic Tapes report?
While the report offers comprehensive insights, it's advisable to review the specific contents or supplementary materials provided to ascertain if additional resources or data are available.
14. How can I stay updated on further developments or reports in the Holographic Tapes?
To stay informed about further developments, trends, and reports in the Holographic Tapes, consider subscribing to industry newsletters, following relevant companies and organizations, or regularly checking reputable industry news sources and publications.
Methodology
Step 1 - Identification of Relevant Samples Size from Population Database


Step 2 - Approaches for Defining Global Market Size (Value, Volume* & Price*)

Note*: In applicable scenarios
Step 3 - Data Sources
Primary Research
- Web Analytics
- Survey Reports
- Research Institute
- Latest Research Reports
- Opinion Leaders
Secondary Research
- Annual Reports
- White Paper
- Latest Press Release
- Industry Association
- Paid Database
- Investor Presentations

Step 4 - Data Triangulation
Involves using different sources of information in order to increase the validity of a study
These sources are likely to be stakeholders in a program - participants, other researchers, program staff, other community members, and so on.
Then we put all data in single framework & apply various statistical tools to find out the dynamic on the market.
During the analysis stage, feedback from the stakeholder groups would be compared to determine areas of agreement as well as areas of divergence