
Key Insights
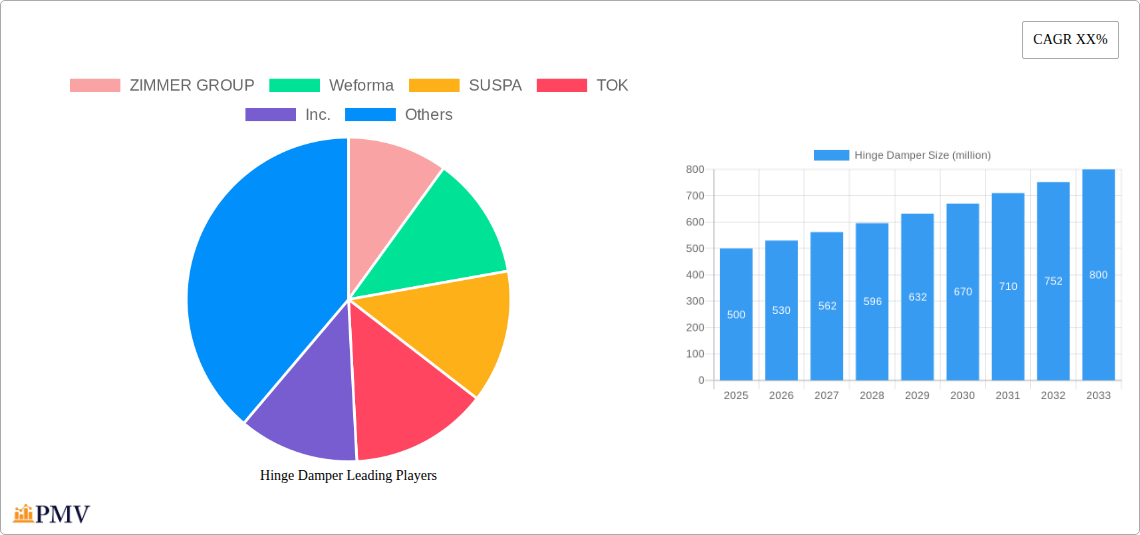
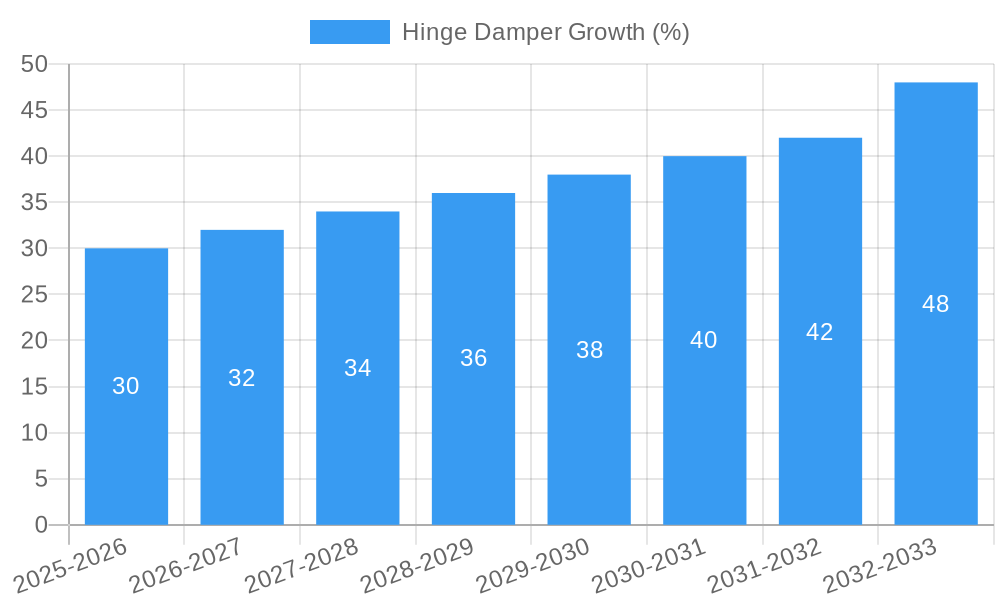
The global hinge damper market is experiencing robust growth, driven by increasing demand across diverse sectors. The market's expansion is fueled by several key factors, including the rising adoption of hinge dampers in furniture manufacturing for enhanced user experience and durability. The automotive industry also contributes significantly, with hinge dampers improving safety and performance in vehicle doors and hoods. Furthermore, the electronics and appliances sector leverages these dampers for smoother operation and longer product lifespans. Technological advancements leading to lighter, more efficient, and customizable hinge dampers are further stimulating market growth. We estimate the market size in 2025 to be around $500 million, considering average growth rates in similar component markets. A projected CAGR of 6% from 2025-2033 indicates a significant expansion to approximately $800 million by 2033. This growth is expected despite restraints such as fluctuating raw material prices and potential supply chain disruptions. However, the consistent demand from various sectors and continuous innovation in damper design and materials will likely outweigh these challenges.
The competitive landscape is characterized by a mix of established players and emerging companies. Key players like Zimmer Group, SUSPA, and Blum dominate the market with their extensive product portfolios and global distribution networks. However, smaller companies are also gaining traction, driven by specialization in niche applications and innovative product offerings. Regional market analysis reveals a relatively balanced distribution across North America, Europe, and Asia-Pacific, with potential for stronger growth in developing economies as consumer spending and industrialization increase. Continued market penetration strategies, along with focused research and development, will be critical for companies to maintain their competitive edge in this growing market. Future growth will be heavily influenced by the development of sustainable and environmentally friendly materials and manufacturing processes.
This comprehensive report provides an in-depth analysis of the global hinge damper market, offering valuable insights into market dynamics, competitive landscape, and future growth prospects. The study period covers 2019-2033, with 2025 as the base and estimated year. The forecast period spans 2025-2033, while the historical period encompasses 2019-2024. This report is crucial for businesses, investors, and researchers seeking to understand and capitalize on the opportunities within this dynamic market. The market is valued at $xx million in 2025 and is projected to reach $xx million by 2033, exhibiting a CAGR of xx%.
Hinge Damper Market Structure & Competitive Dynamics
The global hinge damper market exhibits a moderately concentrated structure, with a few key players holding significant market share. The market share distribution among top players like ZIMMER GROUP, SUSPA, and TOK, Inc. is estimated to be xx%, xx%, and xx% respectively in 2025. Innovation ecosystems are actively evolving, driven by advancements in materials science and precision engineering. Regulatory frameworks vary across regions, influencing product design and safety standards. The industry faces competition from alternative damping solutions, but hinge dampers maintain a strong position due to their versatility and cost-effectiveness. M&A activities in the sector have been moderate, with a total deal value of approximately $xx million recorded between 2019 and 2024. Key activities include strategic acquisitions focused on expanding product portfolios and geographical reach.
- Market Concentration: Moderately concentrated.
- Innovation: Driven by material science and precision engineering.
- Regulatory Landscape: Varies regionally, impacting product design.
- Product Substitutes: Presence of alternative damping technologies.
- End-User Trends: Increasing demand from automotive, furniture, and industrial automation sectors.
- M&A Activity: Moderate activity with a total deal value of approximately $xx million (2019-2024).
Hinge Damper Industry Trends & Insights
The hinge damper market is experiencing significant growth, driven by increasing demand across diverse sectors. The automotive industry’s adoption of advanced driver-assistance systems (ADAS) is a primary growth driver, alongside the expanding furniture and appliance markets. Technological disruptions, including the introduction of smart dampers and improved material compositions, are enhancing product performance and creating new applications. Consumer preferences lean towards durable, aesthetically pleasing, and quieter dampers. Intense competition is pushing manufacturers to innovate and offer customized solutions, leading to market fragmentation. The market penetration of advanced damper technologies, such as electromagnetic dampers, is gradually increasing, driven by enhanced performance and functionalities. The market is expected to exhibit a CAGR of xx% during the forecast period.
Dominant Markets & Segments in Hinge Damper
The Asia-Pacific region currently dominates the hinge damper market, driven by robust economic growth, expanding manufacturing sectors, and increased disposable incomes. China and India are key contributors to this regional dominance.
- Key Drivers in Asia-Pacific:
- Rapid industrialization and urbanization.
- Growing automotive and furniture industries.
- Favorable government policies supporting manufacturing.
- Increasing investment in infrastructure projects.
The dominance of Asia-Pacific stems from its large and rapidly growing consumer base, coupled with a substantial manufacturing industry that requires high volumes of hinge dampers. Furthermore, supportive government policies and significant investments in infrastructure projects contribute to market growth. European and North American markets are also significant, albeit with slower growth rates compared to Asia-Pacific.
Hinge Damper Product Innovations
Recent innovations focus on improving damping performance, reducing noise, and enhancing durability. Materials science advancements have led to the development of lighter, more efficient, and environmentally friendly dampers. Integration with smart technologies enables real-time monitoring and control of damping forces, opening up new applications in automation and robotics. These innovations create competitive advantages by offering superior performance, increased reliability, and enhanced user experience.
Report Segmentation & Scope
The report segments the hinge damper market based on product type (hydraulic, pneumatic, mechanical), application (automotive, furniture, industrial equipment, electronics), and geography (North America, Europe, Asia-Pacific, Rest of World). Each segment's growth projection, market size, and competitive dynamics are analyzed separately, providing a granular understanding of the market landscape. Growth projections vary across segments, with the automotive and Asia-Pacific segments exhibiting the highest growth potential.
Key Drivers of Hinge Damper Growth
Several factors fuel the growth of the hinge damper market. Technological advancements lead to improved damper performance and functionality. Economic growth in emerging markets boosts demand, particularly in the automotive and consumer goods sectors. Favorable government regulations and incentives promote the adoption of energy-efficient and environmentally friendly dampers.
Challenges in the Hinge Damper Sector
The hinge damper sector faces several challenges. Stringent regulatory requirements and safety standards can increase production costs. Supply chain disruptions and material price fluctuations impact profitability. Intense competition from established and emerging players necessitates continuous innovation and cost optimization strategies. These factors combined can reduce profit margins by an estimated xx% if not managed effectively.
Leading Players in the Hinge Damper Market
- ZIMMER GROUP
- Weforma
- SUSPA
- TOK, Inc.
- PONAR S.A.
- KOBA CO.,LTD
- Enidine on DirectIndustry
- Izmac Inc.
- BANSBACH easylift
- Sugatsune
- Hettich
- Blum
- Grass
- Mepla-Alfit
- Würth Group
Key Developments in Hinge Damper Sector
- 2022 Q4: SUSPA launched a new line of high-performance dampers for the automotive industry.
- 2023 Q1: ZIMMER GROUP acquired a smaller damper manufacturer, expanding its product portfolio.
- 2023 Q3: New material compositions for enhanced durability were introduced by TOK, Inc.
- (Further developments to be added based on available data)
Strategic Hinge Damper Market Outlook
The hinge damper market presents significant growth opportunities. Expansion into emerging markets, particularly in Asia-Pacific, offers considerable potential. Focus on innovation, including the development of smart dampers and sustainable materials, will drive future growth. Strategic partnerships and acquisitions will enable companies to expand their market reach and enhance their competitive position. The market’s long-term prospects are positive, driven by ongoing technological advancements and increasing demand across various sectors.
Hinge Damper Segmentation
-
1. Application
- 1.1. Automobile Industry
- 1.2. Home Appliances
- 1.3. Others
-
2. Types
- 2.1. Hydraulic
- 2.2. Machinery
Hinge Damper Segmentation By Geography
-
1. North America
- 1.1. United States
- 1.2. Canada
- 1.3. Mexico
-
2. South America
- 2.1. Brazil
- 2.2. Argentina
- 2.3. Rest of South America
-
3. Europe
- 3.1. United Kingdom
- 3.2. Germany
- 3.3. France
- 3.4. Italy
- 3.5. Spain
- 3.6. Russia
- 3.7. Benelux
- 3.8. Nordics
- 3.9. Rest of Europe
-
4. Middle East & Africa
- 4.1. Turkey
- 4.2. Israel
- 4.3. GCC
- 4.4. North Africa
- 4.5. South Africa
- 4.6. Rest of Middle East & Africa
-
5. Asia Pacific
- 5.1. China
- 5.2. India
- 5.3. Japan
- 5.4. South Korea
- 5.5. ASEAN
- 5.6. Oceania
- 5.7. Rest of Asia Pacific

Hinge Damper REPORT HIGHLIGHTS
| Aspects | Details |
|---|---|
| Study Period | 2019-2033 |
| Base Year | 2024 |
| Estimated Year | 2025 |
| Forecast Period | 2025-2033 |
| Historical Period | 2019-2024 |
| Growth Rate | CAGR of XX% from 2019-2033 |
| Segmentation |
|
Table of Contents
- 1. Introduction
- 1.1. Research Scope
- 1.2. Market Segmentation
- 1.3. Research Methodology
- 1.4. Definitions and Assumptions
- 2. Executive Summary
- 2.1. Introduction
- 3. Market Dynamics
- 3.1. Introduction
- 3.2. Market Drivers
- 3.3. Market Restrains
- 3.4. Market Trends
- 4. Market Factor Analysis
- 4.1. Porters Five Forces
- 4.2. Supply/Value Chain
- 4.3. PESTEL analysis
- 4.4. Market Entropy
- 4.5. Patent/Trademark Analysis
- 5. Global Hinge Damper Analysis, Insights and Forecast, 2019-2031
- 5.1. Market Analysis, Insights and Forecast - by Application
- 5.1.1. Automobile Industry
- 5.1.2. Home Appliances
- 5.1.3. Others
- 5.2. Market Analysis, Insights and Forecast - by Types
- 5.2.1. Hydraulic
- 5.2.2. Machinery
- 5.3. Market Analysis, Insights and Forecast - by Region
- 5.3.1. North America
- 5.3.2. South America
- 5.3.3. Europe
- 5.3.4. Middle East & Africa
- 5.3.5. Asia Pacific
- 5.1. Market Analysis, Insights and Forecast - by Application
- 6. North America Hinge Damper Analysis, Insights and Forecast, 2019-2031
- 6.1. Market Analysis, Insights and Forecast - by Application
- 6.1.1. Automobile Industry
- 6.1.2. Home Appliances
- 6.1.3. Others
- 6.2. Market Analysis, Insights and Forecast - by Types
- 6.2.1. Hydraulic
- 6.2.2. Machinery
- 6.1. Market Analysis, Insights and Forecast - by Application
- 7. South America Hinge Damper Analysis, Insights and Forecast, 2019-2031
- 7.1. Market Analysis, Insights and Forecast - by Application
- 7.1.1. Automobile Industry
- 7.1.2. Home Appliances
- 7.1.3. Others
- 7.2. Market Analysis, Insights and Forecast - by Types
- 7.2.1. Hydraulic
- 7.2.2. Machinery
- 7.1. Market Analysis, Insights and Forecast - by Application
- 8. Europe Hinge Damper Analysis, Insights and Forecast, 2019-2031
- 8.1. Market Analysis, Insights and Forecast - by Application
- 8.1.1. Automobile Industry
- 8.1.2. Home Appliances
- 8.1.3. Others
- 8.2. Market Analysis, Insights and Forecast - by Types
- 8.2.1. Hydraulic
- 8.2.2. Machinery
- 8.1. Market Analysis, Insights and Forecast - by Application
- 9. Middle East & Africa Hinge Damper Analysis, Insights and Forecast, 2019-2031
- 9.1. Market Analysis, Insights and Forecast - by Application
- 9.1.1. Automobile Industry
- 9.1.2. Home Appliances
- 9.1.3. Others
- 9.2. Market Analysis, Insights and Forecast - by Types
- 9.2.1. Hydraulic
- 9.2.2. Machinery
- 9.1. Market Analysis, Insights and Forecast - by Application
- 10. Asia Pacific Hinge Damper Analysis, Insights and Forecast, 2019-2031
- 10.1. Market Analysis, Insights and Forecast - by Application
- 10.1.1. Automobile Industry
- 10.1.2. Home Appliances
- 10.1.3. Others
- 10.2. Market Analysis, Insights and Forecast - by Types
- 10.2.1. Hydraulic
- 10.2.2. Machinery
- 10.1. Market Analysis, Insights and Forecast - by Application
- 11. Competitive Analysis
- 11.1. Global Market Share Analysis 2024
- 11.2. Company Profiles
- 11.2.1 ZIMMER GROUP
- 11.2.1.1. Overview
- 11.2.1.2. Products
- 11.2.1.3. SWOT Analysis
- 11.2.1.4. Recent Developments
- 11.2.1.5. Financials (Based on Availability)
- 11.2.2 Weforma
- 11.2.2.1. Overview
- 11.2.2.2. Products
- 11.2.2.3. SWOT Analysis
- 11.2.2.4. Recent Developments
- 11.2.2.5. Financials (Based on Availability)
- 11.2.3 SUSPA
- 11.2.3.1. Overview
- 11.2.3.2. Products
- 11.2.3.3. SWOT Analysis
- 11.2.3.4. Recent Developments
- 11.2.3.5. Financials (Based on Availability)
- 11.2.4 TOK
- 11.2.4.1. Overview
- 11.2.4.2. Products
- 11.2.4.3. SWOT Analysis
- 11.2.4.4. Recent Developments
- 11.2.4.5. Financials (Based on Availability)
- 11.2.5 Inc.
- 11.2.5.1. Overview
- 11.2.5.2. Products
- 11.2.5.3. SWOT Analysis
- 11.2.5.4. Recent Developments
- 11.2.5.5. Financials (Based on Availability)
- 11.2.6 PONAR S.A.
- 11.2.6.1. Overview
- 11.2.6.2. Products
- 11.2.6.3. SWOT Analysis
- 11.2.6.4. Recent Developments
- 11.2.6.5. Financials (Based on Availability)
- 11.2.7 KOBA CO.
- 11.2.7.1. Overview
- 11.2.7.2. Products
- 11.2.7.3. SWOT Analysis
- 11.2.7.4. Recent Developments
- 11.2.7.5. Financials (Based on Availability)
- 11.2.8 LTD
- 11.2.8.1. Overview
- 11.2.8.2. Products
- 11.2.8.3. SWOT Analysis
- 11.2.8.4. Recent Developments
- 11.2.8.5. Financials (Based on Availability)
- 11.2.9 Enidine on DirectIndustry
- 11.2.9.1. Overview
- 11.2.9.2. Products
- 11.2.9.3. SWOT Analysis
- 11.2.9.4. Recent Developments
- 11.2.9.5. Financials (Based on Availability)
- 11.2.10 Izmac Inc.
- 11.2.10.1. Overview
- 11.2.10.2. Products
- 11.2.10.3. SWOT Analysis
- 11.2.10.4. Recent Developments
- 11.2.10.5. Financials (Based on Availability)
- 11.2.11 BANSBACH easylift
- 11.2.11.1. Overview
- 11.2.11.2. Products
- 11.2.11.3. SWOT Analysis
- 11.2.11.4. Recent Developments
- 11.2.11.5. Financials (Based on Availability)
- 11.2.12 Sugatsune
- 11.2.12.1. Overview
- 11.2.12.2. Products
- 11.2.12.3. SWOT Analysis
- 11.2.12.4. Recent Developments
- 11.2.12.5. Financials (Based on Availability)
- 11.2.13 Hettich
- 11.2.13.1. Overview
- 11.2.13.2. Products
- 11.2.13.3. SWOT Analysis
- 11.2.13.4. Recent Developments
- 11.2.13.5. Financials (Based on Availability)
- 11.2.14 Blum
- 11.2.14.1. Overview
- 11.2.14.2. Products
- 11.2.14.3. SWOT Analysis
- 11.2.14.4. Recent Developments
- 11.2.14.5. Financials (Based on Availability)
- 11.2.15 Grass
- 11.2.15.1. Overview
- 11.2.15.2. Products
- 11.2.15.3. SWOT Analysis
- 11.2.15.4. Recent Developments
- 11.2.15.5. Financials (Based on Availability)
- 11.2.16 Mepla-Alfit
- 11.2.16.1. Overview
- 11.2.16.2. Products
- 11.2.16.3. SWOT Analysis
- 11.2.16.4. Recent Developments
- 11.2.16.5. Financials (Based on Availability)
- 11.2.17 Würth Group
- 11.2.17.1. Overview
- 11.2.17.2. Products
- 11.2.17.3. SWOT Analysis
- 11.2.17.4. Recent Developments
- 11.2.17.5. Financials (Based on Availability)
- 11.2.1 ZIMMER GROUP
List of Figures
- Figure 1: Global Hinge Damper Revenue Breakdown (million, %) by Region 2024 & 2032
- Figure 2: Global Hinge Damper Volume Breakdown (K, %) by Region 2024 & 2032
- Figure 3: North America Hinge Damper Revenue (million), by Application 2024 & 2032
- Figure 4: North America Hinge Damper Volume (K), by Application 2024 & 2032
- Figure 5: North America Hinge Damper Revenue Share (%), by Application 2024 & 2032
- Figure 6: North America Hinge Damper Volume Share (%), by Application 2024 & 2032
- Figure 7: North America Hinge Damper Revenue (million), by Types 2024 & 2032
- Figure 8: North America Hinge Damper Volume (K), by Types 2024 & 2032
- Figure 9: North America Hinge Damper Revenue Share (%), by Types 2024 & 2032
- Figure 10: North America Hinge Damper Volume Share (%), by Types 2024 & 2032
- Figure 11: North America Hinge Damper Revenue (million), by Country 2024 & 2032
- Figure 12: North America Hinge Damper Volume (K), by Country 2024 & 2032
- Figure 13: North America Hinge Damper Revenue Share (%), by Country 2024 & 2032
- Figure 14: North America Hinge Damper Volume Share (%), by Country 2024 & 2032
- Figure 15: South America Hinge Damper Revenue (million), by Application 2024 & 2032
- Figure 16: South America Hinge Damper Volume (K), by Application 2024 & 2032
- Figure 17: South America Hinge Damper Revenue Share (%), by Application 2024 & 2032
- Figure 18: South America Hinge Damper Volume Share (%), by Application 2024 & 2032
- Figure 19: South America Hinge Damper Revenue (million), by Types 2024 & 2032
- Figure 20: South America Hinge Damper Volume (K), by Types 2024 & 2032
- Figure 21: South America Hinge Damper Revenue Share (%), by Types 2024 & 2032
- Figure 22: South America Hinge Damper Volume Share (%), by Types 2024 & 2032
- Figure 23: South America Hinge Damper Revenue (million), by Country 2024 & 2032
- Figure 24: South America Hinge Damper Volume (K), by Country 2024 & 2032
- Figure 25: South America Hinge Damper Revenue Share (%), by Country 2024 & 2032
- Figure 26: South America Hinge Damper Volume Share (%), by Country 2024 & 2032
- Figure 27: Europe Hinge Damper Revenue (million), by Application 2024 & 2032
- Figure 28: Europe Hinge Damper Volume (K), by Application 2024 & 2032
- Figure 29: Europe Hinge Damper Revenue Share (%), by Application 2024 & 2032
- Figure 30: Europe Hinge Damper Volume Share (%), by Application 2024 & 2032
- Figure 31: Europe Hinge Damper Revenue (million), by Types 2024 & 2032
- Figure 32: Europe Hinge Damper Volume (K), by Types 2024 & 2032
- Figure 33: Europe Hinge Damper Revenue Share (%), by Types 2024 & 2032
- Figure 34: Europe Hinge Damper Volume Share (%), by Types 2024 & 2032
- Figure 35: Europe Hinge Damper Revenue (million), by Country 2024 & 2032
- Figure 36: Europe Hinge Damper Volume (K), by Country 2024 & 2032
- Figure 37: Europe Hinge Damper Revenue Share (%), by Country 2024 & 2032
- Figure 38: Europe Hinge Damper Volume Share (%), by Country 2024 & 2032
- Figure 39: Middle East & Africa Hinge Damper Revenue (million), by Application 2024 & 2032
- Figure 40: Middle East & Africa Hinge Damper Volume (K), by Application 2024 & 2032
- Figure 41: Middle East & Africa Hinge Damper Revenue Share (%), by Application 2024 & 2032
- Figure 42: Middle East & Africa Hinge Damper Volume Share (%), by Application 2024 & 2032
- Figure 43: Middle East & Africa Hinge Damper Revenue (million), by Types 2024 & 2032
- Figure 44: Middle East & Africa Hinge Damper Volume (K), by Types 2024 & 2032
- Figure 45: Middle East & Africa Hinge Damper Revenue Share (%), by Types 2024 & 2032
- Figure 46: Middle East & Africa Hinge Damper Volume Share (%), by Types 2024 & 2032
- Figure 47: Middle East & Africa Hinge Damper Revenue (million), by Country 2024 & 2032
- Figure 48: Middle East & Africa Hinge Damper Volume (K), by Country 2024 & 2032
- Figure 49: Middle East & Africa Hinge Damper Revenue Share (%), by Country 2024 & 2032
- Figure 50: Middle East & Africa Hinge Damper Volume Share (%), by Country 2024 & 2032
- Figure 51: Asia Pacific Hinge Damper Revenue (million), by Application 2024 & 2032
- Figure 52: Asia Pacific Hinge Damper Volume (K), by Application 2024 & 2032
- Figure 53: Asia Pacific Hinge Damper Revenue Share (%), by Application 2024 & 2032
- Figure 54: Asia Pacific Hinge Damper Volume Share (%), by Application 2024 & 2032
- Figure 55: Asia Pacific Hinge Damper Revenue (million), by Types 2024 & 2032
- Figure 56: Asia Pacific Hinge Damper Volume (K), by Types 2024 & 2032
- Figure 57: Asia Pacific Hinge Damper Revenue Share (%), by Types 2024 & 2032
- Figure 58: Asia Pacific Hinge Damper Volume Share (%), by Types 2024 & 2032
- Figure 59: Asia Pacific Hinge Damper Revenue (million), by Country 2024 & 2032
- Figure 60: Asia Pacific Hinge Damper Volume (K), by Country 2024 & 2032
- Figure 61: Asia Pacific Hinge Damper Revenue Share (%), by Country 2024 & 2032
- Figure 62: Asia Pacific Hinge Damper Volume Share (%), by Country 2024 & 2032
List of Tables
- Table 1: Global Hinge Damper Revenue million Forecast, by Region 2019 & 2032
- Table 2: Global Hinge Damper Volume K Forecast, by Region 2019 & 2032
- Table 3: Global Hinge Damper Revenue million Forecast, by Application 2019 & 2032
- Table 4: Global Hinge Damper Volume K Forecast, by Application 2019 & 2032
- Table 5: Global Hinge Damper Revenue million Forecast, by Types 2019 & 2032
- Table 6: Global Hinge Damper Volume K Forecast, by Types 2019 & 2032
- Table 7: Global Hinge Damper Revenue million Forecast, by Region 2019 & 2032
- Table 8: Global Hinge Damper Volume K Forecast, by Region 2019 & 2032
- Table 9: Global Hinge Damper Revenue million Forecast, by Application 2019 & 2032
- Table 10: Global Hinge Damper Volume K Forecast, by Application 2019 & 2032
- Table 11: Global Hinge Damper Revenue million Forecast, by Types 2019 & 2032
- Table 12: Global Hinge Damper Volume K Forecast, by Types 2019 & 2032
- Table 13: Global Hinge Damper Revenue million Forecast, by Country 2019 & 2032
- Table 14: Global Hinge Damper Volume K Forecast, by Country 2019 & 2032
- Table 15: United States Hinge Damper Revenue (million) Forecast, by Application 2019 & 2032
- Table 16: United States Hinge Damper Volume (K) Forecast, by Application 2019 & 2032
- Table 17: Canada Hinge Damper Revenue (million) Forecast, by Application 2019 & 2032
- Table 18: Canada Hinge Damper Volume (K) Forecast, by Application 2019 & 2032
- Table 19: Mexico Hinge Damper Revenue (million) Forecast, by Application 2019 & 2032
- Table 20: Mexico Hinge Damper Volume (K) Forecast, by Application 2019 & 2032
- Table 21: Global Hinge Damper Revenue million Forecast, by Application 2019 & 2032
- Table 22: Global Hinge Damper Volume K Forecast, by Application 2019 & 2032
- Table 23: Global Hinge Damper Revenue million Forecast, by Types 2019 & 2032
- Table 24: Global Hinge Damper Volume K Forecast, by Types 2019 & 2032
- Table 25: Global Hinge Damper Revenue million Forecast, by Country 2019 & 2032
- Table 26: Global Hinge Damper Volume K Forecast, by Country 2019 & 2032
- Table 27: Brazil Hinge Damper Revenue (million) Forecast, by Application 2019 & 2032
- Table 28: Brazil Hinge Damper Volume (K) Forecast, by Application 2019 & 2032
- Table 29: Argentina Hinge Damper Revenue (million) Forecast, by Application 2019 & 2032
- Table 30: Argentina Hinge Damper Volume (K) Forecast, by Application 2019 & 2032
- Table 31: Rest of South America Hinge Damper Revenue (million) Forecast, by Application 2019 & 2032
- Table 32: Rest of South America Hinge Damper Volume (K) Forecast, by Application 2019 & 2032
- Table 33: Global Hinge Damper Revenue million Forecast, by Application 2019 & 2032
- Table 34: Global Hinge Damper Volume K Forecast, by Application 2019 & 2032
- Table 35: Global Hinge Damper Revenue million Forecast, by Types 2019 & 2032
- Table 36: Global Hinge Damper Volume K Forecast, by Types 2019 & 2032
- Table 37: Global Hinge Damper Revenue million Forecast, by Country 2019 & 2032
- Table 38: Global Hinge Damper Volume K Forecast, by Country 2019 & 2032
- Table 39: United Kingdom Hinge Damper Revenue (million) Forecast, by Application 2019 & 2032
- Table 40: United Kingdom Hinge Damper Volume (K) Forecast, by Application 2019 & 2032
- Table 41: Germany Hinge Damper Revenue (million) Forecast, by Application 2019 & 2032
- Table 42: Germany Hinge Damper Volume (K) Forecast, by Application 2019 & 2032
- Table 43: France Hinge Damper Revenue (million) Forecast, by Application 2019 & 2032
- Table 44: France Hinge Damper Volume (K) Forecast, by Application 2019 & 2032
- Table 45: Italy Hinge Damper Revenue (million) Forecast, by Application 2019 & 2032
- Table 46: Italy Hinge Damper Volume (K) Forecast, by Application 2019 & 2032
- Table 47: Spain Hinge Damper Revenue (million) Forecast, by Application 2019 & 2032
- Table 48: Spain Hinge Damper Volume (K) Forecast, by Application 2019 & 2032
- Table 49: Russia Hinge Damper Revenue (million) Forecast, by Application 2019 & 2032
- Table 50: Russia Hinge Damper Volume (K) Forecast, by Application 2019 & 2032
- Table 51: Benelux Hinge Damper Revenue (million) Forecast, by Application 2019 & 2032
- Table 52: Benelux Hinge Damper Volume (K) Forecast, by Application 2019 & 2032
- Table 53: Nordics Hinge Damper Revenue (million) Forecast, by Application 2019 & 2032
- Table 54: Nordics Hinge Damper Volume (K) Forecast, by Application 2019 & 2032
- Table 55: Rest of Europe Hinge Damper Revenue (million) Forecast, by Application 2019 & 2032
- Table 56: Rest of Europe Hinge Damper Volume (K) Forecast, by Application 2019 & 2032
- Table 57: Global Hinge Damper Revenue million Forecast, by Application 2019 & 2032
- Table 58: Global Hinge Damper Volume K Forecast, by Application 2019 & 2032
- Table 59: Global Hinge Damper Revenue million Forecast, by Types 2019 & 2032
- Table 60: Global Hinge Damper Volume K Forecast, by Types 2019 & 2032
- Table 61: Global Hinge Damper Revenue million Forecast, by Country 2019 & 2032
- Table 62: Global Hinge Damper Volume K Forecast, by Country 2019 & 2032
- Table 63: Turkey Hinge Damper Revenue (million) Forecast, by Application 2019 & 2032
- Table 64: Turkey Hinge Damper Volume (K) Forecast, by Application 2019 & 2032
- Table 65: Israel Hinge Damper Revenue (million) Forecast, by Application 2019 & 2032
- Table 66: Israel Hinge Damper Volume (K) Forecast, by Application 2019 & 2032
- Table 67: GCC Hinge Damper Revenue (million) Forecast, by Application 2019 & 2032
- Table 68: GCC Hinge Damper Volume (K) Forecast, by Application 2019 & 2032
- Table 69: North Africa Hinge Damper Revenue (million) Forecast, by Application 2019 & 2032
- Table 70: North Africa Hinge Damper Volume (K) Forecast, by Application 2019 & 2032
- Table 71: South Africa Hinge Damper Revenue (million) Forecast, by Application 2019 & 2032
- Table 72: South Africa Hinge Damper Volume (K) Forecast, by Application 2019 & 2032
- Table 73: Rest of Middle East & Africa Hinge Damper Revenue (million) Forecast, by Application 2019 & 2032
- Table 74: Rest of Middle East & Africa Hinge Damper Volume (K) Forecast, by Application 2019 & 2032
- Table 75: Global Hinge Damper Revenue million Forecast, by Application 2019 & 2032
- Table 76: Global Hinge Damper Volume K Forecast, by Application 2019 & 2032
- Table 77: Global Hinge Damper Revenue million Forecast, by Types 2019 & 2032
- Table 78: Global Hinge Damper Volume K Forecast, by Types 2019 & 2032
- Table 79: Global Hinge Damper Revenue million Forecast, by Country 2019 & 2032
- Table 80: Global Hinge Damper Volume K Forecast, by Country 2019 & 2032
- Table 81: China Hinge Damper Revenue (million) Forecast, by Application 2019 & 2032
- Table 82: China Hinge Damper Volume (K) Forecast, by Application 2019 & 2032
- Table 83: India Hinge Damper Revenue (million) Forecast, by Application 2019 & 2032
- Table 84: India Hinge Damper Volume (K) Forecast, by Application 2019 & 2032
- Table 85: Japan Hinge Damper Revenue (million) Forecast, by Application 2019 & 2032
- Table 86: Japan Hinge Damper Volume (K) Forecast, by Application 2019 & 2032
- Table 87: South Korea Hinge Damper Revenue (million) Forecast, by Application 2019 & 2032
- Table 88: South Korea Hinge Damper Volume (K) Forecast, by Application 2019 & 2032
- Table 89: ASEAN Hinge Damper Revenue (million) Forecast, by Application 2019 & 2032
- Table 90: ASEAN Hinge Damper Volume (K) Forecast, by Application 2019 & 2032
- Table 91: Oceania Hinge Damper Revenue (million) Forecast, by Application 2019 & 2032
- Table 92: Oceania Hinge Damper Volume (K) Forecast, by Application 2019 & 2032
- Table 93: Rest of Asia Pacific Hinge Damper Revenue (million) Forecast, by Application 2019 & 2032
- Table 94: Rest of Asia Pacific Hinge Damper Volume (K) Forecast, by Application 2019 & 2032
Frequently Asked Questions
1. What is the projected Compound Annual Growth Rate (CAGR) of the Hinge Damper?
The projected CAGR is approximately XX%.
2. Which companies are prominent players in the Hinge Damper?
Key companies in the market include ZIMMER GROUP, Weforma, SUSPA, TOK, Inc., PONAR S.A., KOBA CO., LTD, Enidine on DirectIndustry, Izmac Inc., BANSBACH easylift, Sugatsune, Hettich, Blum, Grass, Mepla-Alfit, Würth Group.
3. What are the main segments of the Hinge Damper?
The market segments include Application, Types.
4. Can you provide details about the market size?
The market size is estimated to be USD XXX million as of 2022.
5. What are some drivers contributing to market growth?
N/A
6. What are the notable trends driving market growth?
N/A
7. Are there any restraints impacting market growth?
N/A
8. Can you provide examples of recent developments in the market?
N/A
9. What pricing options are available for accessing the report?
Pricing options include single-user, multi-user, and enterprise licenses priced at USD 3350.00, USD 5025.00, and USD 6700.00 respectively.
10. Is the market size provided in terms of value or volume?
The market size is provided in terms of value, measured in million and volume, measured in K.
11. Are there any specific market keywords associated with the report?
Yes, the market keyword associated with the report is "Hinge Damper," which aids in identifying and referencing the specific market segment covered.
12. How do I determine which pricing option suits my needs best?
The pricing options vary based on user requirements and access needs. Individual users may opt for single-user licenses, while businesses requiring broader access may choose multi-user or enterprise licenses for cost-effective access to the report.
13. Are there any additional resources or data provided in the Hinge Damper report?
While the report offers comprehensive insights, it's advisable to review the specific contents or supplementary materials provided to ascertain if additional resources or data are available.
14. How can I stay updated on further developments or reports in the Hinge Damper?
To stay informed about further developments, trends, and reports in the Hinge Damper, consider subscribing to industry newsletters, following relevant companies and organizations, or regularly checking reputable industry news sources and publications.
Methodology
Step 1 - Identification of Relevant Samples Size from Population Database


Step 2 - Approaches for Defining Global Market Size (Value, Volume* & Price*)

Note*: In applicable scenarios
Step 3 - Data Sources
Primary Research
- Web Analytics
- Survey Reports
- Research Institute
- Latest Research Reports
- Opinion Leaders
Secondary Research
- Annual Reports
- White Paper
- Latest Press Release
- Industry Association
- Paid Database
- Investor Presentations

Step 4 - Data Triangulation
Involves using different sources of information in order to increase the validity of a study
These sources are likely to be stakeholders in a program - participants, other researchers, program staff, other community members, and so on.
Then we put all data in single framework & apply various statistical tools to find out the dynamic on the market.
During the analysis stage, feedback from the stakeholder groups would be compared to determine areas of agreement as well as areas of divergence


