
Key Insights
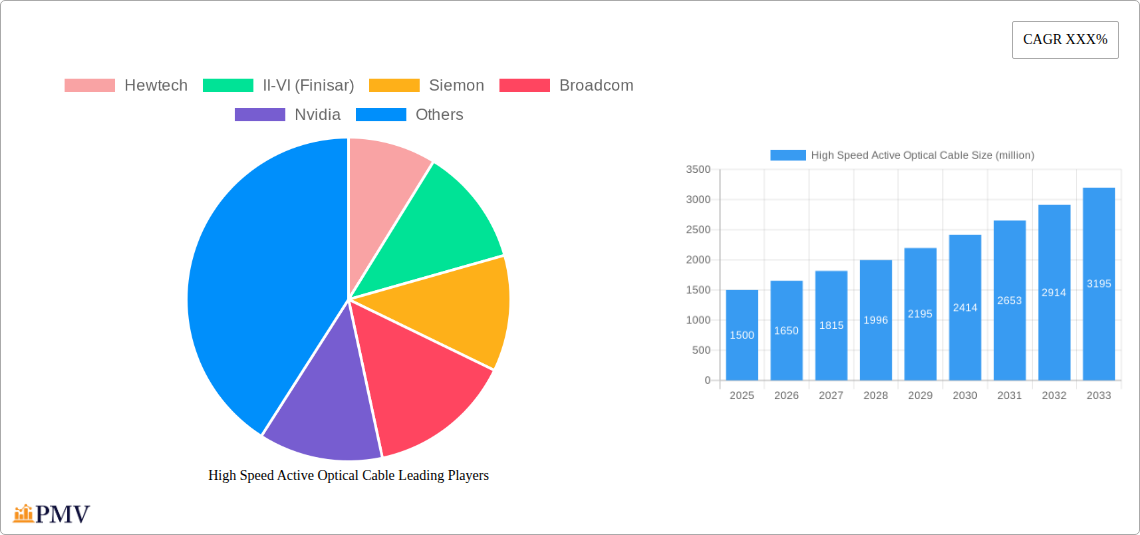
The high-speed active optical cable (AOC) market is experiencing robust growth, driven by the increasing demand for higher bandwidth and faster data transmission speeds in data centers, telecommunications networks, and high-performance computing environments. The market's expansion is fueled by the proliferation of cloud computing, the rise of 5G networks, and the growing adoption of artificial intelligence and machine learning applications, all of which necessitate significantly improved data transfer capabilities. Key players like Hewlett Packard Enterprise (HPE), II-VI (Finisar), Siemon, Broadcom, Nvidia, Amphenol ICC, Molex, Optomind, Sanwa Tech, Leoni, Hitachi Cable, Fujikura, Sumoto Electric, Sopto, Shenzhen Gigalight, and EverPro Technologies are actively involved in developing and deploying advanced AOC solutions, contributing to market competition and innovation. The market is segmented by data rate (e.g., 400G, 800G, 1.6T), cable type (e.g., parallel optic, direct attach), and application (e.g., data center interconnect, telecommunications). While supply chain challenges and potential material cost fluctuations pose some restraints, the overall market outlook remains positive, projecting sustained growth over the forecast period.
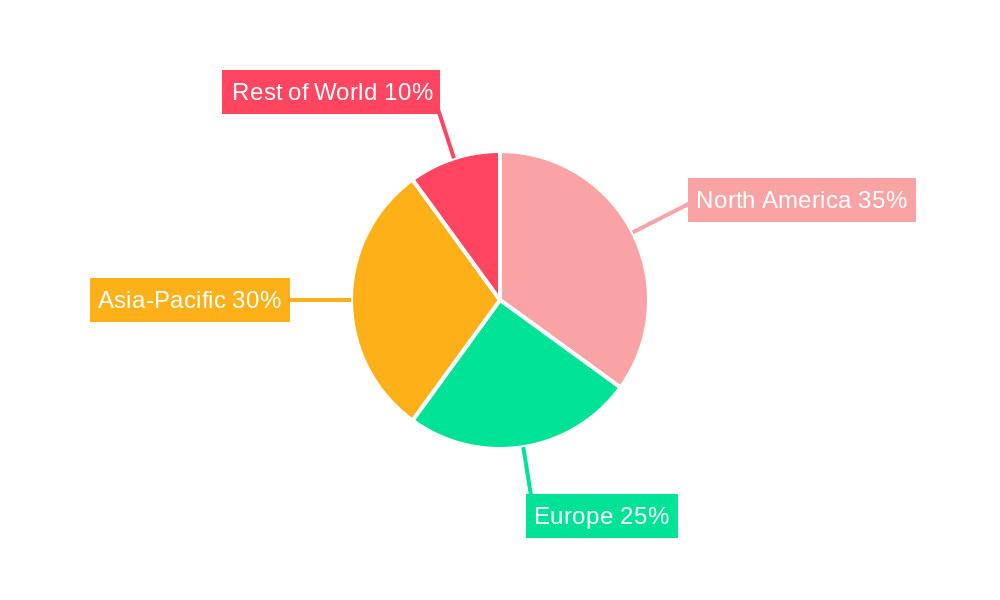
The continuous advancements in optical transceiver technology and the ongoing miniaturization of AOCs are key factors contributing to the market's expansion. Furthermore, the increasing demand for energy-efficient solutions in data centers is driving the adoption of AOCs as they offer significant power savings compared to traditional copper cables. The competitive landscape is characterized by both established players and emerging companies, leading to continuous product innovation and price optimization. Geographically, North America and Asia-Pacific are expected to remain dominant regions, fueled by substantial investments in data center infrastructure and the growing adoption of advanced technologies in these areas. Future market growth will be heavily influenced by developments in next-generation optical transceivers, industry standards for high-speed connectivity, and the overall pace of digital transformation across various sectors.
High Speed Active Optical Cable Market Report: 2019-2033
This comprehensive report provides an in-depth analysis of the High Speed Active Optical Cable (AOC) market, offering invaluable insights for industry stakeholders, investors, and strategic decision-makers. Covering the period from 2019 to 2033, with a base year of 2025 and a forecast period of 2025-2033, this report meticulously examines market dynamics, competitive landscapes, and future growth potential. The report projects a market value exceeding $XX million by 2033, showcasing significant growth opportunities in this rapidly evolving sector.
High Speed Active Optical Cable Market Structure & Competitive Dynamics
The High Speed Active Optical Cable market exhibits a moderately concentrated structure, with key players holding significant market share. The industry is characterized by intense competition, driven by continuous technological advancements and the pursuit of higher data transmission speeds. Market concentration is further influenced by mergers and acquisitions (M&A) activities, with several significant deals valued at over $XX million recorded during the historical period (2019-2024). Regulatory frameworks vary across regions, impacting market access and product compliance. The emergence of alternative technologies like copper cabling presents a competitive threat, although the superior performance and cost-effectiveness of AOCs in high-bandwidth applications ensure continued market dominance. End-user trends, particularly in data centers and high-performance computing (HPC), significantly influence market growth.
- Market Share (Estimated 2025): Top 5 players account for approximately 60% of the global market.
- M&A Activity (2019-2024): At least 5 significant M&A deals, with a combined value exceeding $XX million, reshaped the competitive landscape.
- Key Competitive Strategies: Focus on innovation, strategic partnerships, and geographic expansion.
High Speed Active Optical Cable Industry Trends & Insights
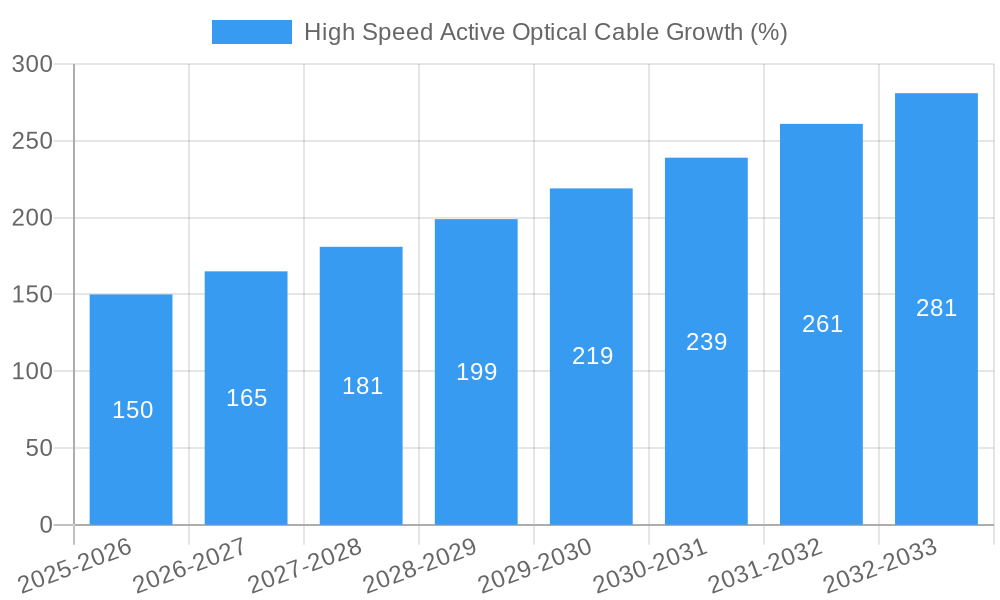
The High Speed Active Optical Cable market is experiencing robust growth, driven by several key factors. The increasing demand for high-bandwidth applications in data centers, 5G networks, and high-performance computing is a primary growth driver. Technological advancements, such as the development of 400G, 800G, and beyond, are pushing the boundaries of data transmission capabilities, fueling market expansion. Consumer preferences towards higher data speeds and reduced latency are further accelerating market growth. The Compound Annual Growth Rate (CAGR) for the forecast period (2025-2033) is estimated at XX%, signifying substantial market expansion. Market penetration in emerging economies is expected to increase significantly. Competitive dynamics, characterized by intense innovation and strategic partnerships, are shaping market evolution.
Dominant Markets & Segments in High Speed Active Optical Cable
The North American region currently dominates the High Speed Active Optical Cable market, driven by substantial investments in data center infrastructure and the presence of major technology companies. Within North America, the United States holds the largest market share.
Key Drivers in North America:
- Strong investments in data center infrastructure.
- High adoption of cloud computing services.
- Presence of major technology companies.
- Favorable regulatory environment.
Dominance Analysis: North America's early adoption of advanced technologies and robust economic growth have fueled market leadership. The region's well-established data center ecosystem and high demand for high-speed data transmission contribute to its continued dominance.
High Speed Active Optical Cable Product Innovations
Recent product innovations in High Speed Active Optical Cables focus on increasing data transmission speeds, improving signal integrity, and reducing power consumption. The development of 800G and beyond AOCs is a key trend, enabling higher bandwidth and lower latency in data centers and networking applications. These advancements improve overall network performance and efficiency, enhancing their market fit. Competition focuses on delivering superior performance, reliability, and cost-effectiveness.
Report Segmentation & Scope
The report segments the High Speed Active Optical Cable market by data rate (e.g., 100G, 200G, 400G, 800G), application (data centers, telecommunications, high-performance computing), and geography. Each segment's growth projection is analyzed, along with its market size and competitive dynamics.
Key Drivers of High Speed Active Optical Cable Growth
Several factors drive the growth of the High Speed Active Optical Cable market. These include the exponential increase in data traffic, the growing adoption of cloud computing and big data analytics, and the expansion of 5G networks. Government initiatives promoting digital infrastructure development in various regions further boost market growth. Technological advancements leading to higher data rates and lower costs are also crucial drivers.
Challenges in the High Speed Active Optical Cable Sector
The High Speed Active Optical Cable market faces certain challenges, including the high initial investment costs associated with deploying AOC infrastructure. Supply chain disruptions can impact production and availability, potentially affecting market growth. Furthermore, competition from other transmission technologies and fluctuating raw material prices pose potential challenges. The impact of these challenges on market growth is estimated at a projected xx% reduction in overall market value by 2033.
Leading Players in the High Speed Active Optical Cable Market
- Hewtech
- II-VI (Finisar)
- Siemon
- Broadcom
- Nvidia
- Amphenol ICC
- Molex
- Optomind
- Sanwa Tech
- Leoni
- Hitachi Cable
- Fujikura
- Sumitomo Electric
- Sopto
- Shenzhen Gigalight
- EverPro Technologies
Key Developments in High Speed Active Optical Cable Sector
- Q1 2023: Broadcom announces a new 800G AOC solution.
- Q3 2022: II-VI (Finisar) launches a high-density AOC for data centers.
- Q4 2021: Hewtech secures a major contract for AOC deployment in a hyperscale data center.
- (Further developments to be added based on available data)
Strategic High Speed Active Optical Cable Market Outlook
The High Speed Active Optical Cable market is poised for continued robust growth, driven by the insatiable demand for higher bandwidth and faster data transmission speeds. Strategic opportunities exist for companies focused on innovation, particularly in the development of next-generation AOC technologies and expansion into emerging markets. Focus on cost optimization and supply chain resilience will be critical for maintaining competitiveness. The market anticipates further consolidation through M&A activities and strategic alliances.
High Speed Active Optical Cable Segmentation
-
1. Application
- 1.1. Data Center
- 1.2. High Performance Computing
- 1.3. Video Surveillance
- 1.4. Mass Storage
- 1.5. Switch
- 1.6. Other
-
2. Type
- 2.1. 100-400Gbps
- 2.2. Above 400Gbps
High Speed Active Optical Cable Segmentation By Geography
-
1. North America
- 1.1. United States
- 1.2. Canada
- 1.3. Mexico
-
2. South America
- 2.1. Brazil
- 2.2. Argentina
- 2.3. Rest of South America
-
3. Europe
- 3.1. United Kingdom
- 3.2. Germany
- 3.3. France
- 3.4. Italy
- 3.5. Spain
- 3.6. Russia
- 3.7. Benelux
- 3.8. Nordics
- 3.9. Rest of Europe
-
4. Middle East & Africa
- 4.1. Turkey
- 4.2. Israel
- 4.3. GCC
- 4.4. North Africa
- 4.5. South Africa
- 4.6. Rest of Middle East & Africa
-
5. Asia Pacific
- 5.1. China
- 5.2. India
- 5.3. Japan
- 5.4. South Korea
- 5.5. ASEAN
- 5.6. Oceania
- 5.7. Rest of Asia Pacific
High Speed Active Optical Cable REPORT HIGHLIGHTS
| Aspects | Details |
|---|---|
| Study Period | 2019-2033 |
| Base Year | 2024 |
| Estimated Year | 2025 |
| Forecast Period | 2025-2033 |
| Historical Period | 2019-2024 |
| Growth Rate | CAGR of XXX% from 2019-2033 |
| Segmentation |
|
Table of Contents
- 1. Introduction
- 1.1. Research Scope
- 1.2. Market Segmentation
- 1.3. Research Methodology
- 1.4. Definitions and Assumptions
- 2. Executive Summary
- 2.1. Introduction
- 3. Market Dynamics
- 3.1. Introduction
- 3.2. Market Drivers
- 3.3. Market Restrains
- 3.4. Market Trends
- 4. Market Factor Analysis
- 4.1. Porters Five Forces
- 4.2. Supply/Value Chain
- 4.3. PESTEL analysis
- 4.4. Market Entropy
- 4.5. Patent/Trademark Analysis
- 5. Global High Speed Active Optical Cable Analysis, Insights and Forecast, 2019-2031
- 5.1. Market Analysis, Insights and Forecast - by Application
- 5.1.1. Data Center
- 5.1.2. High Performance Computing
- 5.1.3. Video Surveillance
- 5.1.4. Mass Storage
- 5.1.5. Switch
- 5.1.6. Other
- 5.2. Market Analysis, Insights and Forecast - by Type
- 5.2.1. 100-400Gbps
- 5.2.2. Above 400Gbps
- 5.3. Market Analysis, Insights and Forecast - by Region
- 5.3.1. North America
- 5.3.2. South America
- 5.3.3. Europe
- 5.3.4. Middle East & Africa
- 5.3.5. Asia Pacific
- 5.1. Market Analysis, Insights and Forecast - by Application
- 6. North America High Speed Active Optical Cable Analysis, Insights and Forecast, 2019-2031
- 6.1. Market Analysis, Insights and Forecast - by Application
- 6.1.1. Data Center
- 6.1.2. High Performance Computing
- 6.1.3. Video Surveillance
- 6.1.4. Mass Storage
- 6.1.5. Switch
- 6.1.6. Other
- 6.2. Market Analysis, Insights and Forecast - by Type
- 6.2.1. 100-400Gbps
- 6.2.2. Above 400Gbps
- 6.1. Market Analysis, Insights and Forecast - by Application
- 7. South America High Speed Active Optical Cable Analysis, Insights and Forecast, 2019-2031
- 7.1. Market Analysis, Insights and Forecast - by Application
- 7.1.1. Data Center
- 7.1.2. High Performance Computing
- 7.1.3. Video Surveillance
- 7.1.4. Mass Storage
- 7.1.5. Switch
- 7.1.6. Other
- 7.2. Market Analysis, Insights and Forecast - by Type
- 7.2.1. 100-400Gbps
- 7.2.2. Above 400Gbps
- 7.1. Market Analysis, Insights and Forecast - by Application
- 8. Europe High Speed Active Optical Cable Analysis, Insights and Forecast, 2019-2031
- 8.1. Market Analysis, Insights and Forecast - by Application
- 8.1.1. Data Center
- 8.1.2. High Performance Computing
- 8.1.3. Video Surveillance
- 8.1.4. Mass Storage
- 8.1.5. Switch
- 8.1.6. Other
- 8.2. Market Analysis, Insights and Forecast - by Type
- 8.2.1. 100-400Gbps
- 8.2.2. Above 400Gbps
- 8.1. Market Analysis, Insights and Forecast - by Application
- 9. Middle East & Africa High Speed Active Optical Cable Analysis, Insights and Forecast, 2019-2031
- 9.1. Market Analysis, Insights and Forecast - by Application
- 9.1.1. Data Center
- 9.1.2. High Performance Computing
- 9.1.3. Video Surveillance
- 9.1.4. Mass Storage
- 9.1.5. Switch
- 9.1.6. Other
- 9.2. Market Analysis, Insights and Forecast - by Type
- 9.2.1. 100-400Gbps
- 9.2.2. Above 400Gbps
- 9.1. Market Analysis, Insights and Forecast - by Application
- 10. Asia Pacific High Speed Active Optical Cable Analysis, Insights and Forecast, 2019-2031
- 10.1. Market Analysis, Insights and Forecast - by Application
- 10.1.1. Data Center
- 10.1.2. High Performance Computing
- 10.1.3. Video Surveillance
- 10.1.4. Mass Storage
- 10.1.5. Switch
- 10.1.6. Other
- 10.2. Market Analysis, Insights and Forecast - by Type
- 10.2.1. 100-400Gbps
- 10.2.2. Above 400Gbps
- 10.1. Market Analysis, Insights and Forecast - by Application
- 11. Competitive Analysis
- 11.1. Global Market Share Analysis 2024
- 11.2. Company Profiles
- 11.2.1 Hewtech
- 11.2.1.1. Overview
- 11.2.1.2. Products
- 11.2.1.3. SWOT Analysis
- 11.2.1.4. Recent Developments
- 11.2.1.5. Financials (Based on Availability)
- 11.2.2 II-VI (Finisar)
- 11.2.2.1. Overview
- 11.2.2.2. Products
- 11.2.2.3. SWOT Analysis
- 11.2.2.4. Recent Developments
- 11.2.2.5. Financials (Based on Availability)
- 11.2.3 Siemon
- 11.2.3.1. Overview
- 11.2.3.2. Products
- 11.2.3.3. SWOT Analysis
- 11.2.3.4. Recent Developments
- 11.2.3.5. Financials (Based on Availability)
- 11.2.4 Broadcom
- 11.2.4.1. Overview
- 11.2.4.2. Products
- 11.2.4.3. SWOT Analysis
- 11.2.4.4. Recent Developments
- 11.2.4.5. Financials (Based on Availability)
- 11.2.5 Nvidia
- 11.2.5.1. Overview
- 11.2.5.2. Products
- 11.2.5.3. SWOT Analysis
- 11.2.5.4. Recent Developments
- 11.2.5.5. Financials (Based on Availability)
- 11.2.6 Amphenol ICC
- 11.2.6.1. Overview
- 11.2.6.2. Products
- 11.2.6.3. SWOT Analysis
- 11.2.6.4. Recent Developments
- 11.2.6.5. Financials (Based on Availability)
- 11.2.7 Molex
- 11.2.7.1. Overview
- 11.2.7.2. Products
- 11.2.7.3. SWOT Analysis
- 11.2.7.4. Recent Developments
- 11.2.7.5. Financials (Based on Availability)
- 11.2.8 Optomind
- 11.2.8.1. Overview
- 11.2.8.2. Products
- 11.2.8.3. SWOT Analysis
- 11.2.8.4. Recent Developments
- 11.2.8.5. Financials (Based on Availability)
- 11.2.9 Sanwa Tech
- 11.2.9.1. Overview
- 11.2.9.2. Products
- 11.2.9.3. SWOT Analysis
- 11.2.9.4. Recent Developments
- 11.2.9.5. Financials (Based on Availability)
- 11.2.10 Leoni
- 11.2.10.1. Overview
- 11.2.10.2. Products
- 11.2.10.3. SWOT Analysis
- 11.2.10.4. Recent Developments
- 11.2.10.5. Financials (Based on Availability)
- 11.2.11 Hitachi Cable
- 11.2.11.1. Overview
- 11.2.11.2. Products
- 11.2.11.3. SWOT Analysis
- 11.2.11.4. Recent Developments
- 11.2.11.5. Financials (Based on Availability)
- 11.2.12 Fujikura
- 11.2.12.1. Overview
- 11.2.12.2. Products
- 11.2.12.3. SWOT Analysis
- 11.2.12.4. Recent Developments
- 11.2.12.5. Financials (Based on Availability)
- 11.2.13 Sumitomo Electric
- 11.2.13.1. Overview
- 11.2.13.2. Products
- 11.2.13.3. SWOT Analysis
- 11.2.13.4. Recent Developments
- 11.2.13.5. Financials (Based on Availability)
- 11.2.14 Sopto
- 11.2.14.1. Overview
- 11.2.14.2. Products
- 11.2.14.3. SWOT Analysis
- 11.2.14.4. Recent Developments
- 11.2.14.5. Financials (Based on Availability)
- 11.2.15 Shenzhen Gigalight
- 11.2.15.1. Overview
- 11.2.15.2. Products
- 11.2.15.3. SWOT Analysis
- 11.2.15.4. Recent Developments
- 11.2.15.5. Financials (Based on Availability)
- 11.2.16 EverPro Technologies
- 11.2.16.1. Overview
- 11.2.16.2. Products
- 11.2.16.3. SWOT Analysis
- 11.2.16.4. Recent Developments
- 11.2.16.5. Financials (Based on Availability)
- 11.2.1 Hewtech
List of Figures
- Figure 1: Global High Speed Active Optical Cable Revenue Breakdown (million, %) by Region 2024 & 2032
- Figure 2: Global High Speed Active Optical Cable Volume Breakdown (K, %) by Region 2024 & 2032
- Figure 3: North America High Speed Active Optical Cable Revenue (million), by Application 2024 & 2032
- Figure 4: North America High Speed Active Optical Cable Volume (K), by Application 2024 & 2032
- Figure 5: North America High Speed Active Optical Cable Revenue Share (%), by Application 2024 & 2032
- Figure 6: North America High Speed Active Optical Cable Volume Share (%), by Application 2024 & 2032
- Figure 7: North America High Speed Active Optical Cable Revenue (million), by Type 2024 & 2032
- Figure 8: North America High Speed Active Optical Cable Volume (K), by Type 2024 & 2032
- Figure 9: North America High Speed Active Optical Cable Revenue Share (%), by Type 2024 & 2032
- Figure 10: North America High Speed Active Optical Cable Volume Share (%), by Type 2024 & 2032
- Figure 11: North America High Speed Active Optical Cable Revenue (million), by Country 2024 & 2032
- Figure 12: North America High Speed Active Optical Cable Volume (K), by Country 2024 & 2032
- Figure 13: North America High Speed Active Optical Cable Revenue Share (%), by Country 2024 & 2032
- Figure 14: North America High Speed Active Optical Cable Volume Share (%), by Country 2024 & 2032
- Figure 15: South America High Speed Active Optical Cable Revenue (million), by Application 2024 & 2032
- Figure 16: South America High Speed Active Optical Cable Volume (K), by Application 2024 & 2032
- Figure 17: South America High Speed Active Optical Cable Revenue Share (%), by Application 2024 & 2032
- Figure 18: South America High Speed Active Optical Cable Volume Share (%), by Application 2024 & 2032
- Figure 19: South America High Speed Active Optical Cable Revenue (million), by Type 2024 & 2032
- Figure 20: South America High Speed Active Optical Cable Volume (K), by Type 2024 & 2032
- Figure 21: South America High Speed Active Optical Cable Revenue Share (%), by Type 2024 & 2032
- Figure 22: South America High Speed Active Optical Cable Volume Share (%), by Type 2024 & 2032
- Figure 23: South America High Speed Active Optical Cable Revenue (million), by Country 2024 & 2032
- Figure 24: South America High Speed Active Optical Cable Volume (K), by Country 2024 & 2032
- Figure 25: South America High Speed Active Optical Cable Revenue Share (%), by Country 2024 & 2032
- Figure 26: South America High Speed Active Optical Cable Volume Share (%), by Country 2024 & 2032
- Figure 27: Europe High Speed Active Optical Cable Revenue (million), by Application 2024 & 2032
- Figure 28: Europe High Speed Active Optical Cable Volume (K), by Application 2024 & 2032
- Figure 29: Europe High Speed Active Optical Cable Revenue Share (%), by Application 2024 & 2032
- Figure 30: Europe High Speed Active Optical Cable Volume Share (%), by Application 2024 & 2032
- Figure 31: Europe High Speed Active Optical Cable Revenue (million), by Type 2024 & 2032
- Figure 32: Europe High Speed Active Optical Cable Volume (K), by Type 2024 & 2032
- Figure 33: Europe High Speed Active Optical Cable Revenue Share (%), by Type 2024 & 2032
- Figure 34: Europe High Speed Active Optical Cable Volume Share (%), by Type 2024 & 2032
- Figure 35: Europe High Speed Active Optical Cable Revenue (million), by Country 2024 & 2032
- Figure 36: Europe High Speed Active Optical Cable Volume (K), by Country 2024 & 2032
- Figure 37: Europe High Speed Active Optical Cable Revenue Share (%), by Country 2024 & 2032
- Figure 38: Europe High Speed Active Optical Cable Volume Share (%), by Country 2024 & 2032
- Figure 39: Middle East & Africa High Speed Active Optical Cable Revenue (million), by Application 2024 & 2032
- Figure 40: Middle East & Africa High Speed Active Optical Cable Volume (K), by Application 2024 & 2032
- Figure 41: Middle East & Africa High Speed Active Optical Cable Revenue Share (%), by Application 2024 & 2032
- Figure 42: Middle East & Africa High Speed Active Optical Cable Volume Share (%), by Application 2024 & 2032
- Figure 43: Middle East & Africa High Speed Active Optical Cable Revenue (million), by Type 2024 & 2032
- Figure 44: Middle East & Africa High Speed Active Optical Cable Volume (K), by Type 2024 & 2032
- Figure 45: Middle East & Africa High Speed Active Optical Cable Revenue Share (%), by Type 2024 & 2032
- Figure 46: Middle East & Africa High Speed Active Optical Cable Volume Share (%), by Type 2024 & 2032
- Figure 47: Middle East & Africa High Speed Active Optical Cable Revenue (million), by Country 2024 & 2032
- Figure 48: Middle East & Africa High Speed Active Optical Cable Volume (K), by Country 2024 & 2032
- Figure 49: Middle East & Africa High Speed Active Optical Cable Revenue Share (%), by Country 2024 & 2032
- Figure 50: Middle East & Africa High Speed Active Optical Cable Volume Share (%), by Country 2024 & 2032
- Figure 51: Asia Pacific High Speed Active Optical Cable Revenue (million), by Application 2024 & 2032
- Figure 52: Asia Pacific High Speed Active Optical Cable Volume (K), by Application 2024 & 2032
- Figure 53: Asia Pacific High Speed Active Optical Cable Revenue Share (%), by Application 2024 & 2032
- Figure 54: Asia Pacific High Speed Active Optical Cable Volume Share (%), by Application 2024 & 2032
- Figure 55: Asia Pacific High Speed Active Optical Cable Revenue (million), by Type 2024 & 2032
- Figure 56: Asia Pacific High Speed Active Optical Cable Volume (K), by Type 2024 & 2032
- Figure 57: Asia Pacific High Speed Active Optical Cable Revenue Share (%), by Type 2024 & 2032
- Figure 58: Asia Pacific High Speed Active Optical Cable Volume Share (%), by Type 2024 & 2032
- Figure 59: Asia Pacific High Speed Active Optical Cable Revenue (million), by Country 2024 & 2032
- Figure 60: Asia Pacific High Speed Active Optical Cable Volume (K), by Country 2024 & 2032
- Figure 61: Asia Pacific High Speed Active Optical Cable Revenue Share (%), by Country 2024 & 2032
- Figure 62: Asia Pacific High Speed Active Optical Cable Volume Share (%), by Country 2024 & 2032
List of Tables
- Table 1: Global High Speed Active Optical Cable Revenue million Forecast, by Region 2019 & 2032
- Table 2: Global High Speed Active Optical Cable Volume K Forecast, by Region 2019 & 2032
- Table 3: Global High Speed Active Optical Cable Revenue million Forecast, by Application 2019 & 2032
- Table 4: Global High Speed Active Optical Cable Volume K Forecast, by Application 2019 & 2032
- Table 5: Global High Speed Active Optical Cable Revenue million Forecast, by Type 2019 & 2032
- Table 6: Global High Speed Active Optical Cable Volume K Forecast, by Type 2019 & 2032
- Table 7: Global High Speed Active Optical Cable Revenue million Forecast, by Region 2019 & 2032
- Table 8: Global High Speed Active Optical Cable Volume K Forecast, by Region 2019 & 2032
- Table 9: Global High Speed Active Optical Cable Revenue million Forecast, by Application 2019 & 2032
- Table 10: Global High Speed Active Optical Cable Volume K Forecast, by Application 2019 & 2032
- Table 11: Global High Speed Active Optical Cable Revenue million Forecast, by Type 2019 & 2032
- Table 12: Global High Speed Active Optical Cable Volume K Forecast, by Type 2019 & 2032
- Table 13: Global High Speed Active Optical Cable Revenue million Forecast, by Country 2019 & 2032
- Table 14: Global High Speed Active Optical Cable Volume K Forecast, by Country 2019 & 2032
- Table 15: United States High Speed Active Optical Cable Revenue (million) Forecast, by Application 2019 & 2032
- Table 16: United States High Speed Active Optical Cable Volume (K) Forecast, by Application 2019 & 2032
- Table 17: Canada High Speed Active Optical Cable Revenue (million) Forecast, by Application 2019 & 2032
- Table 18: Canada High Speed Active Optical Cable Volume (K) Forecast, by Application 2019 & 2032
- Table 19: Mexico High Speed Active Optical Cable Revenue (million) Forecast, by Application 2019 & 2032
- Table 20: Mexico High Speed Active Optical Cable Volume (K) Forecast, by Application 2019 & 2032
- Table 21: Global High Speed Active Optical Cable Revenue million Forecast, by Application 2019 & 2032
- Table 22: Global High Speed Active Optical Cable Volume K Forecast, by Application 2019 & 2032
- Table 23: Global High Speed Active Optical Cable Revenue million Forecast, by Type 2019 & 2032
- Table 24: Global High Speed Active Optical Cable Volume K Forecast, by Type 2019 & 2032
- Table 25: Global High Speed Active Optical Cable Revenue million Forecast, by Country 2019 & 2032
- Table 26: Global High Speed Active Optical Cable Volume K Forecast, by Country 2019 & 2032
- Table 27: Brazil High Speed Active Optical Cable Revenue (million) Forecast, by Application 2019 & 2032
- Table 28: Brazil High Speed Active Optical Cable Volume (K) Forecast, by Application 2019 & 2032
- Table 29: Argentina High Speed Active Optical Cable Revenue (million) Forecast, by Application 2019 & 2032
- Table 30: Argentina High Speed Active Optical Cable Volume (K) Forecast, by Application 2019 & 2032
- Table 31: Rest of South America High Speed Active Optical Cable Revenue (million) Forecast, by Application 2019 & 2032
- Table 32: Rest of South America High Speed Active Optical Cable Volume (K) Forecast, by Application 2019 & 2032
- Table 33: Global High Speed Active Optical Cable Revenue million Forecast, by Application 2019 & 2032
- Table 34: Global High Speed Active Optical Cable Volume K Forecast, by Application 2019 & 2032
- Table 35: Global High Speed Active Optical Cable Revenue million Forecast, by Type 2019 & 2032
- Table 36: Global High Speed Active Optical Cable Volume K Forecast, by Type 2019 & 2032
- Table 37: Global High Speed Active Optical Cable Revenue million Forecast, by Country 2019 & 2032
- Table 38: Global High Speed Active Optical Cable Volume K Forecast, by Country 2019 & 2032
- Table 39: United Kingdom High Speed Active Optical Cable Revenue (million) Forecast, by Application 2019 & 2032
- Table 40: United Kingdom High Speed Active Optical Cable Volume (K) Forecast, by Application 2019 & 2032
- Table 41: Germany High Speed Active Optical Cable Revenue (million) Forecast, by Application 2019 & 2032
- Table 42: Germany High Speed Active Optical Cable Volume (K) Forecast, by Application 2019 & 2032
- Table 43: France High Speed Active Optical Cable Revenue (million) Forecast, by Application 2019 & 2032
- Table 44: France High Speed Active Optical Cable Volume (K) Forecast, by Application 2019 & 2032
- Table 45: Italy High Speed Active Optical Cable Revenue (million) Forecast, by Application 2019 & 2032
- Table 46: Italy High Speed Active Optical Cable Volume (K) Forecast, by Application 2019 & 2032
- Table 47: Spain High Speed Active Optical Cable Revenue (million) Forecast, by Application 2019 & 2032
- Table 48: Spain High Speed Active Optical Cable Volume (K) Forecast, by Application 2019 & 2032
- Table 49: Russia High Speed Active Optical Cable Revenue (million) Forecast, by Application 2019 & 2032
- Table 50: Russia High Speed Active Optical Cable Volume (K) Forecast, by Application 2019 & 2032
- Table 51: Benelux High Speed Active Optical Cable Revenue (million) Forecast, by Application 2019 & 2032
- Table 52: Benelux High Speed Active Optical Cable Volume (K) Forecast, by Application 2019 & 2032
- Table 53: Nordics High Speed Active Optical Cable Revenue (million) Forecast, by Application 2019 & 2032
- Table 54: Nordics High Speed Active Optical Cable Volume (K) Forecast, by Application 2019 & 2032
- Table 55: Rest of Europe High Speed Active Optical Cable Revenue (million) Forecast, by Application 2019 & 2032
- Table 56: Rest of Europe High Speed Active Optical Cable Volume (K) Forecast, by Application 2019 & 2032
- Table 57: Global High Speed Active Optical Cable Revenue million Forecast, by Application 2019 & 2032
- Table 58: Global High Speed Active Optical Cable Volume K Forecast, by Application 2019 & 2032
- Table 59: Global High Speed Active Optical Cable Revenue million Forecast, by Type 2019 & 2032
- Table 60: Global High Speed Active Optical Cable Volume K Forecast, by Type 2019 & 2032
- Table 61: Global High Speed Active Optical Cable Revenue million Forecast, by Country 2019 & 2032
- Table 62: Global High Speed Active Optical Cable Volume K Forecast, by Country 2019 & 2032
- Table 63: Turkey High Speed Active Optical Cable Revenue (million) Forecast, by Application 2019 & 2032
- Table 64: Turkey High Speed Active Optical Cable Volume (K) Forecast, by Application 2019 & 2032
- Table 65: Israel High Speed Active Optical Cable Revenue (million) Forecast, by Application 2019 & 2032
- Table 66: Israel High Speed Active Optical Cable Volume (K) Forecast, by Application 2019 & 2032
- Table 67: GCC High Speed Active Optical Cable Revenue (million) Forecast, by Application 2019 & 2032
- Table 68: GCC High Speed Active Optical Cable Volume (K) Forecast, by Application 2019 & 2032
- Table 69: North Africa High Speed Active Optical Cable Revenue (million) Forecast, by Application 2019 & 2032
- Table 70: North Africa High Speed Active Optical Cable Volume (K) Forecast, by Application 2019 & 2032
- Table 71: South Africa High Speed Active Optical Cable Revenue (million) Forecast, by Application 2019 & 2032
- Table 72: South Africa High Speed Active Optical Cable Volume (K) Forecast, by Application 2019 & 2032
- Table 73: Rest of Middle East & Africa High Speed Active Optical Cable Revenue (million) Forecast, by Application 2019 & 2032
- Table 74: Rest of Middle East & Africa High Speed Active Optical Cable Volume (K) Forecast, by Application 2019 & 2032
- Table 75: Global High Speed Active Optical Cable Revenue million Forecast, by Application 2019 & 2032
- Table 76: Global High Speed Active Optical Cable Volume K Forecast, by Application 2019 & 2032
- Table 77: Global High Speed Active Optical Cable Revenue million Forecast, by Type 2019 & 2032
- Table 78: Global High Speed Active Optical Cable Volume K Forecast, by Type 2019 & 2032
- Table 79: Global High Speed Active Optical Cable Revenue million Forecast, by Country 2019 & 2032
- Table 80: Global High Speed Active Optical Cable Volume K Forecast, by Country 2019 & 2032
- Table 81: China High Speed Active Optical Cable Revenue (million) Forecast, by Application 2019 & 2032
- Table 82: China High Speed Active Optical Cable Volume (K) Forecast, by Application 2019 & 2032
- Table 83: India High Speed Active Optical Cable Revenue (million) Forecast, by Application 2019 & 2032
- Table 84: India High Speed Active Optical Cable Volume (K) Forecast, by Application 2019 & 2032
- Table 85: Japan High Speed Active Optical Cable Revenue (million) Forecast, by Application 2019 & 2032
- Table 86: Japan High Speed Active Optical Cable Volume (K) Forecast, by Application 2019 & 2032
- Table 87: South Korea High Speed Active Optical Cable Revenue (million) Forecast, by Application 2019 & 2032
- Table 88: South Korea High Speed Active Optical Cable Volume (K) Forecast, by Application 2019 & 2032
- Table 89: ASEAN High Speed Active Optical Cable Revenue (million) Forecast, by Application 2019 & 2032
- Table 90: ASEAN High Speed Active Optical Cable Volume (K) Forecast, by Application 2019 & 2032
- Table 91: Oceania High Speed Active Optical Cable Revenue (million) Forecast, by Application 2019 & 2032
- Table 92: Oceania High Speed Active Optical Cable Volume (K) Forecast, by Application 2019 & 2032
- Table 93: Rest of Asia Pacific High Speed Active Optical Cable Revenue (million) Forecast, by Application 2019 & 2032
- Table 94: Rest of Asia Pacific High Speed Active Optical Cable Volume (K) Forecast, by Application 2019 & 2032
Frequently Asked Questions
1. What is the projected Compound Annual Growth Rate (CAGR) of the High Speed Active Optical Cable?
The projected CAGR is approximately XXX%.
2. Which companies are prominent players in the High Speed Active Optical Cable?
Key companies in the market include Hewtech, II-VI (Finisar), Siemon, Broadcom, Nvidia, Amphenol ICC, Molex, Optomind, Sanwa Tech, Leoni, Hitachi Cable, Fujikura, Sumitomo Electric, Sopto, Shenzhen Gigalight, EverPro Technologies.
3. What are the main segments of the High Speed Active Optical Cable?
The market segments include Application, Type.
4. Can you provide details about the market size?
The market size is estimated to be USD XXX million as of 2022.
5. What are some drivers contributing to market growth?
N/A
6. What are the notable trends driving market growth?
N/A
7. Are there any restraints impacting market growth?
N/A
8. Can you provide examples of recent developments in the market?
N/A
9. What pricing options are available for accessing the report?
Pricing options include single-user, multi-user, and enterprise licenses priced at USD 3950.00, USD 5925.00, and USD 7900.00 respectively.
10. Is the market size provided in terms of value or volume?
The market size is provided in terms of value, measured in million and volume, measured in K.
11. Are there any specific market keywords associated with the report?
Yes, the market keyword associated with the report is "High Speed Active Optical Cable," which aids in identifying and referencing the specific market segment covered.
12. How do I determine which pricing option suits my needs best?
The pricing options vary based on user requirements and access needs. Individual users may opt for single-user licenses, while businesses requiring broader access may choose multi-user or enterprise licenses for cost-effective access to the report.
13. Are there any additional resources or data provided in the High Speed Active Optical Cable report?
While the report offers comprehensive insights, it's advisable to review the specific contents or supplementary materials provided to ascertain if additional resources or data are available.
14. How can I stay updated on further developments or reports in the High Speed Active Optical Cable?
To stay informed about further developments, trends, and reports in the High Speed Active Optical Cable, consider subscribing to industry newsletters, following relevant companies and organizations, or regularly checking reputable industry news sources and publications.
Methodology
Step 1 - Identification of Relevant Samples Size from Population Database


Step 2 - Approaches for Defining Global Market Size (Value, Volume* & Price*)

Note*: In applicable scenarios
Step 3 - Data Sources
Primary Research
- Web Analytics
- Survey Reports
- Research Institute
- Latest Research Reports
- Opinion Leaders
Secondary Research
- Annual Reports
- White Paper
- Latest Press Release
- Industry Association
- Paid Database
- Investor Presentations

Step 4 - Data Triangulation
Involves using different sources of information in order to increase the validity of a study
These sources are likely to be stakeholders in a program - participants, other researchers, program staff, other community members, and so on.
Then we put all data in single framework & apply various statistical tools to find out the dynamic on the market.
During the analysis stage, feedback from the stakeholder groups would be compared to determine areas of agreement as well as areas of divergence


