
Key Insights
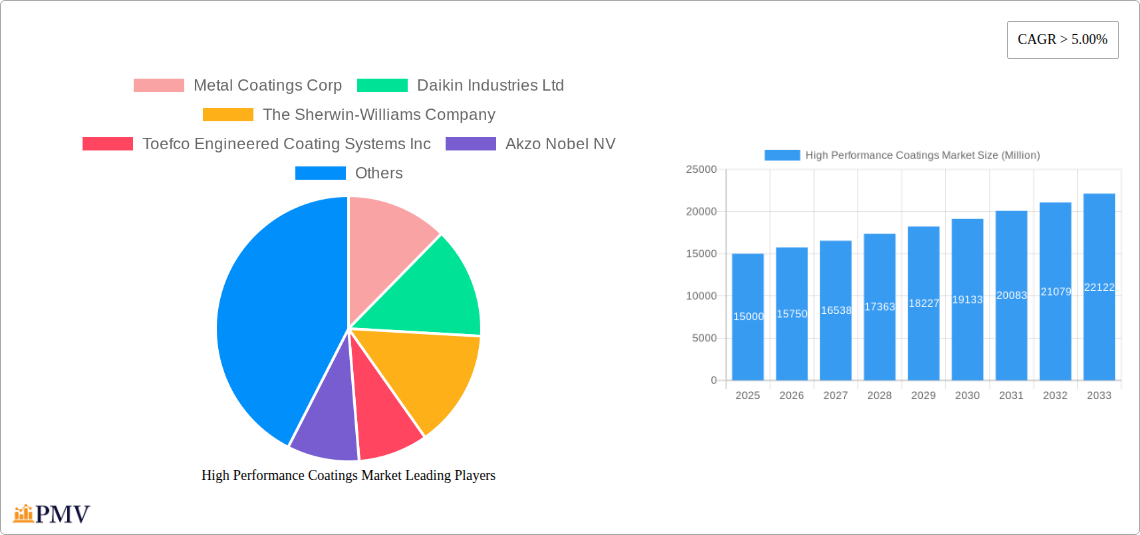
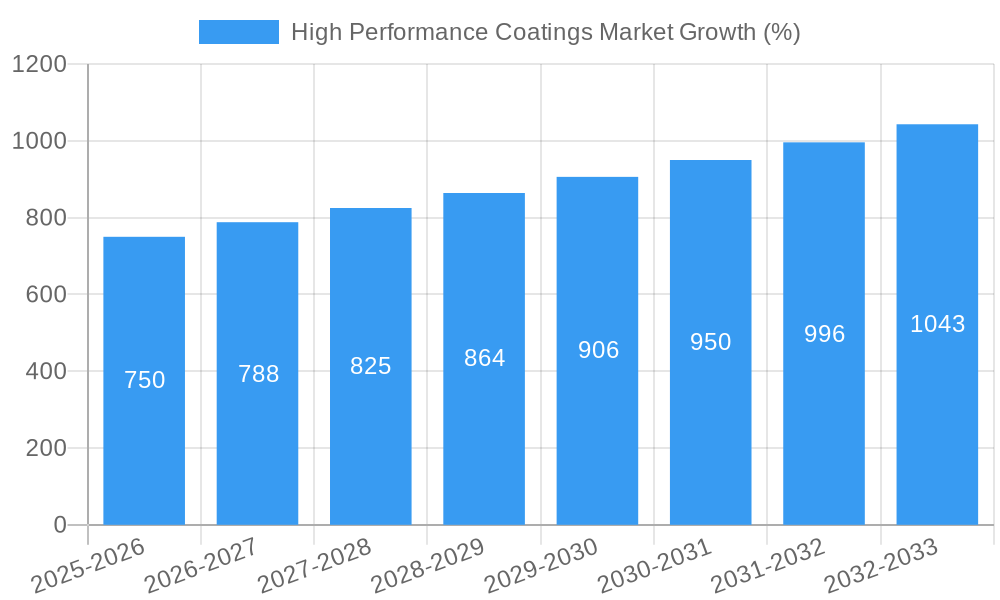
The high-performance coatings market is experiencing robust growth, projected to maintain a CAGR exceeding 5% from 2025 to 2033. This expansion is driven by several key factors. Firstly, the increasing demand for durable and protective coatings across diverse end-use industries, particularly building and construction, automotive, and aerospace & defense, is a significant contributor. These industries require coatings that offer superior resistance to corrosion, abrasion, and extreme weather conditions, fueling the adoption of high-performance solutions. Secondly, advancements in coating technologies, such as the development of water-based and powder-based coatings, are promoting sustainable practices and improving overall performance characteristics. This shift towards environmentally friendly options is further boosted by stringent environmental regulations worldwide. Finally, the rising disposable income in developing economies, coupled with increased infrastructure spending, is expanding the market's addressable base, especially in regions like Asia-Pacific. Key players like Sherwin-Williams, Akzo Nobel, and PPG Industries are leveraging these trends through strategic investments in R&D and expansion into emerging markets.
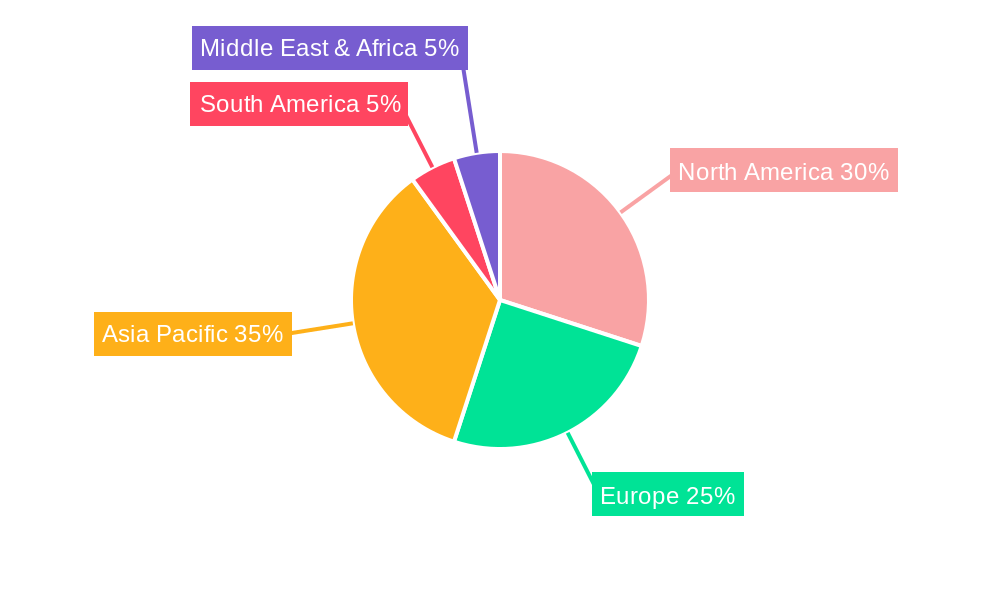
The market segmentation reveals a diverse landscape. Epoxy, polyurethane, and fluoropolymer coatings dominate the types segment due to their superior performance attributes. Solvent-based coatings currently hold a larger market share than water-based or powder-based coatings, but the latter two are gaining traction due to environmental concerns and evolving regulatory frameworks. Geographically, the Asia-Pacific region, particularly China and India, is expected to witness the most significant growth due to rapid industrialization and urbanization. North America and Europe maintain substantial market shares driven by established industries and robust infrastructure development. However, the market faces certain restraints, including fluctuating raw material prices and the potential for technological disruptions. Despite these challenges, the overall market outlook remains positive, indicating substantial growth opportunities for existing and new players alike.
High Performance Coatings Market: A Comprehensive Report (2019-2033)
This comprehensive report provides an in-depth analysis of the High Performance Coatings market, offering valuable insights for stakeholders across the value chain. Covering the period from 2019 to 2033, with a base year of 2025 and a forecast period of 2025-2033, this report delivers a granular understanding of market dynamics, competitive landscape, and future growth prospects. The study encompasses detailed segmentation by coating technology (Solvent-based, Water-based, Powder-based), end-user industry (Building and Construction, Automotive and Transportation, Industrial, Aerospace & Defense, Marine, Other End-user Industries), and type (Epoxy, Silicon, Polyester, Acrylic, Alkyd, Polyurethane, Fluoropolymer, Other Types (Polyether Sulfone (PES), Vinyl-Ester, etc.)
High Performance Coatings Market Market Structure & Competitive Dynamics
The High Performance Coatings market exhibits a moderately consolidated structure, with several key players holding significant market share. The market concentration is influenced by factors such as technological advancements, economies of scale, and strong brand recognition. Innovation plays a crucial role, with companies constantly investing in R&D to develop new coatings with enhanced performance characteristics. Regulatory frameworks, particularly those concerning environmental regulations and VOC emissions, significantly impact market dynamics. The presence of substitute materials, such as advanced composites, presents a competitive challenge. End-user trends, particularly the increasing demand for sustainable and high-performance coatings in diverse sectors, are driving market growth. M&A activities have been observed, with deal values reaching xx Million in recent years, primarily focused on expanding product portfolios and geographic reach. Key players include Metal Coatings Corp, Daikin Industries Ltd, The Sherwin-Williams Company, Toefco Engineered Coating Systems Inc, Akzo Nobel NV, PPG Industries Inc, Beckers Group, Nippon Paint Holdings Co Ltd, Kansai Nerolac Paints Limited, Endura Coatings LLC, The Chemours Company, Hempel Group, AFT Fluorotec Ltd, and others. Market share analysis reveals that the top five players collectively hold approximately xx% of the market share, indicating the presence of both large multinational corporations and specialized niche players.
- Market Concentration: Moderately Consolidated
- Innovation Ecosystem: Highly Active
- Regulatory Framework: Stringent Environmental Regulations
- Product Substitutes: Advanced Composites
- M&A Activity: Significant, with deal values reaching xx Million annually (2023-2024).
High Performance Coatings Market Industry Trends & Insights
The High Performance Coatings market is experiencing robust growth, driven by several key factors. The rising demand for durable, aesthetically pleasing, and environmentally friendly coatings across various end-user industries is a major contributor. The global CAGR is estimated at xx% during the forecast period (2025-2033). Technological advancements, such as the development of nanotechnology-enabled coatings and water-based alternatives, are transforming the market landscape. Consumer preferences are shifting towards sustainable and eco-friendly solutions, leading to increased demand for low-VOC coatings. The competitive landscape is marked by intense competition, with companies focusing on product innovation, strategic partnerships, and expansion into new markets to gain a competitive edge. Market penetration of water-based coatings is increasing steadily, currently reaching approximately xx%, and expected to reach xx% by 2033.
Dominant Markets & Segments in High Performance Coatings Market
The Building and Construction sector currently represents the largest end-user segment, accounting for approximately xx% of the total market value in 2025, driven by significant infrastructure development globally. Within coating technologies, water-based coatings are experiencing the fastest growth, owing to their environmental benefits and increasing regulatory compliance requirements. Geographically, the Asia-Pacific region shows significant potential due to rapid industrialization and urbanization. The Epoxy type dominates market share due to its superior performance characteristics in various applications.
- Key Drivers for Building & Construction: Robust infrastructure spending, increasing urbanization, and government initiatives promoting sustainable construction practices.
- Key Drivers for Water-based Coatings: Stringent environmental regulations, growing health consciousness, and technological advancements leading to improved performance.
- Key Drivers for Asia-Pacific Region: Rapid industrialization, expanding infrastructure projects, and rising disposable incomes.
- Key Drivers for Epoxy Coatings: Superior chemical resistance, durability, and adhesion properties.
High Performance Coatings Market Product Innovations
Recent product innovations focus on enhancing performance characteristics, such as improved corrosion resistance, enhanced durability, and self-cleaning properties. The incorporation of nanotechnology and bio-based materials is gaining traction. New applications are being explored, particularly in areas such as smart coatings with embedded sensors and self-healing capabilities. These innovations cater to the growing demand for sustainable and high-performance solutions in diverse applications, creating a competitive advantage for manufacturers.
Report Segmentation & Scope
This report segments the High Performance Coatings market by coating technology (Solvent-based, Water-based, Powder-based), end-user industry (Building and Construction, Automotive and Transportation, Industrial, Aerospace & Defense, Marine, Other End-user Industries), and type (Epoxy, Silicon, Polyester, Acrylic, Alkyd, Polyurethane, Fluoropolymer, Other Types). Each segment's growth projections, market size (in Million), and competitive dynamics are analyzed in detail, providing a comprehensive view of the market's structure and future trends. For example, the water-based segment is expected to experience a CAGR of xx% during the forecast period, driven by stricter environmental regulations.
Key Drivers of High Performance Coatings Market Growth
Several factors drive the growth of the High Performance Coatings market. Technological advancements, such as the development of innovative coating formulations with enhanced properties (e.g., improved durability and corrosion resistance), play a significant role. The increasing demand from key end-use industries like automotive and construction fuels market growth. Government regulations promoting sustainable and eco-friendly coatings further incentivize adoption.
Challenges in the High Performance Coatings Market Sector
The High Performance Coatings market faces challenges like volatile raw material prices, impacting production costs. Stringent environmental regulations require manufacturers to adapt to new standards, increasing compliance costs. Competition among established players is intense, making it challenging for new entrants. Supply chain disruptions can affect production and delivery timelines.
Leading Players in the High Performance Coatings Market Market
- Metal Coatings Corp
- Daikin Industries Ltd
- The Sherwin-Williams Company
- Toefco Engineered Coating Systems Inc
- Akzo Nobel NV
- PPG Industries Inc
- Beckers Group
- Nippon Paint Holdings Co Ltd
- Kansai Nerolac Paints Limited
- Endura Coatings LLC
- The Chemours Company
- Hempel Group
- AFT Fluorotec Ltd
Key Developments in High Performance Coatings Market Sector
- Q1 2023: Akzo Nobel launched a new line of sustainable water-based coatings.
- Q3 2022: PPG Industries acquired a smaller coating manufacturer, expanding its product portfolio.
- 2021: Several key players invested heavily in R&D focusing on nanotechnology-based coatings.
Strategic High Performance Coatings Market Market Outlook
The High Performance Coatings market presents significant growth potential in the coming years. Continued investment in R&D, focus on sustainability, and expansion into new geographic markets will drive future growth. Strategic partnerships and acquisitions will shape the competitive landscape. The increasing demand for high-performance coatings in emerging economies presents a lucrative opportunity for market players.
High Performance Coatings Market Segmentation
-
1. Type
- 1.1. Epoxy
- 1.2. Silicon
- 1.3. Polyester
- 1.4. Acrylic
- 1.5. Alkyd
- 1.6. Polyurethane
- 1.7. Fluoropolymer
- 1.8. Other Ty
-
2. Coating Technology
- 2.1. Solvent-based
- 2.2. Water-based
- 2.3. Powder-based
-
3. End-user Industry
- 3.1. Building and Construction
- 3.2. Automotive and Transportation
- 3.3. Industrial
- 3.4. Aerospace & Defense
- 3.5. Marine
- 3.6. Other End- user Industries
High Performance Coatings Market Segmentation By Geography
-
1. Asia Pacific
- 1.1. China
- 1.2. India
- 1.3. Japan
- 1.4. South Korea
- 1.5. Rest of Asia Pacific
-
2. North America
- 2.1. United States
- 2.2. Canada
- 2.3. Mexico
-
3. Europe
- 3.1. Germany
- 3.2. United Kingdom
- 3.3. Italy
- 3.4. France
- 3.5. Rest of Europe
-
4. South America
- 4.1. Brazil
- 4.2. Argentina
- 4.3. Rest of South America
- 5. Middle East
-
6. Saudi Arabia
- 6.1. South Africa
- 6.2. Rest of Middle East
High Performance Coatings Market REPORT HIGHLIGHTS
| Aspects | Details |
|---|---|
| Study Period | 2019-2033 |
| Base Year | 2024 |
| Estimated Year | 2025 |
| Forecast Period | 2025-2033 |
| Historical Period | 2019-2024 |
| Growth Rate | CAGR of > 5.00% from 2019-2033 |
| Segmentation |
|
Table of Contents
- 1. Introduction
- 1.1. Research Scope
- 1.2. Market Segmentation
- 1.3. Research Methodology
- 1.4. Definitions and Assumptions
- 2. Executive Summary
- 2.1. Introduction
- 3. Market Dynamics
- 3.1. Introduction
- 3.2. Market Drivers
- 3.2.1. ; Increasing Construction Activities in the United States and Asia-Pacific; Other Drivers
- 3.3. Market Restrains
- 3.3.1. ; Solvent-based Adhesives are being Phased Out to Reduce VOC Emissions; Other Restraints
- 3.4. Market Trends
- 3.4.1. Growing Demand from Building & Construction Industry
- 4. Market Factor Analysis
- 4.1. Porters Five Forces
- 4.2. Supply/Value Chain
- 4.3. PESTEL analysis
- 4.4. Market Entropy
- 4.5. Patent/Trademark Analysis
- 5. Global High Performance Coatings Market Analysis, Insights and Forecast, 2019-2031
- 5.1. Market Analysis, Insights and Forecast - by Type
- 5.1.1. Epoxy
- 5.1.2. Silicon
- 5.1.3. Polyester
- 5.1.4. Acrylic
- 5.1.5. Alkyd
- 5.1.6. Polyurethane
- 5.1.7. Fluoropolymer
- 5.1.8. Other Ty
- 5.2. Market Analysis, Insights and Forecast - by Coating Technology
- 5.2.1. Solvent-based
- 5.2.2. Water-based
- 5.2.3. Powder-based
- 5.3. Market Analysis, Insights and Forecast - by End-user Industry
- 5.3.1. Building and Construction
- 5.3.2. Automotive and Transportation
- 5.3.3. Industrial
- 5.3.4. Aerospace & Defense
- 5.3.5. Marine
- 5.3.6. Other End- user Industries
- 5.4. Market Analysis, Insights and Forecast - by Region
- 5.4.1. Asia Pacific
- 5.4.2. North America
- 5.4.3. Europe
- 5.4.4. South America
- 5.4.5. Middle East
- 5.4.6. Saudi Arabia
- 5.1. Market Analysis, Insights and Forecast - by Type
- 6. Asia Pacific High Performance Coatings Market Analysis, Insights and Forecast, 2019-2031
- 6.1. Market Analysis, Insights and Forecast - by Type
- 6.1.1. Epoxy
- 6.1.2. Silicon
- 6.1.3. Polyester
- 6.1.4. Acrylic
- 6.1.5. Alkyd
- 6.1.6. Polyurethane
- 6.1.7. Fluoropolymer
- 6.1.8. Other Ty
- 6.2. Market Analysis, Insights and Forecast - by Coating Technology
- 6.2.1. Solvent-based
- 6.2.2. Water-based
- 6.2.3. Powder-based
- 6.3. Market Analysis, Insights and Forecast - by End-user Industry
- 6.3.1. Building and Construction
- 6.3.2. Automotive and Transportation
- 6.3.3. Industrial
- 6.3.4. Aerospace & Defense
- 6.3.5. Marine
- 6.3.6. Other End- user Industries
- 6.1. Market Analysis, Insights and Forecast - by Type
- 7. North America High Performance Coatings Market Analysis, Insights and Forecast, 2019-2031
- 7.1. Market Analysis, Insights and Forecast - by Type
- 7.1.1. Epoxy
- 7.1.2. Silicon
- 7.1.3. Polyester
- 7.1.4. Acrylic
- 7.1.5. Alkyd
- 7.1.6. Polyurethane
- 7.1.7. Fluoropolymer
- 7.1.8. Other Ty
- 7.2. Market Analysis, Insights and Forecast - by Coating Technology
- 7.2.1. Solvent-based
- 7.2.2. Water-based
- 7.2.3. Powder-based
- 7.3. Market Analysis, Insights and Forecast - by End-user Industry
- 7.3.1. Building and Construction
- 7.3.2. Automotive and Transportation
- 7.3.3. Industrial
- 7.3.4. Aerospace & Defense
- 7.3.5. Marine
- 7.3.6. Other End- user Industries
- 7.1. Market Analysis, Insights and Forecast - by Type
- 8. Europe High Performance Coatings Market Analysis, Insights and Forecast, 2019-2031
- 8.1. Market Analysis, Insights and Forecast - by Type
- 8.1.1. Epoxy
- 8.1.2. Silicon
- 8.1.3. Polyester
- 8.1.4. Acrylic
- 8.1.5. Alkyd
- 8.1.6. Polyurethane
- 8.1.7. Fluoropolymer
- 8.1.8. Other Ty
- 8.2. Market Analysis, Insights and Forecast - by Coating Technology
- 8.2.1. Solvent-based
- 8.2.2. Water-based
- 8.2.3. Powder-based
- 8.3. Market Analysis, Insights and Forecast - by End-user Industry
- 8.3.1. Building and Construction
- 8.3.2. Automotive and Transportation
- 8.3.3. Industrial
- 8.3.4. Aerospace & Defense
- 8.3.5. Marine
- 8.3.6. Other End- user Industries
- 8.1. Market Analysis, Insights and Forecast - by Type
- 9. South America High Performance Coatings Market Analysis, Insights and Forecast, 2019-2031
- 9.1. Market Analysis, Insights and Forecast - by Type
- 9.1.1. Epoxy
- 9.1.2. Silicon
- 9.1.3. Polyester
- 9.1.4. Acrylic
- 9.1.5. Alkyd
- 9.1.6. Polyurethane
- 9.1.7. Fluoropolymer
- 9.1.8. Other Ty
- 9.2. Market Analysis, Insights and Forecast - by Coating Technology
- 9.2.1. Solvent-based
- 9.2.2. Water-based
- 9.2.3. Powder-based
- 9.3. Market Analysis, Insights and Forecast - by End-user Industry
- 9.3.1. Building and Construction
- 9.3.2. Automotive and Transportation
- 9.3.3. Industrial
- 9.3.4. Aerospace & Defense
- 9.3.5. Marine
- 9.3.6. Other End- user Industries
- 9.1. Market Analysis, Insights and Forecast - by Type
- 10. Middle East High Performance Coatings Market Analysis, Insights and Forecast, 2019-2031
- 10.1. Market Analysis, Insights and Forecast - by Type
- 10.1.1. Epoxy
- 10.1.2. Silicon
- 10.1.3. Polyester
- 10.1.4. Acrylic
- 10.1.5. Alkyd
- 10.1.6. Polyurethane
- 10.1.7. Fluoropolymer
- 10.1.8. Other Ty
- 10.2. Market Analysis, Insights and Forecast - by Coating Technology
- 10.2.1. Solvent-based
- 10.2.2. Water-based
- 10.2.3. Powder-based
- 10.3. Market Analysis, Insights and Forecast - by End-user Industry
- 10.3.1. Building and Construction
- 10.3.2. Automotive and Transportation
- 10.3.3. Industrial
- 10.3.4. Aerospace & Defense
- 10.3.5. Marine
- 10.3.6. Other End- user Industries
- 10.1. Market Analysis, Insights and Forecast - by Type
- 11. Saudi Arabia High Performance Coatings Market Analysis, Insights and Forecast, 2019-2031
- 11.1. Market Analysis, Insights and Forecast - by Type
- 11.1.1. Epoxy
- 11.1.2. Silicon
- 11.1.3. Polyester
- 11.1.4. Acrylic
- 11.1.5. Alkyd
- 11.1.6. Polyurethane
- 11.1.7. Fluoropolymer
- 11.1.8. Other Ty
- 11.2. Market Analysis, Insights and Forecast - by Coating Technology
- 11.2.1. Solvent-based
- 11.2.2. Water-based
- 11.2.3. Powder-based
- 11.3. Market Analysis, Insights and Forecast - by End-user Industry
- 11.3.1. Building and Construction
- 11.3.2. Automotive and Transportation
- 11.3.3. Industrial
- 11.3.4. Aerospace & Defense
- 11.3.5. Marine
- 11.3.6. Other End- user Industries
- 11.1. Market Analysis, Insights and Forecast - by Type
- 12. Asia Pacific High Performance Coatings Market Analysis, Insights and Forecast, 2019-2031
- 12.1. Market Analysis, Insights and Forecast - By Country/Sub-region
- 12.1.1 China
- 12.1.2 India
- 12.1.3 Japan
- 12.1.4 South Korea
- 12.1.5 Rest of Asia Pacific
- 13. North America High Performance Coatings Market Analysis, Insights and Forecast, 2019-2031
- 13.1. Market Analysis, Insights and Forecast - By Country/Sub-region
- 13.1.1 United States
- 13.1.2 Canada
- 13.1.3 Mexico
- 14. Europe High Performance Coatings Market Analysis, Insights and Forecast, 2019-2031
- 14.1. Market Analysis, Insights and Forecast - By Country/Sub-region
- 14.1.1 Germany
- 14.1.2 United Kingdom
- 14.1.3 Italy
- 14.1.4 France
- 14.1.5 Rest of Europe
- 15. South America High Performance Coatings Market Analysis, Insights and Forecast, 2019-2031
- 15.1. Market Analysis, Insights and Forecast - By Country/Sub-region
- 15.1.1 Brazil
- 15.1.2 Argentina
- 15.1.3 Rest of South America
- 16. Middle East High Performance Coatings Market Analysis, Insights and Forecast, 2019-2031
- 16.1. Market Analysis, Insights and Forecast - By Country/Sub-region
- 16.1.1 Middle East
- 16.1.2 Africa
- 17. Saudi Arabia High Performance Coatings Market Analysis, Insights and Forecast, 2019-2031
- 17.1. Market Analysis, Insights and Forecast - By Country/Sub-region
- 17.1.1 South Africa
- 17.1.2 Rest of Middle East
- 18. Competitive Analysis
- 18.1. Global Market Share Analysis 2024
- 18.2. Company Profiles
- 18.2.1 Metal Coatings Corp
- 18.2.1.1. Overview
- 18.2.1.2. Products
- 18.2.1.3. SWOT Analysis
- 18.2.1.4. Recent Developments
- 18.2.1.5. Financials (Based on Availability)
- 18.2.2 Daikin Industries Ltd
- 18.2.2.1. Overview
- 18.2.2.2. Products
- 18.2.2.3. SWOT Analysis
- 18.2.2.4. Recent Developments
- 18.2.2.5. Financials (Based on Availability)
- 18.2.3 The Sherwin-Williams Company
- 18.2.3.1. Overview
- 18.2.3.2. Products
- 18.2.3.3. SWOT Analysis
- 18.2.3.4. Recent Developments
- 18.2.3.5. Financials (Based on Availability)
- 18.2.4 Toefco Engineered Coating Systems Inc
- 18.2.4.1. Overview
- 18.2.4.2. Products
- 18.2.4.3. SWOT Analysis
- 18.2.4.4. Recent Developments
- 18.2.4.5. Financials (Based on Availability)
- 18.2.5 Akzo Nobel NV
- 18.2.5.1. Overview
- 18.2.5.2. Products
- 18.2.5.3. SWOT Analysis
- 18.2.5.4. Recent Developments
- 18.2.5.5. Financials (Based on Availability)
- 18.2.6 PPG Industries Inc
- 18.2.6.1. Overview
- 18.2.6.2. Products
- 18.2.6.3. SWOT Analysis
- 18.2.6.4. Recent Developments
- 18.2.6.5. Financials (Based on Availability)
- 18.2.7 Beckers Group
- 18.2.7.1. Overview
- 18.2.7.2. Products
- 18.2.7.3. SWOT Analysis
- 18.2.7.4. Recent Developments
- 18.2.7.5. Financials (Based on Availability)
- 18.2.8 Nippon Paint Holdings Co Ltd
- 18.2.8.1. Overview
- 18.2.8.2. Products
- 18.2.8.3. SWOT Analysis
- 18.2.8.4. Recent Developments
- 18.2.8.5. Financials (Based on Availability)
- 18.2.9 Kansai Nerolac Paints Limited
- 18.2.9.1. Overview
- 18.2.9.2. Products
- 18.2.9.3. SWOT Analysis
- 18.2.9.4. Recent Developments
- 18.2.9.5. Financials (Based on Availability)
- 18.2.10 Endura Coatings LLC
- 18.2.10.1. Overview
- 18.2.10.2. Products
- 18.2.10.3. SWOT Analysis
- 18.2.10.4. Recent Developments
- 18.2.10.5. Financials (Based on Availability)
- 18.2.11 The Chemours Company
- 18.2.11.1. Overview
- 18.2.11.2. Products
- 18.2.11.3. SWOT Analysis
- 18.2.11.4. Recent Developments
- 18.2.11.5. Financials (Based on Availability)
- 18.2.12 Hempel Group*List Not Exhaustive
- 18.2.12.1. Overview
- 18.2.12.2. Products
- 18.2.12.3. SWOT Analysis
- 18.2.12.4. Recent Developments
- 18.2.12.5. Financials (Based on Availability)
- 18.2.13 AFT Fluorotec Ltd
- 18.2.13.1. Overview
- 18.2.13.2. Products
- 18.2.13.3. SWOT Analysis
- 18.2.13.4. Recent Developments
- 18.2.13.5. Financials (Based on Availability)
- 18.2.1 Metal Coatings Corp
List of Figures
- Figure 1: Global High Performance Coatings Market Revenue Breakdown (Million, %) by Region 2024 & 2032
- Figure 2: Global High Performance Coatings Market Volume Breakdown (liter , %) by Region 2024 & 2032
- Figure 3: Asia Pacific High Performance Coatings Market Revenue (Million), by Country 2024 & 2032
- Figure 4: Asia Pacific High Performance Coatings Market Volume (liter ), by Country 2024 & 2032
- Figure 5: Asia Pacific High Performance Coatings Market Revenue Share (%), by Country 2024 & 2032
- Figure 6: Asia Pacific High Performance Coatings Market Volume Share (%), by Country 2024 & 2032
- Figure 7: North America High Performance Coatings Market Revenue (Million), by Country 2024 & 2032
- Figure 8: North America High Performance Coatings Market Volume (liter ), by Country 2024 & 2032
- Figure 9: North America High Performance Coatings Market Revenue Share (%), by Country 2024 & 2032
- Figure 10: North America High Performance Coatings Market Volume Share (%), by Country 2024 & 2032
- Figure 11: Europe High Performance Coatings Market Revenue (Million), by Country 2024 & 2032
- Figure 12: Europe High Performance Coatings Market Volume (liter ), by Country 2024 & 2032
- Figure 13: Europe High Performance Coatings Market Revenue Share (%), by Country 2024 & 2032
- Figure 14: Europe High Performance Coatings Market Volume Share (%), by Country 2024 & 2032
- Figure 15: South America High Performance Coatings Market Revenue (Million), by Country 2024 & 2032
- Figure 16: South America High Performance Coatings Market Volume (liter ), by Country 2024 & 2032
- Figure 17: South America High Performance Coatings Market Revenue Share (%), by Country 2024 & 2032
- Figure 18: South America High Performance Coatings Market Volume Share (%), by Country 2024 & 2032
- Figure 19: Middle East High Performance Coatings Market Revenue (Million), by Country 2024 & 2032
- Figure 20: Middle East High Performance Coatings Market Volume (liter ), by Country 2024 & 2032
- Figure 21: Middle East High Performance Coatings Market Revenue Share (%), by Country 2024 & 2032
- Figure 22: Middle East High Performance Coatings Market Volume Share (%), by Country 2024 & 2032
- Figure 23: Saudi Arabia High Performance Coatings Market Revenue (Million), by Country 2024 & 2032
- Figure 24: Saudi Arabia High Performance Coatings Market Volume (liter ), by Country 2024 & 2032
- Figure 25: Saudi Arabia High Performance Coatings Market Revenue Share (%), by Country 2024 & 2032
- Figure 26: Saudi Arabia High Performance Coatings Market Volume Share (%), by Country 2024 & 2032
- Figure 27: Asia Pacific High Performance Coatings Market Revenue (Million), by Type 2024 & 2032
- Figure 28: Asia Pacific High Performance Coatings Market Volume (liter ), by Type 2024 & 2032
- Figure 29: Asia Pacific High Performance Coatings Market Revenue Share (%), by Type 2024 & 2032
- Figure 30: Asia Pacific High Performance Coatings Market Volume Share (%), by Type 2024 & 2032
- Figure 31: Asia Pacific High Performance Coatings Market Revenue (Million), by Coating Technology 2024 & 2032
- Figure 32: Asia Pacific High Performance Coatings Market Volume (liter ), by Coating Technology 2024 & 2032
- Figure 33: Asia Pacific High Performance Coatings Market Revenue Share (%), by Coating Technology 2024 & 2032
- Figure 34: Asia Pacific High Performance Coatings Market Volume Share (%), by Coating Technology 2024 & 2032
- Figure 35: Asia Pacific High Performance Coatings Market Revenue (Million), by End-user Industry 2024 & 2032
- Figure 36: Asia Pacific High Performance Coatings Market Volume (liter ), by End-user Industry 2024 & 2032
- Figure 37: Asia Pacific High Performance Coatings Market Revenue Share (%), by End-user Industry 2024 & 2032
- Figure 38: Asia Pacific High Performance Coatings Market Volume Share (%), by End-user Industry 2024 & 2032
- Figure 39: Asia Pacific High Performance Coatings Market Revenue (Million), by Country 2024 & 2032
- Figure 40: Asia Pacific High Performance Coatings Market Volume (liter ), by Country 2024 & 2032
- Figure 41: Asia Pacific High Performance Coatings Market Revenue Share (%), by Country 2024 & 2032
- Figure 42: Asia Pacific High Performance Coatings Market Volume Share (%), by Country 2024 & 2032
- Figure 43: North America High Performance Coatings Market Revenue (Million), by Type 2024 & 2032
- Figure 44: North America High Performance Coatings Market Volume (liter ), by Type 2024 & 2032
- Figure 45: North America High Performance Coatings Market Revenue Share (%), by Type 2024 & 2032
- Figure 46: North America High Performance Coatings Market Volume Share (%), by Type 2024 & 2032
- Figure 47: North America High Performance Coatings Market Revenue (Million), by Coating Technology 2024 & 2032
- Figure 48: North America High Performance Coatings Market Volume (liter ), by Coating Technology 2024 & 2032
- Figure 49: North America High Performance Coatings Market Revenue Share (%), by Coating Technology 2024 & 2032
- Figure 50: North America High Performance Coatings Market Volume Share (%), by Coating Technology 2024 & 2032
- Figure 51: North America High Performance Coatings Market Revenue (Million), by End-user Industry 2024 & 2032
- Figure 52: North America High Performance Coatings Market Volume (liter ), by End-user Industry 2024 & 2032
- Figure 53: North America High Performance Coatings Market Revenue Share (%), by End-user Industry 2024 & 2032
- Figure 54: North America High Performance Coatings Market Volume Share (%), by End-user Industry 2024 & 2032
- Figure 55: North America High Performance Coatings Market Revenue (Million), by Country 2024 & 2032
- Figure 56: North America High Performance Coatings Market Volume (liter ), by Country 2024 & 2032
- Figure 57: North America High Performance Coatings Market Revenue Share (%), by Country 2024 & 2032
- Figure 58: North America High Performance Coatings Market Volume Share (%), by Country 2024 & 2032
- Figure 59: Europe High Performance Coatings Market Revenue (Million), by Type 2024 & 2032
- Figure 60: Europe High Performance Coatings Market Volume (liter ), by Type 2024 & 2032
- Figure 61: Europe High Performance Coatings Market Revenue Share (%), by Type 2024 & 2032
- Figure 62: Europe High Performance Coatings Market Volume Share (%), by Type 2024 & 2032
- Figure 63: Europe High Performance Coatings Market Revenue (Million), by Coating Technology 2024 & 2032
- Figure 64: Europe High Performance Coatings Market Volume (liter ), by Coating Technology 2024 & 2032
- Figure 65: Europe High Performance Coatings Market Revenue Share (%), by Coating Technology 2024 & 2032
- Figure 66: Europe High Performance Coatings Market Volume Share (%), by Coating Technology 2024 & 2032
- Figure 67: Europe High Performance Coatings Market Revenue (Million), by End-user Industry 2024 & 2032
- Figure 68: Europe High Performance Coatings Market Volume (liter ), by End-user Industry 2024 & 2032
- Figure 69: Europe High Performance Coatings Market Revenue Share (%), by End-user Industry 2024 & 2032
- Figure 70: Europe High Performance Coatings Market Volume Share (%), by End-user Industry 2024 & 2032
- Figure 71: Europe High Performance Coatings Market Revenue (Million), by Country 2024 & 2032
- Figure 72: Europe High Performance Coatings Market Volume (liter ), by Country 2024 & 2032
- Figure 73: Europe High Performance Coatings Market Revenue Share (%), by Country 2024 & 2032
- Figure 74: Europe High Performance Coatings Market Volume Share (%), by Country 2024 & 2032
- Figure 75: South America High Performance Coatings Market Revenue (Million), by Type 2024 & 2032
- Figure 76: South America High Performance Coatings Market Volume (liter ), by Type 2024 & 2032
- Figure 77: South America High Performance Coatings Market Revenue Share (%), by Type 2024 & 2032
- Figure 78: South America High Performance Coatings Market Volume Share (%), by Type 2024 & 2032
- Figure 79: South America High Performance Coatings Market Revenue (Million), by Coating Technology 2024 & 2032
- Figure 80: South America High Performance Coatings Market Volume (liter ), by Coating Technology 2024 & 2032
- Figure 81: South America High Performance Coatings Market Revenue Share (%), by Coating Technology 2024 & 2032
- Figure 82: South America High Performance Coatings Market Volume Share (%), by Coating Technology 2024 & 2032
- Figure 83: South America High Performance Coatings Market Revenue (Million), by End-user Industry 2024 & 2032
- Figure 84: South America High Performance Coatings Market Volume (liter ), by End-user Industry 2024 & 2032
- Figure 85: South America High Performance Coatings Market Revenue Share (%), by End-user Industry 2024 & 2032
- Figure 86: South America High Performance Coatings Market Volume Share (%), by End-user Industry 2024 & 2032
- Figure 87: South America High Performance Coatings Market Revenue (Million), by Country 2024 & 2032
- Figure 88: South America High Performance Coatings Market Volume (liter ), by Country 2024 & 2032
- Figure 89: South America High Performance Coatings Market Revenue Share (%), by Country 2024 & 2032
- Figure 90: South America High Performance Coatings Market Volume Share (%), by Country 2024 & 2032
- Figure 91: Middle East High Performance Coatings Market Revenue (Million), by Type 2024 & 2032
- Figure 92: Middle East High Performance Coatings Market Volume (liter ), by Type 2024 & 2032
- Figure 93: Middle East High Performance Coatings Market Revenue Share (%), by Type 2024 & 2032
- Figure 94: Middle East High Performance Coatings Market Volume Share (%), by Type 2024 & 2032
- Figure 95: Middle East High Performance Coatings Market Revenue (Million), by Coating Technology 2024 & 2032
- Figure 96: Middle East High Performance Coatings Market Volume (liter ), by Coating Technology 2024 & 2032
- Figure 97: Middle East High Performance Coatings Market Revenue Share (%), by Coating Technology 2024 & 2032
- Figure 98: Middle East High Performance Coatings Market Volume Share (%), by Coating Technology 2024 & 2032
- Figure 99: Middle East High Performance Coatings Market Revenue (Million), by End-user Industry 2024 & 2032
- Figure 100: Middle East High Performance Coatings Market Volume (liter ), by End-user Industry 2024 & 2032
- Figure 101: Middle East High Performance Coatings Market Revenue Share (%), by End-user Industry 2024 & 2032
- Figure 102: Middle East High Performance Coatings Market Volume Share (%), by End-user Industry 2024 & 2032
- Figure 103: Middle East High Performance Coatings Market Revenue (Million), by Country 2024 & 2032
- Figure 104: Middle East High Performance Coatings Market Volume (liter ), by Country 2024 & 2032
- Figure 105: Middle East High Performance Coatings Market Revenue Share (%), by Country 2024 & 2032
- Figure 106: Middle East High Performance Coatings Market Volume Share (%), by Country 2024 & 2032
- Figure 107: Saudi Arabia High Performance Coatings Market Revenue (Million), by Type 2024 & 2032
- Figure 108: Saudi Arabia High Performance Coatings Market Volume (liter ), by Type 2024 & 2032
- Figure 109: Saudi Arabia High Performance Coatings Market Revenue Share (%), by Type 2024 & 2032
- Figure 110: Saudi Arabia High Performance Coatings Market Volume Share (%), by Type 2024 & 2032
- Figure 111: Saudi Arabia High Performance Coatings Market Revenue (Million), by Coating Technology 2024 & 2032
- Figure 112: Saudi Arabia High Performance Coatings Market Volume (liter ), by Coating Technology 2024 & 2032
- Figure 113: Saudi Arabia High Performance Coatings Market Revenue Share (%), by Coating Technology 2024 & 2032
- Figure 114: Saudi Arabia High Performance Coatings Market Volume Share (%), by Coating Technology 2024 & 2032
- Figure 115: Saudi Arabia High Performance Coatings Market Revenue (Million), by End-user Industry 2024 & 2032
- Figure 116: Saudi Arabia High Performance Coatings Market Volume (liter ), by End-user Industry 2024 & 2032
- Figure 117: Saudi Arabia High Performance Coatings Market Revenue Share (%), by End-user Industry 2024 & 2032
- Figure 118: Saudi Arabia High Performance Coatings Market Volume Share (%), by End-user Industry 2024 & 2032
- Figure 119: Saudi Arabia High Performance Coatings Market Revenue (Million), by Country 2024 & 2032
- Figure 120: Saudi Arabia High Performance Coatings Market Volume (liter ), by Country 2024 & 2032
- Figure 121: Saudi Arabia High Performance Coatings Market Revenue Share (%), by Country 2024 & 2032
- Figure 122: Saudi Arabia High Performance Coatings Market Volume Share (%), by Country 2024 & 2032
List of Tables
- Table 1: Global High Performance Coatings Market Revenue Million Forecast, by Region 2019 & 2032
- Table 2: Global High Performance Coatings Market Volume liter Forecast, by Region 2019 & 2032
- Table 3: Global High Performance Coatings Market Revenue Million Forecast, by Type 2019 & 2032
- Table 4: Global High Performance Coatings Market Volume liter Forecast, by Type 2019 & 2032
- Table 5: Global High Performance Coatings Market Revenue Million Forecast, by Coating Technology 2019 & 2032
- Table 6: Global High Performance Coatings Market Volume liter Forecast, by Coating Technology 2019 & 2032
- Table 7: Global High Performance Coatings Market Revenue Million Forecast, by End-user Industry 2019 & 2032
- Table 8: Global High Performance Coatings Market Volume liter Forecast, by End-user Industry 2019 & 2032
- Table 9: Global High Performance Coatings Market Revenue Million Forecast, by Region 2019 & 2032
- Table 10: Global High Performance Coatings Market Volume liter Forecast, by Region 2019 & 2032
- Table 11: Global High Performance Coatings Market Revenue Million Forecast, by Country 2019 & 2032
- Table 12: Global High Performance Coatings Market Volume liter Forecast, by Country 2019 & 2032
- Table 13: China High Performance Coatings Market Revenue (Million) Forecast, by Application 2019 & 2032
- Table 14: China High Performance Coatings Market Volume (liter ) Forecast, by Application 2019 & 2032
- Table 15: India High Performance Coatings Market Revenue (Million) Forecast, by Application 2019 & 2032
- Table 16: India High Performance Coatings Market Volume (liter ) Forecast, by Application 2019 & 2032
- Table 17: Japan High Performance Coatings Market Revenue (Million) Forecast, by Application 2019 & 2032
- Table 18: Japan High Performance Coatings Market Volume (liter ) Forecast, by Application 2019 & 2032
- Table 19: South Korea High Performance Coatings Market Revenue (Million) Forecast, by Application 2019 & 2032
- Table 20: South Korea High Performance Coatings Market Volume (liter ) Forecast, by Application 2019 & 2032
- Table 21: Rest of Asia Pacific High Performance Coatings Market Revenue (Million) Forecast, by Application 2019 & 2032
- Table 22: Rest of Asia Pacific High Performance Coatings Market Volume (liter ) Forecast, by Application 2019 & 2032
- Table 23: Global High Performance Coatings Market Revenue Million Forecast, by Country 2019 & 2032
- Table 24: Global High Performance Coatings Market Volume liter Forecast, by Country 2019 & 2032
- Table 25: United States High Performance Coatings Market Revenue (Million) Forecast, by Application 2019 & 2032
- Table 26: United States High Performance Coatings Market Volume (liter ) Forecast, by Application 2019 & 2032
- Table 27: Canada High Performance Coatings Market Revenue (Million) Forecast, by Application 2019 & 2032
- Table 28: Canada High Performance Coatings Market Volume (liter ) Forecast, by Application 2019 & 2032
- Table 29: Mexico High Performance Coatings Market Revenue (Million) Forecast, by Application 2019 & 2032
- Table 30: Mexico High Performance Coatings Market Volume (liter ) Forecast, by Application 2019 & 2032
- Table 31: Global High Performance Coatings Market Revenue Million Forecast, by Country 2019 & 2032
- Table 32: Global High Performance Coatings Market Volume liter Forecast, by Country 2019 & 2032
- Table 33: Germany High Performance Coatings Market Revenue (Million) Forecast, by Application 2019 & 2032
- Table 34: Germany High Performance Coatings Market Volume (liter ) Forecast, by Application 2019 & 2032
- Table 35: United Kingdom High Performance Coatings Market Revenue (Million) Forecast, by Application 2019 & 2032
- Table 36: United Kingdom High Performance Coatings Market Volume (liter ) Forecast, by Application 2019 & 2032
- Table 37: Italy High Performance Coatings Market Revenue (Million) Forecast, by Application 2019 & 2032
- Table 38: Italy High Performance Coatings Market Volume (liter ) Forecast, by Application 2019 & 2032
- Table 39: France High Performance Coatings Market Revenue (Million) Forecast, by Application 2019 & 2032
- Table 40: France High Performance Coatings Market Volume (liter ) Forecast, by Application 2019 & 2032
- Table 41: Rest of Europe High Performance Coatings Market Revenue (Million) Forecast, by Application 2019 & 2032
- Table 42: Rest of Europe High Performance Coatings Market Volume (liter ) Forecast, by Application 2019 & 2032
- Table 43: Global High Performance Coatings Market Revenue Million Forecast, by Country 2019 & 2032
- Table 44: Global High Performance Coatings Market Volume liter Forecast, by Country 2019 & 2032
- Table 45: Brazil High Performance Coatings Market Revenue (Million) Forecast, by Application 2019 & 2032
- Table 46: Brazil High Performance Coatings Market Volume (liter ) Forecast, by Application 2019 & 2032
- Table 47: Argentina High Performance Coatings Market Revenue (Million) Forecast, by Application 2019 & 2032
- Table 48: Argentina High Performance Coatings Market Volume (liter ) Forecast, by Application 2019 & 2032
- Table 49: Rest of South America High Performance Coatings Market Revenue (Million) Forecast, by Application 2019 & 2032
- Table 50: Rest of South America High Performance Coatings Market Volume (liter ) Forecast, by Application 2019 & 2032
- Table 51: Global High Performance Coatings Market Revenue Million Forecast, by Country 2019 & 2032
- Table 52: Global High Performance Coatings Market Volume liter Forecast, by Country 2019 & 2032
- Table 53: Middle East High Performance Coatings Market Revenue (Million) Forecast, by Application 2019 & 2032
- Table 54: Middle East High Performance Coatings Market Volume (liter ) Forecast, by Application 2019 & 2032
- Table 55: Africa High Performance Coatings Market Revenue (Million) Forecast, by Application 2019 & 2032
- Table 56: Africa High Performance Coatings Market Volume (liter ) Forecast, by Application 2019 & 2032
- Table 57: Global High Performance Coatings Market Revenue Million Forecast, by Country 2019 & 2032
- Table 58: Global High Performance Coatings Market Volume liter Forecast, by Country 2019 & 2032
- Table 59: South Africa High Performance Coatings Market Revenue (Million) Forecast, by Application 2019 & 2032
- Table 60: South Africa High Performance Coatings Market Volume (liter ) Forecast, by Application 2019 & 2032
- Table 61: Rest of Middle East High Performance Coatings Market Revenue (Million) Forecast, by Application 2019 & 2032
- Table 62: Rest of Middle East High Performance Coatings Market Volume (liter ) Forecast, by Application 2019 & 2032
- Table 63: Global High Performance Coatings Market Revenue Million Forecast, by Type 2019 & 2032
- Table 64: Global High Performance Coatings Market Volume liter Forecast, by Type 2019 & 2032
- Table 65: Global High Performance Coatings Market Revenue Million Forecast, by Coating Technology 2019 & 2032
- Table 66: Global High Performance Coatings Market Volume liter Forecast, by Coating Technology 2019 & 2032
- Table 67: Global High Performance Coatings Market Revenue Million Forecast, by End-user Industry 2019 & 2032
- Table 68: Global High Performance Coatings Market Volume liter Forecast, by End-user Industry 2019 & 2032
- Table 69: Global High Performance Coatings Market Revenue Million Forecast, by Country 2019 & 2032
- Table 70: Global High Performance Coatings Market Volume liter Forecast, by Country 2019 & 2032
- Table 71: China High Performance Coatings Market Revenue (Million) Forecast, by Application 2019 & 2032
- Table 72: China High Performance Coatings Market Volume (liter ) Forecast, by Application 2019 & 2032
- Table 73: India High Performance Coatings Market Revenue (Million) Forecast, by Application 2019 & 2032
- Table 74: India High Performance Coatings Market Volume (liter ) Forecast, by Application 2019 & 2032
- Table 75: Japan High Performance Coatings Market Revenue (Million) Forecast, by Application 2019 & 2032
- Table 76: Japan High Performance Coatings Market Volume (liter ) Forecast, by Application 2019 & 2032
- Table 77: South Korea High Performance Coatings Market Revenue (Million) Forecast, by Application 2019 & 2032
- Table 78: South Korea High Performance Coatings Market Volume (liter ) Forecast, by Application 2019 & 2032
- Table 79: Rest of Asia Pacific High Performance Coatings Market Revenue (Million) Forecast, by Application 2019 & 2032
- Table 80: Rest of Asia Pacific High Performance Coatings Market Volume (liter ) Forecast, by Application 2019 & 2032
- Table 81: Global High Performance Coatings Market Revenue Million Forecast, by Type 2019 & 2032
- Table 82: Global High Performance Coatings Market Volume liter Forecast, by Type 2019 & 2032
- Table 83: Global High Performance Coatings Market Revenue Million Forecast, by Coating Technology 2019 & 2032
- Table 84: Global High Performance Coatings Market Volume liter Forecast, by Coating Technology 2019 & 2032
- Table 85: Global High Performance Coatings Market Revenue Million Forecast, by End-user Industry 2019 & 2032
- Table 86: Global High Performance Coatings Market Volume liter Forecast, by End-user Industry 2019 & 2032
- Table 87: Global High Performance Coatings Market Revenue Million Forecast, by Country 2019 & 2032
- Table 88: Global High Performance Coatings Market Volume liter Forecast, by Country 2019 & 2032
- Table 89: United States High Performance Coatings Market Revenue (Million) Forecast, by Application 2019 & 2032
- Table 90: United States High Performance Coatings Market Volume (liter ) Forecast, by Application 2019 & 2032
- Table 91: Canada High Performance Coatings Market Revenue (Million) Forecast, by Application 2019 & 2032
- Table 92: Canada High Performance Coatings Market Volume (liter ) Forecast, by Application 2019 & 2032
- Table 93: Mexico High Performance Coatings Market Revenue (Million) Forecast, by Application 2019 & 2032
- Table 94: Mexico High Performance Coatings Market Volume (liter ) Forecast, by Application 2019 & 2032
- Table 95: Global High Performance Coatings Market Revenue Million Forecast, by Type 2019 & 2032
- Table 96: Global High Performance Coatings Market Volume liter Forecast, by Type 2019 & 2032
- Table 97: Global High Performance Coatings Market Revenue Million Forecast, by Coating Technology 2019 & 2032
- Table 98: Global High Performance Coatings Market Volume liter Forecast, by Coating Technology 2019 & 2032
- Table 99: Global High Performance Coatings Market Revenue Million Forecast, by End-user Industry 2019 & 2032
- Table 100: Global High Performance Coatings Market Volume liter Forecast, by End-user Industry 2019 & 2032
- Table 101: Global High Performance Coatings Market Revenue Million Forecast, by Country 2019 & 2032
- Table 102: Global High Performance Coatings Market Volume liter Forecast, by Country 2019 & 2032
- Table 103: Germany High Performance Coatings Market Revenue (Million) Forecast, by Application 2019 & 2032
- Table 104: Germany High Performance Coatings Market Volume (liter ) Forecast, by Application 2019 & 2032
- Table 105: United Kingdom High Performance Coatings Market Revenue (Million) Forecast, by Application 2019 & 2032
- Table 106: United Kingdom High Performance Coatings Market Volume (liter ) Forecast, by Application 2019 & 2032
- Table 107: Italy High Performance Coatings Market Revenue (Million) Forecast, by Application 2019 & 2032
- Table 108: Italy High Performance Coatings Market Volume (liter ) Forecast, by Application 2019 & 2032
- Table 109: France High Performance Coatings Market Revenue (Million) Forecast, by Application 2019 & 2032
- Table 110: France High Performance Coatings Market Volume (liter ) Forecast, by Application 2019 & 2032
- Table 111: Rest of Europe High Performance Coatings Market Revenue (Million) Forecast, by Application 2019 & 2032
- Table 112: Rest of Europe High Performance Coatings Market Volume (liter ) Forecast, by Application 2019 & 2032
- Table 113: Global High Performance Coatings Market Revenue Million Forecast, by Type 2019 & 2032
- Table 114: Global High Performance Coatings Market Volume liter Forecast, by Type 2019 & 2032
- Table 115: Global High Performance Coatings Market Revenue Million Forecast, by Coating Technology 2019 & 2032
- Table 116: Global High Performance Coatings Market Volume liter Forecast, by Coating Technology 2019 & 2032
- Table 117: Global High Performance Coatings Market Revenue Million Forecast, by End-user Industry 2019 & 2032
- Table 118: Global High Performance Coatings Market Volume liter Forecast, by End-user Industry 2019 & 2032
- Table 119: Global High Performance Coatings Market Revenue Million Forecast, by Country 2019 & 2032
- Table 120: Global High Performance Coatings Market Volume liter Forecast, by Country 2019 & 2032
- Table 121: Brazil High Performance Coatings Market Revenue (Million) Forecast, by Application 2019 & 2032
- Table 122: Brazil High Performance Coatings Market Volume (liter ) Forecast, by Application 2019 & 2032
- Table 123: Argentina High Performance Coatings Market Revenue (Million) Forecast, by Application 2019 & 2032
- Table 124: Argentina High Performance Coatings Market Volume (liter ) Forecast, by Application 2019 & 2032
- Table 125: Rest of South America High Performance Coatings Market Revenue (Million) Forecast, by Application 2019 & 2032
- Table 126: Rest of South America High Performance Coatings Market Volume (liter ) Forecast, by Application 2019 & 2032
- Table 127: Global High Performance Coatings Market Revenue Million Forecast, by Type 2019 & 2032
- Table 128: Global High Performance Coatings Market Volume liter Forecast, by Type 2019 & 2032
- Table 129: Global High Performance Coatings Market Revenue Million Forecast, by Coating Technology 2019 & 2032
- Table 130: Global High Performance Coatings Market Volume liter Forecast, by Coating Technology 2019 & 2032
- Table 131: Global High Performance Coatings Market Revenue Million Forecast, by End-user Industry 2019 & 2032
- Table 132: Global High Performance Coatings Market Volume liter Forecast, by End-user Industry 2019 & 2032
- Table 133: Global High Performance Coatings Market Revenue Million Forecast, by Country 2019 & 2032
- Table 134: Global High Performance Coatings Market Volume liter Forecast, by Country 2019 & 2032
- Table 135: Global High Performance Coatings Market Revenue Million Forecast, by Type 2019 & 2032
- Table 136: Global High Performance Coatings Market Volume liter Forecast, by Type 2019 & 2032
- Table 137: Global High Performance Coatings Market Revenue Million Forecast, by Coating Technology 2019 & 2032
- Table 138: Global High Performance Coatings Market Volume liter Forecast, by Coating Technology 2019 & 2032
- Table 139: Global High Performance Coatings Market Revenue Million Forecast, by End-user Industry 2019 & 2032
- Table 140: Global High Performance Coatings Market Volume liter Forecast, by End-user Industry 2019 & 2032
- Table 141: Global High Performance Coatings Market Revenue Million Forecast, by Country 2019 & 2032
- Table 142: Global High Performance Coatings Market Volume liter Forecast, by Country 2019 & 2032
- Table 143: South Africa High Performance Coatings Market Revenue (Million) Forecast, by Application 2019 & 2032
- Table 144: South Africa High Performance Coatings Market Volume (liter ) Forecast, by Application 2019 & 2032
- Table 145: Rest of Middle East High Performance Coatings Market Revenue (Million) Forecast, by Application 2019 & 2032
- Table 146: Rest of Middle East High Performance Coatings Market Volume (liter ) Forecast, by Application 2019 & 2032
Frequently Asked Questions
1. What is the projected Compound Annual Growth Rate (CAGR) of the High Performance Coatings Market?
The projected CAGR is approximately > 5.00%.
2. Which companies are prominent players in the High Performance Coatings Market?
Key companies in the market include Metal Coatings Corp, Daikin Industries Ltd, The Sherwin-Williams Company, Toefco Engineered Coating Systems Inc, Akzo Nobel NV, PPG Industries Inc, Beckers Group, Nippon Paint Holdings Co Ltd, Kansai Nerolac Paints Limited, Endura Coatings LLC, The Chemours Company, Hempel Group*List Not Exhaustive, AFT Fluorotec Ltd.
3. What are the main segments of the High Performance Coatings Market?
The market segments include Type, Coating Technology, End-user Industry.
4. Can you provide details about the market size?
The market size is estimated to be USD XX Million as of 2022.
5. What are some drivers contributing to market growth?
; Increasing Construction Activities in the United States and Asia-Pacific; Other Drivers.
6. What are the notable trends driving market growth?
Growing Demand from Building & Construction Industry.
7. Are there any restraints impacting market growth?
; Solvent-based Adhesives are being Phased Out to Reduce VOC Emissions; Other Restraints.
8. Can you provide examples of recent developments in the market?
N/A
9. What pricing options are available for accessing the report?
Pricing options include single-user, multi-user, and enterprise licenses priced at USD 4750, USD 5250, and USD 8750 respectively.
10. Is the market size provided in terms of value or volume?
The market size is provided in terms of value, measured in Million and volume, measured in liter .
11. Are there any specific market keywords associated with the report?
Yes, the market keyword associated with the report is "High Performance Coatings Market," which aids in identifying and referencing the specific market segment covered.
12. How do I determine which pricing option suits my needs best?
The pricing options vary based on user requirements and access needs. Individual users may opt for single-user licenses, while businesses requiring broader access may choose multi-user or enterprise licenses for cost-effective access to the report.
13. Are there any additional resources or data provided in the High Performance Coatings Market report?
While the report offers comprehensive insights, it's advisable to review the specific contents or supplementary materials provided to ascertain if additional resources or data are available.
14. How can I stay updated on further developments or reports in the High Performance Coatings Market?
To stay informed about further developments, trends, and reports in the High Performance Coatings Market, consider subscribing to industry newsletters, following relevant companies and organizations, or regularly checking reputable industry news sources and publications.
Methodology
Step 1 - Identification of Relevant Samples Size from Population Database


Step 2 - Approaches for Defining Global Market Size (Value, Volume* & Price*)

Note*: In applicable scenarios
Step 3 - Data Sources
Primary Research
- Web Analytics
- Survey Reports
- Research Institute
- Latest Research Reports
- Opinion Leaders
Secondary Research
- Annual Reports
- White Paper
- Latest Press Release
- Industry Association
- Paid Database
- Investor Presentations

Step 4 - Data Triangulation
Involves using different sources of information in order to increase the validity of a study
These sources are likely to be stakeholders in a program - participants, other researchers, program staff, other community members, and so on.
Then we put all data in single framework & apply various statistical tools to find out the dynamic on the market.
During the analysis stage, feedback from the stakeholder groups would be compared to determine areas of agreement as well as areas of divergence


