

Key Insights
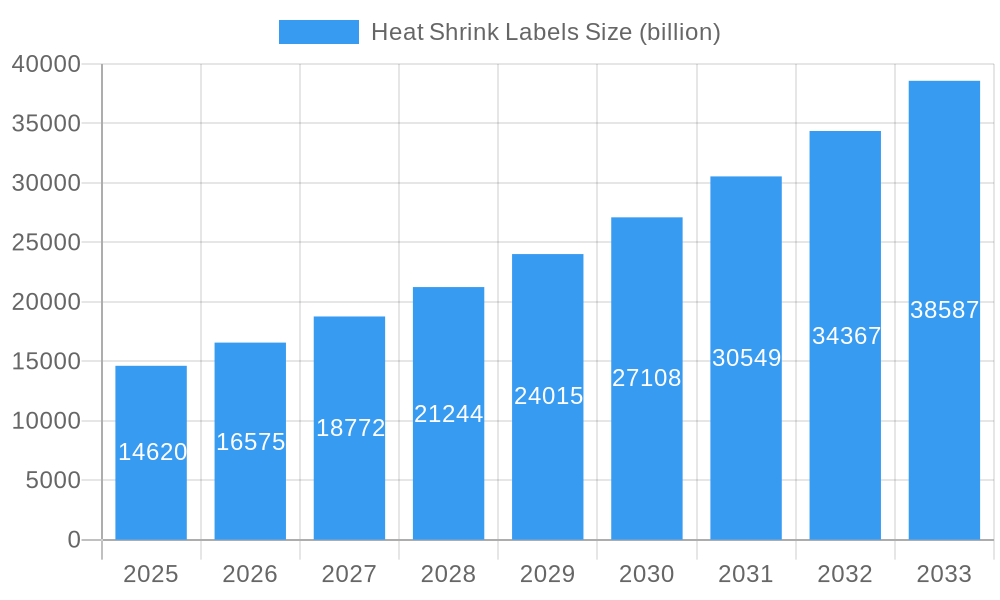
The global Heat Shrink Labels market is poised for significant expansion, projected to reach USD 14.62 billion by 2025. This robust growth is driven by an impressive Compound Annual Growth Rate (CAGR) of 13.46% during the forecast period of 2025-2033. The escalating demand for product differentiation, enhanced shelf appeal, and tamper-evident packaging across various industries is a primary catalyst for this upward trajectory. The Food & Beverage sector, in particular, is a major consumer, leveraging heat shrink labels for branding, product information, and to protect sensitive contents. Similarly, the Pharmaceuticals industry relies on these labels for anti-counterfeiting measures and to convey critical dosage and usage instructions. The Personal Care segment also contributes significantly, with brands utilizing heat shrink labels to create visually appealing packaging that stands out in competitive retail environments.
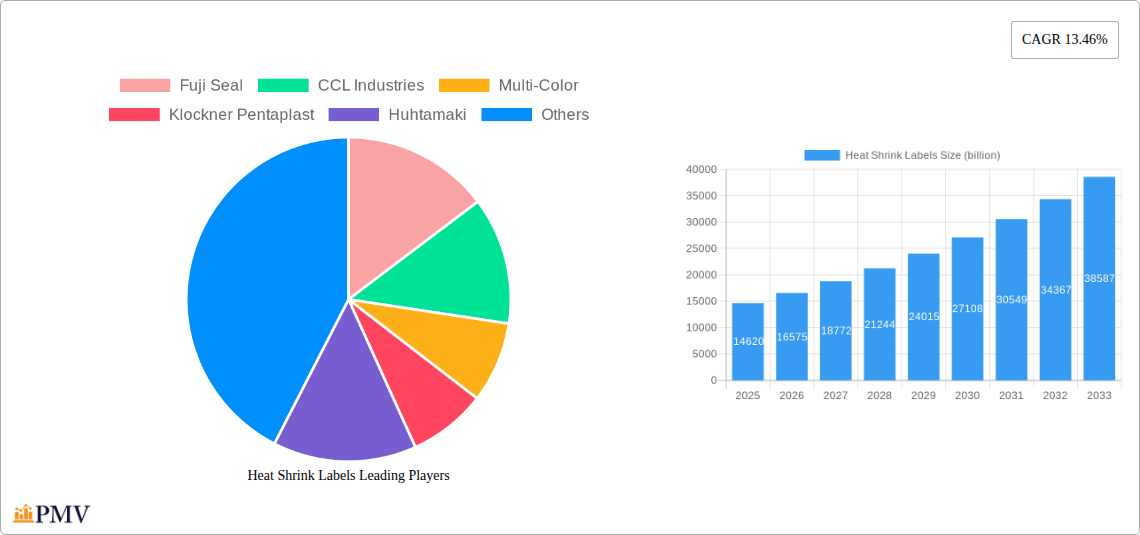
Heat Shrink Labels Market Size (In Billion)
The market's expansion is further fueled by ongoing technological advancements in film materials and printing techniques, leading to more sustainable and high-performance heat shrink label solutions. The increasing adoption of PETG and PVC films, known for their durability and versatility, is reshaping the material landscape. While the market demonstrates strong growth potential, certain factors could influence its pace. Economic fluctuations and the rising cost of raw materials represent potential restraints. However, the inherent advantages of heat shrink labels, including their ability to conform to complex shapes, provide full-body coverage, and offer a premium look, continue to outweigh these challenges. The market is characterized by a competitive landscape with established players like Fuji Seal and CCL Industries actively involved in innovation and strategic collaborations to capture market share.
Heat Shrink Labels Company Market Share
Comprehensive Report: Heat Shrink Labels Market Analysis – Growth, Trends, and Future Outlook (2019-2033)
This in-depth report provides a detailed analysis of the global Heat Shrink Labels market, offering critical insights into market dynamics, competitive landscapes, emerging trends, and future growth projections. Covering the historical period from 2019 to 2024, with a base year of 2025 and a forecast period extending to 2033, this report is an indispensable resource for stakeholders seeking to understand and capitalize on opportunities within this rapidly evolving sector.
Heat Shrink Labels Market Structure & Competitive Dynamics
The global Heat Shrink Labels market exhibits a moderately concentrated structure, with a significant portion of the market share held by a handful of key players. However, the presence of numerous regional and specialized manufacturers contributes to a competitive ecosystem characterized by innovation and product differentiation. The innovation landscape is fueled by advancements in material science, printing technologies, and sustainable packaging solutions. Regulatory frameworks, particularly concerning food contact materials and environmental impact, play a crucial role in shaping market strategies and product development. Substitutes for heat shrink labels, such as pressure-sensitive labels and direct printing, exist, but heat shrink technology offers unique advantages in terms of tamper-evidence, full-body coverage, and aesthetic appeal, particularly for complex container shapes. End-user trends are increasingly leaning towards visually appealing, informative, and sustainable packaging. Merger and acquisition (M&A) activities, with recent deal values estimated in the hundreds of millions of dollars, are indicative of market consolidation and strategic expansion by leading companies like Fuji Seal, CCL Industries, and Multi-Color Corporation. The report provides detailed market share analysis for these and other prominent entities.
Heat Shrink Labels Industry Trends & Insights
The Heat Shrink Labels industry is experiencing robust growth, driven by a confluence of factors including escalating demand for attractive and functional packaging across diverse consumer goods sectors, and the continuous technological advancements in label manufacturing. The market is projected to witness a Compound Annual Growth Rate (CAGR) of approximately 7.5% during the forecast period (2025-2033). Key market growth drivers include the increasing popularity of contoured and uniquely shaped packaging, especially in the Food & Beverage, Personal Care, and Pharmaceutical industries, where eye-catching branding is paramount. Technological disruptions, such as the development of higher-shrinkage materials, advanced printing techniques (e.g., digital printing for shorter runs and customization), and the integration of smart features (like NFC tags), are further propelling the industry forward. Consumer preferences are increasingly shifting towards convenience, sustainability, and premium product presentation, all of which are well-addressed by heat shrink labels. The competitive dynamics are characterized by a strong emphasis on R&D for enhanced material properties, cost-effectiveness, and eco-friendly alternatives. The market penetration of heat shrink labels is expanding, with an estimated global market size of over $5 billion in 2025. This growth trajectory is supported by the ongoing development of advanced film technologies, including PETG and OPS, offering superior clarity, durability, and shrinkage performance. The report delves into the intricate interplay of these trends, providing actionable insights for strategic decision-making.
Dominant Markets & Segments in Heat Shrink Labels
The Food & Beverage application segment is a dominant force in the global Heat Shrink Labels market, driven by the sector's inherent need for vibrant, tamper-evident, and informative packaging. This segment is expected to continue its stronghold, with an estimated market share exceeding 45% by 2033. Key drivers for its dominance include the immense volume of packaged goods, the rising demand for premium and artisanal food products, and the effectiveness of heat shrink labels in enhancing shelf appeal and communicating brand messaging. Regions such as North America and Europe lead in the adoption of sophisticated packaging solutions within the Food & Beverage sector, due to higher disposable incomes and stringent regulatory standards promoting product safety and integrity.
PETG films are emerging as a leading material type within the Heat Shrink Labels market, projected to capture a substantial market share of over 30% by 2033. This growth is attributed to PETG's excellent clarity, high shrink ratio, good chemical resistance, and recyclability, making it a preferred choice for a wide array of applications, particularly in the Food & Beverage and Personal Care industries. Its ability to conform to complex container shapes without compromising print quality is a significant competitive advantage.
The North America region is anticipated to remain a dominant market, accounting for an estimated 35% of the global Heat Shrink Labels market share by 2033. This dominance is fueled by a mature consumer market, a strong presence of multinational food, beverage, and personal care companies, and a proactive embrace of innovative packaging technologies. Stringent regulations promoting product safety and anti-counterfeiting measures further encourage the adoption of tamper-evident solutions like heat shrink labels. The robust economic policies supporting manufacturing and trade, coupled with well-developed logistics infrastructure, facilitate the widespread distribution and application of these labels.
Heat Shrink Labels Product Innovations
The Heat Shrink Labels sector is witnessing continuous product innovation focused on enhancing performance, sustainability, and functionality. Key developments include the introduction of high-shrink ratio films (e.g., exceeding 70% in both directions) enabling precise application on intricate shapes, and the formulation of PVC-free materials like PETG and OPS to meet growing environmental regulations. Advanced printing technologies, including high-resolution gravure and digital printing, allow for intricate graphics and variable data printing. Furthermore, the integration of features such as easy-peel properties, micro-perforations for breathability, and anti-microbial additives is expanding their application scope and market appeal. These innovations empower brands with superior aesthetics, improved product protection, and a stronger market differentiation.
Report Segmentation & Scope
This report meticulously segments the global Heat Shrink Labels market across key parameters, offering a granular view of market dynamics.
Application Segmentation:
- Food & Beverage: This segment is expected to witness significant growth driven by product differentiation needs and tamper-evidence requirements. Projected to account for over $2.5 billion in market value by 2033, with a CAGR of approximately 8%.
- Pharmaceuticals: Characterized by strict regulatory oversight, this segment demands high-quality, secure, and informative labeling. Projected to reach over $1.2 billion by 2033, with a CAGR of around 6.5%.
- Personal Care: Driven by aesthetic appeal and brand promotion, this segment shows strong adoption of visually engaging heat shrink labels. Projected market value of over $1.5 billion by 2033, with a CAGR of approximately 7%.
- Others: This category encompasses diverse applications like industrial goods, electronics, and household chemicals, showing steady growth. Projected to contribute over $0.8 billion by 2033.
Type Segmentation:
- PVC: Still a prevalent material due to its cost-effectiveness and good shrink properties.
- PETG: Growing rapidly due to its superior clarity, recyclability, and environmental profile.
- OPS: Offering excellent clarity and high shrink capability, particularly favored in beverage applications.
- PE: Used in specific applications requiring chemical resistance and flexibility.
- PP: Known for its durability and moisture resistance.
- COC Films: Emerging material with excellent barrier properties and optical clarity.
- Others: Includes specialized film types catering to niche requirements.
Key Drivers of Heat Shrink Labels Growth
The growth of the Heat Shrink Labels market is propelled by several key factors. Technologically, advancements in film extrusion and printing capabilities allow for more complex designs, higher shrink ratios, and improved visual appeal, catering to brand differentiation needs. Economically, the expanding global middle class and increasing consumer spending on packaged goods, especially in emerging economies, directly translate to higher demand for labeling solutions. Regulatory frameworks promoting product safety, tamper-evidence, and clearer ingredient labeling further necessitate the adoption of reliable labeling technologies. The rising demand for sustainable packaging solutions is also a significant driver, with the development of recyclable and biodegradable heat shrink films gaining traction. For instance, the increasing focus on product authenticity and anti-counterfeiting measures in sectors like pharmaceuticals and luxury goods directly benefits heat shrink labels' inherent tamper-evident features.
Challenges in the Heat Shrink Labels Sector
Despite robust growth, the Heat Shrink Labels sector faces several challenges. Regulatory hurdles related to the disposal and recyclability of certain film types, particularly PVC, can impact market adoption in environmentally conscious regions. Supply chain disruptions, exacerbated by raw material price volatility and geopolitical uncertainties, can affect production costs and lead times. Intense competitive pressures from alternative labeling technologies, such as pressure-sensitive labels and direct printing, necessitate continuous innovation and cost optimization. Furthermore, the energy-intensive nature of the heat application process can be a concern for some end-users. The escalating cost of raw materials, such as plastic resins, poses a significant challenge, potentially impacting profit margins and pricing strategies.
Leading Players in the Heat Shrink Labels Market
- Fuji Seal
- CCL Industries
- Multi-Color
- Klockner Pentaplast
- Huhtamaki
- Clondalkin Group
- Brook & Whittle
- WestRock
- Fort Dearborn Company
- Yinjinda
- Jinghong
- Chengxin
- Zijiang
Key Developments in Heat Shrink Labels Sector
- 2024: Launch of advanced PETG films with enhanced clarity and higher shrink capabilities by major manufacturers.
- 2023: Increased M&A activity focused on acquiring specialized heat shrink label converters to expand market reach.
- 2022: Significant investments in R&D for sustainable and recyclable heat shrink film alternatives.
- 2021: Introduction of digital printing solutions for short-run, high-value heat shrink labels.
- 2020: Development of tamper-evident features and easy-peel technologies for enhanced consumer convenience.
Strategic Heat Shrink Labels Market Outlook
The future outlook for the Heat Shrink Labels market is exceptionally promising, driven by sustained demand for sophisticated packaging solutions across key consumer industries. Growth accelerators include the ongoing trend towards premiumization and product differentiation, the increasing need for tamper-evident features to ensure product integrity and prevent counterfeiting, and the growing consumer preference for visually appealing packaging that stands out on the shelf. The shift towards more sustainable materials, such as PETG and bio-based films, presents a significant opportunity for market expansion and alignment with global environmental goals. Furthermore, the integration of smart labeling technologies, including RFID and NFC, into heat shrink labels will unlock new avenues for supply chain management and consumer engagement. Strategic investments in advanced manufacturing processes and material science will be crucial for players to maintain a competitive edge and capitalize on the burgeoning global demand.
Heat Shrink Labels Segmentation
-
1. Application
- 1.1. Food & Beverage
- 1.2. Pharmaceuticals
- 1.3. Personal Care
- 1.4. Others
-
2. Type
- 2.1. PVC
- 2.2. PETG
- 2.3. OPS
- 2.4. PE
- 2.5. PP
- 2.6. COC Films
- 2.7. Others
Heat Shrink Labels Segmentation By Geography
-
1. North America
- 1.1. United States
- 1.2. Canada
- 1.3. Mexico
-
2. South America
- 2.1. Brazil
- 2.2. Argentina
- 2.3. Rest of South America
-
3. Europe
- 3.1. United Kingdom
- 3.2. Germany
- 3.3. France
- 3.4. Italy
- 3.5. Spain
- 3.6. Russia
- 3.7. Benelux
- 3.8. Nordics
- 3.9. Rest of Europe
-
4. Middle East & Africa
- 4.1. Turkey
- 4.2. Israel
- 4.3. GCC
- 4.4. North Africa
- 4.5. South Africa
- 4.6. Rest of Middle East & Africa
-
5. Asia Pacific
- 5.1. China
- 5.2. India
- 5.3. Japan
- 5.4. South Korea
- 5.5. ASEAN
- 5.6. Oceania
- 5.7. Rest of Asia Pacific
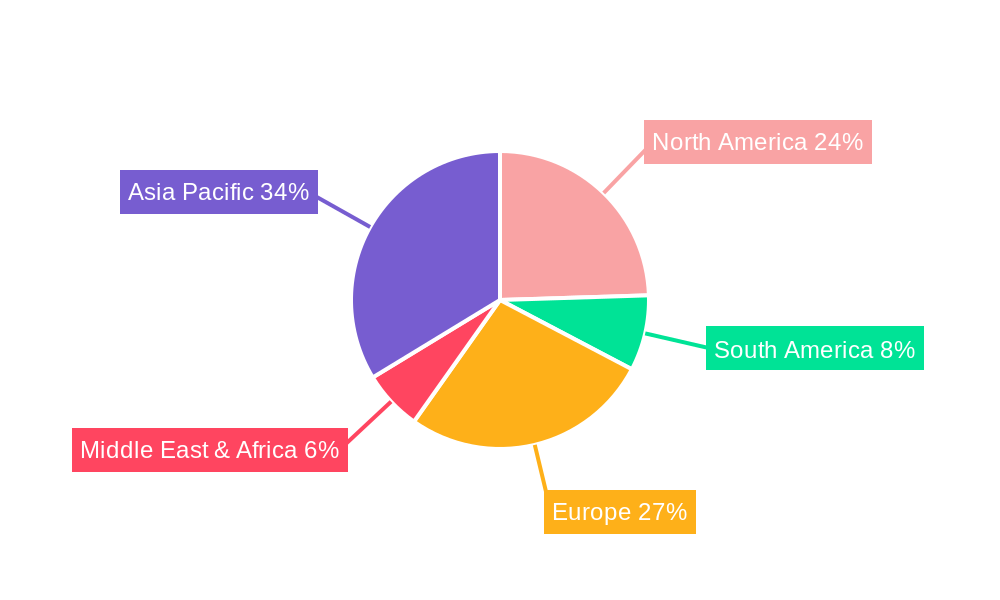
Heat Shrink Labels Regional Market Share
Geographic Coverage of Heat Shrink Labels
Heat Shrink Labels REPORT HIGHLIGHTS
| Aspects | Details |
|---|---|
| Study Period | 2020-2034 |
| Base Year | 2025 |
| Estimated Year | 2026 |
| Forecast Period | 2026-2034 |
| Historical Period | 2020-2025 |
| Growth Rate | CAGR of 13.46% from 2020-2034 |
| Segmentation |
|
Table of Contents
- 1. Introduction
- 1.1. Research Scope
- 1.2. Market Segmentation
- 1.3. Research Objective
- 1.4. Definitions and Assumptions
- 2. Executive Summary
- 2.1. Market Snapshot
- 3. Market Dynamics
- 3.1. Market Drivers
- 3.2. Market Restrains
- 3.3. Market Trends
- 3.4. Market Opportunities
- 4. Market Factor Analysis
- 4.1. Porters Five Forces
- 4.1.1. Bargaining Power of Suppliers
- 4.1.2. Bargaining Power of Buyers
- 4.1.3. Threat of New Entrants
- 4.1.4. Threat of Substitutes
- 4.1.5. Competitive Rivalry
- 4.2. PESTEL analysis
- 4.3. BCG Analysis
- 4.3.1. Stars (High Growth, High Market Share)
- 4.3.2. Cash Cows (Low Growth, High Market Share)
- 4.3.3. Question Mark (High Growth, Low Market Share)
- 4.3.4. Dogs (Low Growth, Low Market Share)
- 4.4. Ansoff Matrix Analysis
- 4.5. Supply Chain Analysis
- 4.6. Regulatory Landscape
- 4.7. Current Market Potential and Opportunity Assessment (TAM–SAM–SOM Framework)
- 4.8. PMV Analyst Note
- 4.1. Porters Five Forces
- 5. Market Analysis, Insights and Forecast 2021-2033
- 5.1. Market Analysis, Insights and Forecast - by Application
- 5.1.1. Food & Beverage
- 5.1.2. Pharmaceuticals
- 5.1.3. Personal Care
- 5.1.4. Others
- 5.2. Market Analysis, Insights and Forecast - by Type
- 5.2.1. PVC
- 5.2.2. PETG
- 5.2.3. OPS
- 5.2.4. PE
- 5.2.5. PP
- 5.2.6. COC Films
- 5.2.7. Others
- 5.3. Market Analysis, Insights and Forecast - by Region
- 5.3.1. North America
- 5.3.2. South America
- 5.3.3. Europe
- 5.3.4. Middle East & Africa
- 5.3.5. Asia Pacific
- 5.1. Market Analysis, Insights and Forecast - by Application
- 6. Global Heat Shrink Labels Analysis, Insights and Forecast, 2021-2033
- 6.1. Market Analysis, Insights and Forecast - by Application
- 6.1.1. Food & Beverage
- 6.1.2. Pharmaceuticals
- 6.1.3. Personal Care
- 6.1.4. Others
- 6.2. Market Analysis, Insights and Forecast - by Type
- 6.2.1. PVC
- 6.2.2. PETG
- 6.2.3. OPS
- 6.2.4. PE
- 6.2.5. PP
- 6.2.6. COC Films
- 6.2.7. Others
- 6.1. Market Analysis, Insights and Forecast - by Application
- 7. North America Heat Shrink Labels Analysis, Insights and Forecast, 2020-2032
- 7.1. Market Analysis, Insights and Forecast - by Application
- 7.1.1. Food & Beverage
- 7.1.2. Pharmaceuticals
- 7.1.3. Personal Care
- 7.1.4. Others
- 7.2. Market Analysis, Insights and Forecast - by Type
- 7.2.1. PVC
- 7.2.2. PETG
- 7.2.3. OPS
- 7.2.4. PE
- 7.2.5. PP
- 7.2.6. COC Films
- 7.2.7. Others
- 7.1. Market Analysis, Insights and Forecast - by Application
- 8. South America Heat Shrink Labels Analysis, Insights and Forecast, 2020-2032
- 8.1. Market Analysis, Insights and Forecast - by Application
- 8.1.1. Food & Beverage
- 8.1.2. Pharmaceuticals
- 8.1.3. Personal Care
- 8.1.4. Others
- 8.2. Market Analysis, Insights and Forecast - by Type
- 8.2.1. PVC
- 8.2.2. PETG
- 8.2.3. OPS
- 8.2.4. PE
- 8.2.5. PP
- 8.2.6. COC Films
- 8.2.7. Others
- 8.1. Market Analysis, Insights and Forecast - by Application
- 9. Europe Heat Shrink Labels Analysis, Insights and Forecast, 2020-2032
- 9.1. Market Analysis, Insights and Forecast - by Application
- 9.1.1. Food & Beverage
- 9.1.2. Pharmaceuticals
- 9.1.3. Personal Care
- 9.1.4. Others
- 9.2. Market Analysis, Insights and Forecast - by Type
- 9.2.1. PVC
- 9.2.2. PETG
- 9.2.3. OPS
- 9.2.4. PE
- 9.2.5. PP
- 9.2.6. COC Films
- 9.2.7. Others
- 9.1. Market Analysis, Insights and Forecast - by Application
- 10. Middle East & Africa Heat Shrink Labels Analysis, Insights and Forecast, 2020-2032
- 10.1. Market Analysis, Insights and Forecast - by Application
- 10.1.1. Food & Beverage
- 10.1.2. Pharmaceuticals
- 10.1.3. Personal Care
- 10.1.4. Others
- 10.2. Market Analysis, Insights and Forecast - by Type
- 10.2.1. PVC
- 10.2.2. PETG
- 10.2.3. OPS
- 10.2.4. PE
- 10.2.5. PP
- 10.2.6. COC Films
- 10.2.7. Others
- 10.1. Market Analysis, Insights and Forecast - by Application
- 11. Asia Pacific Heat Shrink Labels Analysis, Insights and Forecast, 2020-2032
- 11.1. Market Analysis, Insights and Forecast - by Application
- 11.1.1. Food & Beverage
- 11.1.2. Pharmaceuticals
- 11.1.3. Personal Care
- 11.1.4. Others
- 11.2. Market Analysis, Insights and Forecast - by Type
- 11.2.1. PVC
- 11.2.2. PETG
- 11.2.3. OPS
- 11.2.4. PE
- 11.2.5. PP
- 11.2.6. COC Films
- 11.2.7. Others
- 11.1. Market Analysis, Insights and Forecast - by Application
- 12. Competitive Analysis
- 12.1. Company Profiles
- 12.1.1 Fuji Seal
- 12.1.1.1. Company Overview
- 12.1.1.2. Products
- 12.1.1.3. Company Financials
- 12.1.1.4. SWOT Analysis
- 12.1.2 CCL Industries
- 12.1.2.1. Company Overview
- 12.1.2.2. Products
- 12.1.2.3. Company Financials
- 12.1.2.4. SWOT Analysis
- 12.1.3 Multi-Color
- 12.1.3.1. Company Overview
- 12.1.3.2. Products
- 12.1.3.3. Company Financials
- 12.1.3.4. SWOT Analysis
- 12.1.4 Klockner Pentaplast
- 12.1.4.1. Company Overview
- 12.1.4.2. Products
- 12.1.4.3. Company Financials
- 12.1.4.4. SWOT Analysis
- 12.1.5 Huhtamaki
- 12.1.5.1. Company Overview
- 12.1.5.2. Products
- 12.1.5.3. Company Financials
- 12.1.5.4. SWOT Analysis
- 12.1.6 Clondalkin Group
- 12.1.6.1. Company Overview
- 12.1.6.2. Products
- 12.1.6.3. Company Financials
- 12.1.6.4. SWOT Analysis
- 12.1.7 Brook & Whittle
- 12.1.7.1. Company Overview
- 12.1.7.2. Products
- 12.1.7.3. Company Financials
- 12.1.7.4. SWOT Analysis
- 12.1.8 WestRock
- 12.1.8.1. Company Overview
- 12.1.8.2. Products
- 12.1.8.3. Company Financials
- 12.1.8.4. SWOT Analysis
- 12.1.9 Fort Dearborn Company
- 12.1.9.1. Company Overview
- 12.1.9.2. Products
- 12.1.9.3. Company Financials
- 12.1.9.4. SWOT Analysis
- 12.1.10 Yinjinda
- 12.1.10.1. Company Overview
- 12.1.10.2. Products
- 12.1.10.3. Company Financials
- 12.1.10.4. SWOT Analysis
- 12.1.11 Jinghong
- 12.1.11.1. Company Overview
- 12.1.11.2. Products
- 12.1.11.3. Company Financials
- 12.1.11.4. SWOT Analysis
- 12.1.12 Chengxin
- 12.1.12.1. Company Overview
- 12.1.12.2. Products
- 12.1.12.3. Company Financials
- 12.1.12.4. SWOT Analysis
- 12.1.13 Zijiang
- 12.1.13.1. Company Overview
- 12.1.13.2. Products
- 12.1.13.3. Company Financials
- 12.1.13.4. SWOT Analysis
- 12.1.1 Fuji Seal
- 12.2. Market Entropy
- 12.2.1 Company's Key Areas Served
- 12.2.2 Recent Developments
- 12.3. Company Market Share Analysis 2025
- 12.3.1 Top 5 Companies Market Share Analysis
- 12.3.2 Top 3 Companies Market Share Analysis
- 12.4. List of Potential Customers
- 13. Research Methodology
List of Figures
- Figure 1: Global Heat Shrink Labels Revenue Breakdown (billion, %) by Region 2025 & 2033
- Figure 2: Global Heat Shrink Labels Volume Breakdown (K, %) by Region 2025 & 2033
- Figure 3: North America Heat Shrink Labels Revenue (billion), by Application 2025 & 2033
- Figure 4: North America Heat Shrink Labels Volume (K), by Application 2025 & 2033
- Figure 5: North America Heat Shrink Labels Revenue Share (%), by Application 2025 & 2033
- Figure 6: North America Heat Shrink Labels Volume Share (%), by Application 2025 & 2033
- Figure 7: North America Heat Shrink Labels Revenue (billion), by Type 2025 & 2033
- Figure 8: North America Heat Shrink Labels Volume (K), by Type 2025 & 2033
- Figure 9: North America Heat Shrink Labels Revenue Share (%), by Type 2025 & 2033
- Figure 10: North America Heat Shrink Labels Volume Share (%), by Type 2025 & 2033
- Figure 11: North America Heat Shrink Labels Revenue (billion), by Country 2025 & 2033
- Figure 12: North America Heat Shrink Labels Volume (K), by Country 2025 & 2033
- Figure 13: North America Heat Shrink Labels Revenue Share (%), by Country 2025 & 2033
- Figure 14: North America Heat Shrink Labels Volume Share (%), by Country 2025 & 2033
- Figure 15: South America Heat Shrink Labels Revenue (billion), by Application 2025 & 2033
- Figure 16: South America Heat Shrink Labels Volume (K), by Application 2025 & 2033
- Figure 17: South America Heat Shrink Labels Revenue Share (%), by Application 2025 & 2033
- Figure 18: South America Heat Shrink Labels Volume Share (%), by Application 2025 & 2033
- Figure 19: South America Heat Shrink Labels Revenue (billion), by Type 2025 & 2033
- Figure 20: South America Heat Shrink Labels Volume (K), by Type 2025 & 2033
- Figure 21: South America Heat Shrink Labels Revenue Share (%), by Type 2025 & 2033
- Figure 22: South America Heat Shrink Labels Volume Share (%), by Type 2025 & 2033
- Figure 23: South America Heat Shrink Labels Revenue (billion), by Country 2025 & 2033
- Figure 24: South America Heat Shrink Labels Volume (K), by Country 2025 & 2033
- Figure 25: South America Heat Shrink Labels Revenue Share (%), by Country 2025 & 2033
- Figure 26: South America Heat Shrink Labels Volume Share (%), by Country 2025 & 2033
- Figure 27: Europe Heat Shrink Labels Revenue (billion), by Application 2025 & 2033
- Figure 28: Europe Heat Shrink Labels Volume (K), by Application 2025 & 2033
- Figure 29: Europe Heat Shrink Labels Revenue Share (%), by Application 2025 & 2033
- Figure 30: Europe Heat Shrink Labels Volume Share (%), by Application 2025 & 2033
- Figure 31: Europe Heat Shrink Labels Revenue (billion), by Type 2025 & 2033
- Figure 32: Europe Heat Shrink Labels Volume (K), by Type 2025 & 2033
- Figure 33: Europe Heat Shrink Labels Revenue Share (%), by Type 2025 & 2033
- Figure 34: Europe Heat Shrink Labels Volume Share (%), by Type 2025 & 2033
- Figure 35: Europe Heat Shrink Labels Revenue (billion), by Country 2025 & 2033
- Figure 36: Europe Heat Shrink Labels Volume (K), by Country 2025 & 2033
- Figure 37: Europe Heat Shrink Labels Revenue Share (%), by Country 2025 & 2033
- Figure 38: Europe Heat Shrink Labels Volume Share (%), by Country 2025 & 2033
- Figure 39: Middle East & Africa Heat Shrink Labels Revenue (billion), by Application 2025 & 2033
- Figure 40: Middle East & Africa Heat Shrink Labels Volume (K), by Application 2025 & 2033
- Figure 41: Middle East & Africa Heat Shrink Labels Revenue Share (%), by Application 2025 & 2033
- Figure 42: Middle East & Africa Heat Shrink Labels Volume Share (%), by Application 2025 & 2033
- Figure 43: Middle East & Africa Heat Shrink Labels Revenue (billion), by Type 2025 & 2033
- Figure 44: Middle East & Africa Heat Shrink Labels Volume (K), by Type 2025 & 2033
- Figure 45: Middle East & Africa Heat Shrink Labels Revenue Share (%), by Type 2025 & 2033
- Figure 46: Middle East & Africa Heat Shrink Labels Volume Share (%), by Type 2025 & 2033
- Figure 47: Middle East & Africa Heat Shrink Labels Revenue (billion), by Country 2025 & 2033
- Figure 48: Middle East & Africa Heat Shrink Labels Volume (K), by Country 2025 & 2033
- Figure 49: Middle East & Africa Heat Shrink Labels Revenue Share (%), by Country 2025 & 2033
- Figure 50: Middle East & Africa Heat Shrink Labels Volume Share (%), by Country 2025 & 2033
- Figure 51: Asia Pacific Heat Shrink Labels Revenue (billion), by Application 2025 & 2033
- Figure 52: Asia Pacific Heat Shrink Labels Volume (K), by Application 2025 & 2033
- Figure 53: Asia Pacific Heat Shrink Labels Revenue Share (%), by Application 2025 & 2033
- Figure 54: Asia Pacific Heat Shrink Labels Volume Share (%), by Application 2025 & 2033
- Figure 55: Asia Pacific Heat Shrink Labels Revenue (billion), by Type 2025 & 2033
- Figure 56: Asia Pacific Heat Shrink Labels Volume (K), by Type 2025 & 2033
- Figure 57: Asia Pacific Heat Shrink Labels Revenue Share (%), by Type 2025 & 2033
- Figure 58: Asia Pacific Heat Shrink Labels Volume Share (%), by Type 2025 & 2033
- Figure 59: Asia Pacific Heat Shrink Labels Revenue (billion), by Country 2025 & 2033
- Figure 60: Asia Pacific Heat Shrink Labels Volume (K), by Country 2025 & 2033
- Figure 61: Asia Pacific Heat Shrink Labels Revenue Share (%), by Country 2025 & 2033
- Figure 62: Asia Pacific Heat Shrink Labels Volume Share (%), by Country 2025 & 2033
List of Tables
- Table 1: Global Heat Shrink Labels Revenue billion Forecast, by Application 2020 & 2033
- Table 2: Global Heat Shrink Labels Volume K Forecast, by Application 2020 & 2033
- Table 3: Global Heat Shrink Labels Revenue billion Forecast, by Type 2020 & 2033
- Table 4: Global Heat Shrink Labels Volume K Forecast, by Type 2020 & 2033
- Table 5: Global Heat Shrink Labels Revenue billion Forecast, by Region 2020 & 2033
- Table 6: Global Heat Shrink Labels Volume K Forecast, by Region 2020 & 2033
- Table 7: Global Heat Shrink Labels Revenue billion Forecast, by Application 2020 & 2033
- Table 8: Global Heat Shrink Labels Volume K Forecast, by Application 2020 & 2033
- Table 9: Global Heat Shrink Labels Revenue billion Forecast, by Type 2020 & 2033
- Table 10: Global Heat Shrink Labels Volume K Forecast, by Type 2020 & 2033
- Table 11: Global Heat Shrink Labels Revenue billion Forecast, by Country 2020 & 2033
- Table 12: Global Heat Shrink Labels Volume K Forecast, by Country 2020 & 2033
- Table 13: United States Heat Shrink Labels Revenue (billion) Forecast, by Application 2020 & 2033
- Table 14: United States Heat Shrink Labels Volume (K) Forecast, by Application 2020 & 2033
- Table 15: Canada Heat Shrink Labels Revenue (billion) Forecast, by Application 2020 & 2033
- Table 16: Canada Heat Shrink Labels Volume (K) Forecast, by Application 2020 & 2033
- Table 17: Mexico Heat Shrink Labels Revenue (billion) Forecast, by Application 2020 & 2033
- Table 18: Mexico Heat Shrink Labels Volume (K) Forecast, by Application 2020 & 2033
- Table 19: Global Heat Shrink Labels Revenue billion Forecast, by Application 2020 & 2033
- Table 20: Global Heat Shrink Labels Volume K Forecast, by Application 2020 & 2033
- Table 21: Global Heat Shrink Labels Revenue billion Forecast, by Type 2020 & 2033
- Table 22: Global Heat Shrink Labels Volume K Forecast, by Type 2020 & 2033
- Table 23: Global Heat Shrink Labels Revenue billion Forecast, by Country 2020 & 2033
- Table 24: Global Heat Shrink Labels Volume K Forecast, by Country 2020 & 2033
- Table 25: Brazil Heat Shrink Labels Revenue (billion) Forecast, by Application 2020 & 2033
- Table 26: Brazil Heat Shrink Labels Volume (K) Forecast, by Application 2020 & 2033
- Table 27: Argentina Heat Shrink Labels Revenue (billion) Forecast, by Application 2020 & 2033
- Table 28: Argentina Heat Shrink Labels Volume (K) Forecast, by Application 2020 & 2033
- Table 29: Rest of South America Heat Shrink Labels Revenue (billion) Forecast, by Application 2020 & 2033
- Table 30: Rest of South America Heat Shrink Labels Volume (K) Forecast, by Application 2020 & 2033
- Table 31: Global Heat Shrink Labels Revenue billion Forecast, by Application 2020 & 2033
- Table 32: Global Heat Shrink Labels Volume K Forecast, by Application 2020 & 2033
- Table 33: Global Heat Shrink Labels Revenue billion Forecast, by Type 2020 & 2033
- Table 34: Global Heat Shrink Labels Volume K Forecast, by Type 2020 & 2033
- Table 35: Global Heat Shrink Labels Revenue billion Forecast, by Country 2020 & 2033
- Table 36: Global Heat Shrink Labels Volume K Forecast, by Country 2020 & 2033
- Table 37: United Kingdom Heat Shrink Labels Revenue (billion) Forecast, by Application 2020 & 2033
- Table 38: United Kingdom Heat Shrink Labels Volume (K) Forecast, by Application 2020 & 2033
- Table 39: Germany Heat Shrink Labels Revenue (billion) Forecast, by Application 2020 & 2033
- Table 40: Germany Heat Shrink Labels Volume (K) Forecast, by Application 2020 & 2033
- Table 41: France Heat Shrink Labels Revenue (billion) Forecast, by Application 2020 & 2033
- Table 42: France Heat Shrink Labels Volume (K) Forecast, by Application 2020 & 2033
- Table 43: Italy Heat Shrink Labels Revenue (billion) Forecast, by Application 2020 & 2033
- Table 44: Italy Heat Shrink Labels Volume (K) Forecast, by Application 2020 & 2033
- Table 45: Spain Heat Shrink Labels Revenue (billion) Forecast, by Application 2020 & 2033
- Table 46: Spain Heat Shrink Labels Volume (K) Forecast, by Application 2020 & 2033
- Table 47: Russia Heat Shrink Labels Revenue (billion) Forecast, by Application 2020 & 2033
- Table 48: Russia Heat Shrink Labels Volume (K) Forecast, by Application 2020 & 2033
- Table 49: Benelux Heat Shrink Labels Revenue (billion) Forecast, by Application 2020 & 2033
- Table 50: Benelux Heat Shrink Labels Volume (K) Forecast, by Application 2020 & 2033
- Table 51: Nordics Heat Shrink Labels Revenue (billion) Forecast, by Application 2020 & 2033
- Table 52: Nordics Heat Shrink Labels Volume (K) Forecast, by Application 2020 & 2033
- Table 53: Rest of Europe Heat Shrink Labels Revenue (billion) Forecast, by Application 2020 & 2033
- Table 54: Rest of Europe Heat Shrink Labels Volume (K) Forecast, by Application 2020 & 2033
- Table 55: Global Heat Shrink Labels Revenue billion Forecast, by Application 2020 & 2033
- Table 56: Global Heat Shrink Labels Volume K Forecast, by Application 2020 & 2033
- Table 57: Global Heat Shrink Labels Revenue billion Forecast, by Type 2020 & 2033
- Table 58: Global Heat Shrink Labels Volume K Forecast, by Type 2020 & 2033
- Table 59: Global Heat Shrink Labels Revenue billion Forecast, by Country 2020 & 2033
- Table 60: Global Heat Shrink Labels Volume K Forecast, by Country 2020 & 2033
- Table 61: Turkey Heat Shrink Labels Revenue (billion) Forecast, by Application 2020 & 2033
- Table 62: Turkey Heat Shrink Labels Volume (K) Forecast, by Application 2020 & 2033
- Table 63: Israel Heat Shrink Labels Revenue (billion) Forecast, by Application 2020 & 2033
- Table 64: Israel Heat Shrink Labels Volume (K) Forecast, by Application 2020 & 2033
- Table 65: GCC Heat Shrink Labels Revenue (billion) Forecast, by Application 2020 & 2033
- Table 66: GCC Heat Shrink Labels Volume (K) Forecast, by Application 2020 & 2033
- Table 67: North Africa Heat Shrink Labels Revenue (billion) Forecast, by Application 2020 & 2033
- Table 68: North Africa Heat Shrink Labels Volume (K) Forecast, by Application 2020 & 2033
- Table 69: South Africa Heat Shrink Labels Revenue (billion) Forecast, by Application 2020 & 2033
- Table 70: South Africa Heat Shrink Labels Volume (K) Forecast, by Application 2020 & 2033
- Table 71: Rest of Middle East & Africa Heat Shrink Labels Revenue (billion) Forecast, by Application 2020 & 2033
- Table 72: Rest of Middle East & Africa Heat Shrink Labels Volume (K) Forecast, by Application 2020 & 2033
- Table 73: Global Heat Shrink Labels Revenue billion Forecast, by Application 2020 & 2033
- Table 74: Global Heat Shrink Labels Volume K Forecast, by Application 2020 & 2033
- Table 75: Global Heat Shrink Labels Revenue billion Forecast, by Type 2020 & 2033
- Table 76: Global Heat Shrink Labels Volume K Forecast, by Type 2020 & 2033
- Table 77: Global Heat Shrink Labels Revenue billion Forecast, by Country 2020 & 2033
- Table 78: Global Heat Shrink Labels Volume K Forecast, by Country 2020 & 2033
- Table 79: China Heat Shrink Labels Revenue (billion) Forecast, by Application 2020 & 2033
- Table 80: China Heat Shrink Labels Volume (K) Forecast, by Application 2020 & 2033
- Table 81: India Heat Shrink Labels Revenue (billion) Forecast, by Application 2020 & 2033
- Table 82: India Heat Shrink Labels Volume (K) Forecast, by Application 2020 & 2033
- Table 83: Japan Heat Shrink Labels Revenue (billion) Forecast, by Application 2020 & 2033
- Table 84: Japan Heat Shrink Labels Volume (K) Forecast, by Application 2020 & 2033
- Table 85: South Korea Heat Shrink Labels Revenue (billion) Forecast, by Application 2020 & 2033
- Table 86: South Korea Heat Shrink Labels Volume (K) Forecast, by Application 2020 & 2033
- Table 87: ASEAN Heat Shrink Labels Revenue (billion) Forecast, by Application 2020 & 2033
- Table 88: ASEAN Heat Shrink Labels Volume (K) Forecast, by Application 2020 & 2033
- Table 89: Oceania Heat Shrink Labels Revenue (billion) Forecast, by Application 2020 & 2033
- Table 90: Oceania Heat Shrink Labels Volume (K) Forecast, by Application 2020 & 2033
- Table 91: Rest of Asia Pacific Heat Shrink Labels Revenue (billion) Forecast, by Application 2020 & 2033
- Table 92: Rest of Asia Pacific Heat Shrink Labels Volume (K) Forecast, by Application 2020 & 2033
Frequently Asked Questions
1. What is the projected Compound Annual Growth Rate (CAGR) of the Heat Shrink Labels?
The projected CAGR is approximately 13.46%.
2. Which companies are prominent players in the Heat Shrink Labels?
Key companies in the market include Fuji Seal, CCL Industries, Multi-Color, Klockner Pentaplast, Huhtamaki, Clondalkin Group, Brook & Whittle, WestRock, Fort Dearborn Company, Yinjinda, Jinghong, Chengxin, Zijiang.
3. What are the main segments of the Heat Shrink Labels?
The market segments include Application, Type.
4. Can you provide details about the market size?
The market size is estimated to be USD 14.62 billion as of 2022.
5. What are some drivers contributing to market growth?
N/A
6. What are the notable trends driving market growth?
N/A
7. Are there any restraints impacting market growth?
N/A
8. Can you provide examples of recent developments in the market?
N/A
9. What pricing options are available for accessing the report?
Pricing options include single-user, multi-user, and enterprise licenses priced at USD 3950.00, USD 5925.00, and USD 7900.00 respectively.
10. Is the market size provided in terms of value or volume?
The market size is provided in terms of value, measured in billion and volume, measured in K.
11. Are there any specific market keywords associated with the report?
Yes, the market keyword associated with the report is "Heat Shrink Labels," which aids in identifying and referencing the specific market segment covered.
12. How do I determine which pricing option suits my needs best?
The pricing options vary based on user requirements and access needs. Individual users may opt for single-user licenses, while businesses requiring broader access may choose multi-user or enterprise licenses for cost-effective access to the report.
13. Are there any additional resources or data provided in the Heat Shrink Labels report?
While the report offers comprehensive insights, it's advisable to review the specific contents or supplementary materials provided to ascertain if additional resources or data are available.
14. How can I stay updated on further developments or reports in the Heat Shrink Labels?
To stay informed about further developments, trends, and reports in the Heat Shrink Labels, consider subscribing to industry newsletters, following relevant companies and organizations, or regularly checking reputable industry news sources and publications.
Methodology
Step 1 - Identification of Relevant Samples Size from Population Database


Step 2 - Approaches for Defining Global Market Size (Value, Volume* & Price*)

Note*: In applicable scenarios
Step 3 - Data Sources
Primary Research
- Web Analytics
- Survey Reports
- Research Institute
- Latest Research Reports
- Opinion Leaders
Secondary Research
- Annual Reports
- White Paper
- Latest Press Release
- Industry Association
- Paid Database
- Investor Presentations

Step 4 - Data Triangulation
Involves using different sources of information in order to increase the validity of a study
These sources are likely to be stakeholders in a program - participants, other researchers, program staff, other community members, and so on.
Then we put all data in single framework & apply various statistical tools to find out the dynamic on the market.
During the analysis stage, feedback from the stakeholder groups would be compared to determine areas of agreement as well as areas of divergence