Key Insights
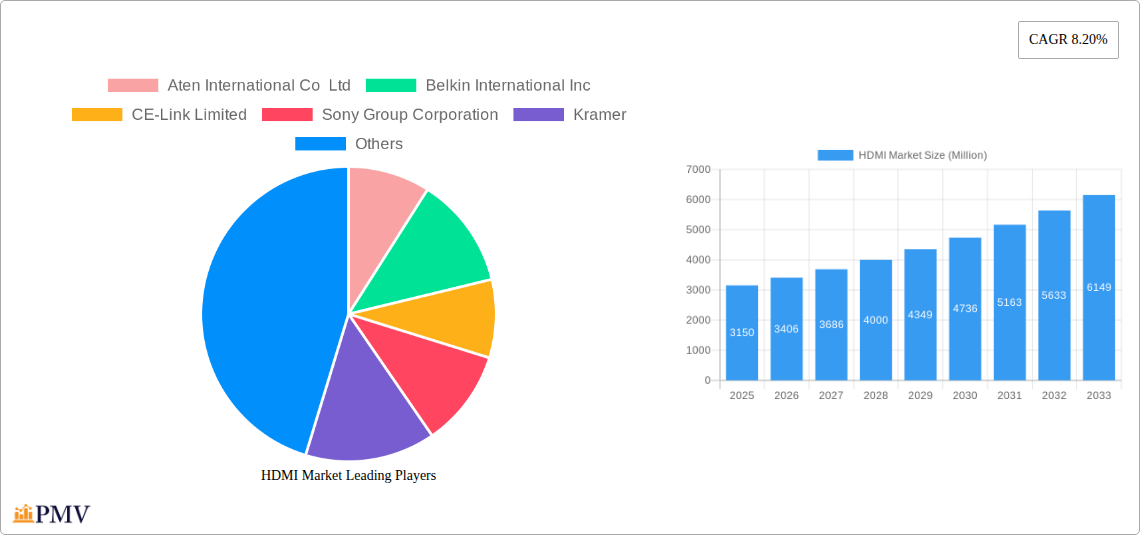
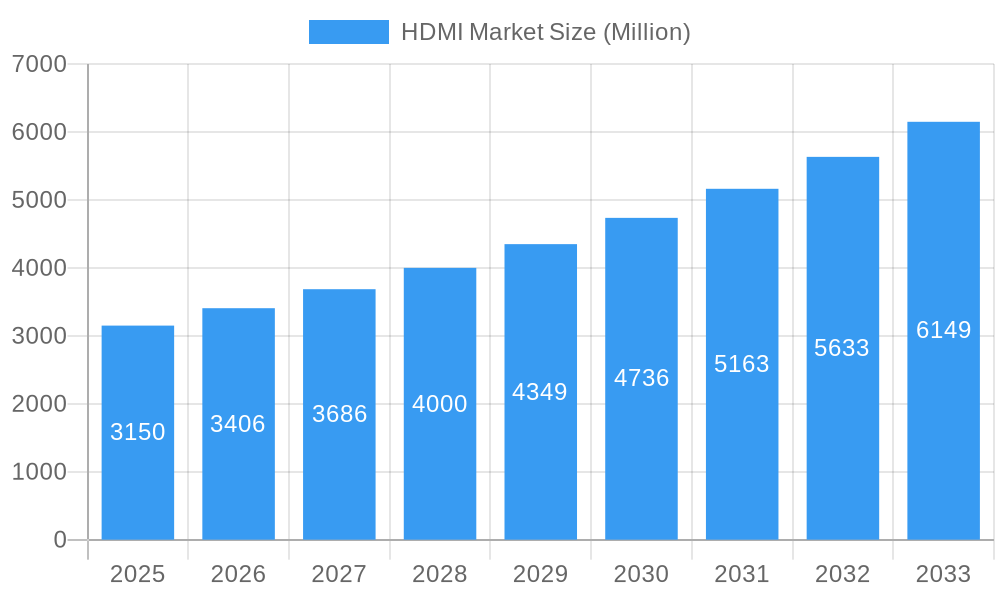
The HDMI market, valued at $3.15 billion in 2025, is experiencing robust growth, projected to expand at a compound annual growth rate (CAGR) of 8.20% from 2025 to 2033. This expansion is driven by several key factors. The increasing adoption of high-resolution displays, such as 4K and 8K televisions, and the rising demand for superior audio-visual experiences in home theaters and gaming consoles are significant contributors. Furthermore, the proliferation of streaming services and the growing popularity of smart TVs further fuel market demand. Technological advancements, including the introduction of HDMI 2.1 with its support for higher bandwidth and enhanced features like 8K resolution and variable refresh rate (VRR), are also key drivers. The competitive landscape is characterized by a mix of established players like Sony, Belkin, and Philips, alongside specialized cable manufacturers and emerging technology companies. The market is segmented by cable type (standard, high-speed, ultra-high-speed), application (consumer electronics, professional AV), and region. While pricing pressures and the emergence of alternative connectivity technologies represent potential restraints, the overall market outlook remains positive, fueled by ongoing technological advancements and increasing consumer demand for high-quality video and audio.
HDMI Market Market Size (In Billion)
The continued integration of HDMI into diverse electronics, from laptops and smartphones to automotive infotainment systems, indicates a broad and expanding market. Companies are focusing on innovation within the HDMI ecosystem, including the development of more compact and durable cables, enhanced signal processing capabilities, and seamless integration with other technologies. This focus on innovation and expansion into new application areas will likely contribute to the sustained growth of the HDMI market over the forecast period. Geographical growth will likely see strong performance in developing economies, driven by increasing disposable income and growing consumer electronics adoption. The industry’s ability to effectively address potential challenges, such as managing supply chain complexities and staying ahead of technological advancements, will be crucial in ensuring the continued success of the HDMI market.
HDMI Market Company Market Share
HDMI Market: A Comprehensive Report (2019-2033)
This comprehensive report provides an in-depth analysis of the global HDMI market, encompassing historical data (2019-2024), current estimations (2025), and future forecasts (2025-2033). It delves into market structure, competitive dynamics, industry trends, leading players, and key developments, offering valuable insights for businesses operating in or seeking to enter this dynamic sector. The report projects a market value exceeding XX Million by 2033, driven by robust growth across key segments.
HDMI Market Structure & Competitive Dynamics
The HDMI market exhibits a moderately consolidated structure, with a handful of major players commanding significant market share. However, the presence of numerous smaller companies, particularly in manufacturing components, creates a competitive landscape. Innovation ecosystems are robust, driven by advancements in video resolution, bandwidth, and data transmission capabilities. Regulatory frameworks, while generally supportive of technological advancements, vary across regions, influencing market access and product compliance. Product substitutes, such as DisplayPort and wireless technologies, present ongoing challenges. End-user trends indicate a strong preference for high-resolution video and seamless connectivity, driving demand for premium HDMI products. Mergers and acquisitions (M&A) activity has been moderate in recent years, with deal values averaging around XX Million.
- Market Concentration: High, with top 5 players holding approximately xx% market share.
- Innovation Ecosystem: Active, focused on higher bandwidths (e.g., HDMI 2.1), improved power delivery, and enhanced features.
- Regulatory Frameworks: Varied across regions, impacting product certification and market entry.
- Product Substitutes: DisplayPort and wireless technologies pose a competitive threat.
- M&A Activity: Moderate, with total deal value reaching approximately XX Million in the last five years.
HDMI Market Industry Trends & Insights
The HDMI market is characterized by a steady growth trajectory, driven by factors such as the increasing adoption of high-definition displays, the proliferation of smart home devices, and the growing demand for immersive entertainment experiences. The compound annual growth rate (CAGR) during the forecast period (2025-2033) is projected to be xx%, fueled by technological advancements like higher bandwidth capabilities and support for 8K resolution. Market penetration continues to rise across various segments, with particular strength in the consumer electronics and professional AV sectors. However, the emergence of competitive technologies like wireless transmission standards presents a potential challenge. The market exhibits diverse consumer preferences, with a noticeable shift towards premium features, such as improved color accuracy and higher refresh rates.
Dominant Markets & Segments in HDMI Market
The North American region currently holds a commanding position in the HDMI market, underpinned by robust consumer expenditure on advanced electronics and a well-established technological infrastructure. Concurrently, the Asia-Pacific region is poised for exceptional growth, driven by its dynamic economic trajectory, escalating urbanization, and a burgeoning middle class with an increasing appetite for sophisticated home entertainment solutions.
- Key Growth Catalysts in North America: High disposable income levels, a mature and diverse consumer electronics ecosystem, and resilient technological infrastructure.
- Key Growth Catalysts in Asia-Pacific: Rapid economic expansion, a growing affluent demographic, widespread urbanization, and a surge in demand for immersive home entertainment experiences.
- Dominant Market Segment: The consumer electronics segment continues to lead, contributing a substantial portion of the total market revenue. This dominance is fueled by the pervasive adoption of high-definition televisions, cutting-edge gaming consoles, and advanced streaming devices that rely heavily on HDMI connectivity.
HDMI Market Product Innovations
Recent product innovations include the introduction of higher-bandwidth HDMI cables supporting 8K resolution and higher refresh rates. This focus on enhanced video quality and data transfer speeds meets growing consumer demand for immersive experiences. Furthermore, advancements in power delivery capabilities through HDMI have broadened applications to devices requiring more power, expanding the market's reach. The integration of Ethernet connectivity within HDMI cables streamlines network capabilities, simplifying installations and enhancing user experience.
Report Segmentation & Scope
This report segments the HDMI market by product type (cables, connectors, adapters), application (consumer electronics, professional AV, automotive), and geography (North America, Europe, Asia-Pacific, Rest of the World). Each segment's growth projection, market size, and competitive landscape are thoroughly examined. For instance, the consumer electronics segment is projected to grow at a CAGR of xx% due to the increasing adoption of 4K and 8K televisions. Conversely, the automotive segment is expected to grow steadily but at a comparatively slower rate due to its higher integration complexity.
Key Drivers of HDMI Market Growth
The HDMI market is experiencing robust expansion driven by a confluence of influential factors. Paramount among these are continuous technological advancements, notably the introduction and widespread adoption of high-bandwidth standards like HDMI 2.1, which enable higher resolutions and refresh rates. The thriving global consumer electronics industry, propelled by rising disposable incomes and an escalating demand for premium home entertainment systems, acts as a significant market stimulant. Furthermore, favorable government initiatives in various geographies that champion the development of digital infrastructure provide additional impetus for market growth.
Challenges in the HDMI Market Sector
Despite its growth trajectory, the HDMI market is not without its hurdles. The persistent competition from alternative connectivity technologies, including advanced wireless transmission standards and DisplayPort, presents a notable challenge. Disruptions within the global supply chain, particularly concerning the availability of critical raw materials and components, can adversely affect manufacturing timelines and overall market stability. Moreover, inherent fluctuations in the prices of raw materials can impact product pricing strategies and subsequently influence profit margins for manufacturers.
Leading Players in the HDMI Market
- Aten International Co Ltd
- Belkin International Inc
- CE-Link Limited
- Sony Group Corporation
- Kramer
- Nordost Cables
- Koninklijke Philips NV
- Eaton Corporation
- Extron
- Cheng Uei Precision Industry Co Ltd (FoxLink)
- Amphenol Corporation
- Foxconn Interconnect Technology
- Pure Fi Inc
- Shenzhen DNS Industries Co Ltd
- Honeywell Connection (Honeywell International Inc)
- The Chord Company Ltd
Key Developments in HDMI Market Sector
- March 2024: PIC Wire and Cable has distinguished itself by launching the industry's inaugural HDMI-certified cable specifically engineered for the demanding aerospace and defense sectors. The H1926-HS cable boasts support for 4K video resolutions and incorporates HDMI Ethernet Channel capabilities, signifying a strategic expansion into specialized and high-performance markets.
- January 2024: Katlax has reinforced the enduring relevance and widespread adoption of the HDMI standard by unveiling an innovative new series of HDMI connectors. This development underscores the continuous commitment to providing reliable and high-quality connectivity solutions for the ever-evolving consumer electronics landscape.
Strategic HDMI Market Outlook
The HDMI market presents significant future potential. Continued advancements in bandwidth and resolution capabilities will attract consumers and open doors to emerging applications. Strategic opportunities lie in expanding into specialized sectors (like aerospace, as demonstrated by PIC Wire and Cable) and developing integrated solutions that enhance the user experience beyond simple connectivity. The market's growth trajectory suggests a promising outlook for companies that adapt to evolving technologies and consumer preferences.
HDMI Market Segmentation
-
1. Cable Type
- 1.1. Standard
- 1.2. High-speed
- 1.3. Premium High-speed
- 1.4. Ultra High-speed
-
2. Connector Type
- 2.1. Type A (Standard)
- 2.2. Type B (Dual-link)
- 2.3. Type C (Mini)
- 2.4. Type D (Micro)
- 2.5. Type E
-
3. Application
- 3.1. Gaming Consoles
- 3.2. TVs
- 3.3. Mobile Phones
- 3.4. Automotive Systems
- 3.5. Laptops and Tablets
- 3.6. Other Applications
HDMI Market Segmentation By Geography
- 1. North America
- 2. Europe
- 3. Asia
- 4. Australia and New Zealand
- 5. Latin America
- 6. Middle East and Africa
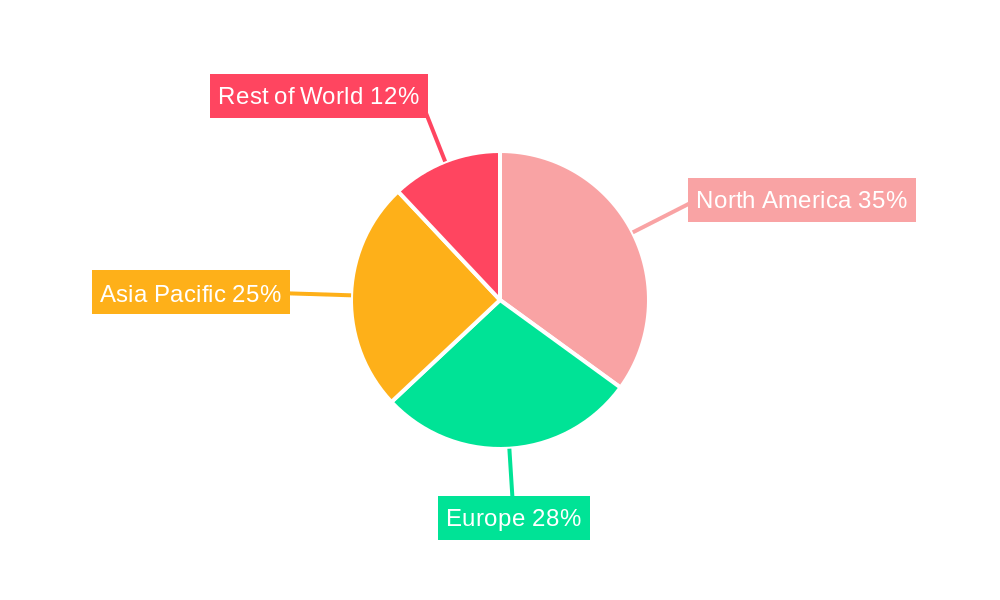
HDMI Market Regional Market Share
Geographic Coverage of HDMI Market
HDMI Market REPORT HIGHLIGHTS
| Aspects | Details |
|---|---|
| Study Period | 2020-2034 |
| Base Year | 2025 |
| Estimated Year | 2026 |
| Forecast Period | 2026-2034 |
| Historical Period | 2020-2025 |
| Growth Rate | CAGR of 8.20% from 2020-2034 |
| Segmentation |
|
Table of Contents
- 1. Introduction
- 1.1. Research Scope
- 1.2. Market Segmentation
- 1.3. Research Objective
- 1.4. Definitions and Assumptions
- 2. Executive Summary
- 2.1. Market Snapshot
- 3. Market Dynamics
- 3.1. Market Drivers
- 3.2. Market Restrains
- 3.3. Market Trends
- 3.4. Market Opportunities
- 4. Market Factor Analysis
- 4.1. Porters Five Forces
- 4.1.1. Bargaining Power of Suppliers
- 4.1.2. Bargaining Power of Buyers
- 4.1.3. Threat of New Entrants
- 4.1.4. Threat of Substitutes
- 4.1.5. Competitive Rivalry
- 4.2. PESTEL analysis
- 4.3. BCG Analysis
- 4.3.1. Stars (High Growth, High Market Share)
- 4.3.2. Cash Cows (Low Growth, High Market Share)
- 4.3.3. Question Mark (High Growth, Low Market Share)
- 4.3.4. Dogs (Low Growth, Low Market Share)
- 4.4. Ansoff Matrix Analysis
- 4.5. Supply Chain Analysis
- 4.6. Regulatory Landscape
- 4.7. Current Market Potential and Opportunity Assessment (TAM–SAM–SOM Framework)
- 4.8. PMV Analyst Note
- 4.1. Porters Five Forces
- 5. Market Analysis, Insights and Forecast 2021-2033
- 5.1. Market Analysis, Insights and Forecast - by Cable Type
- 5.1.1. Standard
- 5.1.2. High-speed
- 5.1.3. Premium High-speed
- 5.1.4. Ultra High-speed
- 5.2. Market Analysis, Insights and Forecast - by Connector Type
- 5.2.1. Type A (Standard)
- 5.2.2. Type B (Dual-link)
- 5.2.3. Type C (Mini)
- 5.2.4. Type D (Micro)
- 5.2.5. Type E
- 5.3. Market Analysis, Insights and Forecast - by Application
- 5.3.1. Gaming Consoles
- 5.3.2. TVs
- 5.3.3. Mobile Phones
- 5.3.4. Automotive Systems
- 5.3.5. Laptops and Tablets
- 5.3.6. Other Applications
- 5.4. Market Analysis, Insights and Forecast - by Region
- 5.4.1. North America
- 5.4.2. Europe
- 5.4.3. Asia
- 5.4.4. Australia and New Zealand
- 5.4.5. Latin America
- 5.4.6. Middle East and Africa
- 5.1. Market Analysis, Insights and Forecast - by Cable Type
- 6. Global HDMI Market Analysis, Insights and Forecast, 2021-2033
- 6.1. Market Analysis, Insights and Forecast - by Cable Type
- 6.1.1. Standard
- 6.1.2. High-speed
- 6.1.3. Premium High-speed
- 6.1.4. Ultra High-speed
- 6.2. Market Analysis, Insights and Forecast - by Connector Type
- 6.2.1. Type A (Standard)
- 6.2.2. Type B (Dual-link)
- 6.2.3. Type C (Mini)
- 6.2.4. Type D (Micro)
- 6.2.5. Type E
- 6.3. Market Analysis, Insights and Forecast - by Application
- 6.3.1. Gaming Consoles
- 6.3.2. TVs
- 6.3.3. Mobile Phones
- 6.3.4. Automotive Systems
- 6.3.5. Laptops and Tablets
- 6.3.6. Other Applications
- 6.1. Market Analysis, Insights and Forecast - by Cable Type
- 7. North America HDMI Market Analysis, Insights and Forecast, 2020-2032
- 7.1. Market Analysis, Insights and Forecast - by Cable Type
- 7.1.1. Standard
- 7.1.2. High-speed
- 7.1.3. Premium High-speed
- 7.1.4. Ultra High-speed
- 7.2. Market Analysis, Insights and Forecast - by Connector Type
- 7.2.1. Type A (Standard)
- 7.2.2. Type B (Dual-link)
- 7.2.3. Type C (Mini)
- 7.2.4. Type D (Micro)
- 7.2.5. Type E
- 7.3. Market Analysis, Insights and Forecast - by Application
- 7.3.1. Gaming Consoles
- 7.3.2. TVs
- 7.3.3. Mobile Phones
- 7.3.4. Automotive Systems
- 7.3.5. Laptops and Tablets
- 7.3.6. Other Applications
- 7.1. Market Analysis, Insights and Forecast - by Cable Type
- 8. Europe HDMI Market Analysis, Insights and Forecast, 2020-2032
- 8.1. Market Analysis, Insights and Forecast - by Cable Type
- 8.1.1. Standard
- 8.1.2. High-speed
- 8.1.3. Premium High-speed
- 8.1.4. Ultra High-speed
- 8.2. Market Analysis, Insights and Forecast - by Connector Type
- 8.2.1. Type A (Standard)
- 8.2.2. Type B (Dual-link)
- 8.2.3. Type C (Mini)
- 8.2.4. Type D (Micro)
- 8.2.5. Type E
- 8.3. Market Analysis, Insights and Forecast - by Application
- 8.3.1. Gaming Consoles
- 8.3.2. TVs
- 8.3.3. Mobile Phones
- 8.3.4. Automotive Systems
- 8.3.5. Laptops and Tablets
- 8.3.6. Other Applications
- 8.1. Market Analysis, Insights and Forecast - by Cable Type
- 9. Asia HDMI Market Analysis, Insights and Forecast, 2020-2032
- 9.1. Market Analysis, Insights and Forecast - by Cable Type
- 9.1.1. Standard
- 9.1.2. High-speed
- 9.1.3. Premium High-speed
- 9.1.4. Ultra High-speed
- 9.2. Market Analysis, Insights and Forecast - by Connector Type
- 9.2.1. Type A (Standard)
- 9.2.2. Type B (Dual-link)
- 9.2.3. Type C (Mini)
- 9.2.4. Type D (Micro)
- 9.2.5. Type E
- 9.3. Market Analysis, Insights and Forecast - by Application
- 9.3.1. Gaming Consoles
- 9.3.2. TVs
- 9.3.3. Mobile Phones
- 9.3.4. Automotive Systems
- 9.3.5. Laptops and Tablets
- 9.3.6. Other Applications
- 9.1. Market Analysis, Insights and Forecast - by Cable Type
- 10. Australia and New Zealand HDMI Market Analysis, Insights and Forecast, 2020-2032
- 10.1. Market Analysis, Insights and Forecast - by Cable Type
- 10.1.1. Standard
- 10.1.2. High-speed
- 10.1.3. Premium High-speed
- 10.1.4. Ultra High-speed
- 10.2. Market Analysis, Insights and Forecast - by Connector Type
- 10.2.1. Type A (Standard)
- 10.2.2. Type B (Dual-link)
- 10.2.3. Type C (Mini)
- 10.2.4. Type D (Micro)
- 10.2.5. Type E
- 10.3. Market Analysis, Insights and Forecast - by Application
- 10.3.1. Gaming Consoles
- 10.3.2. TVs
- 10.3.3. Mobile Phones
- 10.3.4. Automotive Systems
- 10.3.5. Laptops and Tablets
- 10.3.6. Other Applications
- 10.1. Market Analysis, Insights and Forecast - by Cable Type
- 11. Latin America HDMI Market Analysis, Insights and Forecast, 2020-2032
- 11.1. Market Analysis, Insights and Forecast - by Cable Type
- 11.1.1. Standard
- 11.1.2. High-speed
- 11.1.3. Premium High-speed
- 11.1.4. Ultra High-speed
- 11.2. Market Analysis, Insights and Forecast - by Connector Type
- 11.2.1. Type A (Standard)
- 11.2.2. Type B (Dual-link)
- 11.2.3. Type C (Mini)
- 11.2.4. Type D (Micro)
- 11.2.5. Type E
- 11.3. Market Analysis, Insights and Forecast - by Application
- 11.3.1. Gaming Consoles
- 11.3.2. TVs
- 11.3.3. Mobile Phones
- 11.3.4. Automotive Systems
- 11.3.5. Laptops and Tablets
- 11.3.6. Other Applications
- 11.1. Market Analysis, Insights and Forecast - by Cable Type
- 12. Middle East and Africa HDMI Market Analysis, Insights and Forecast, 2020-2032
- 12.1. Market Analysis, Insights and Forecast - by Cable Type
- 12.1.1. Standard
- 12.1.2. High-speed
- 12.1.3. Premium High-speed
- 12.1.4. Ultra High-speed
- 12.2. Market Analysis, Insights and Forecast - by Connector Type
- 12.2.1. Type A (Standard)
- 12.2.2. Type B (Dual-link)
- 12.2.3. Type C (Mini)
- 12.2.4. Type D (Micro)
- 12.2.5. Type E
- 12.3. Market Analysis, Insights and Forecast - by Application
- 12.3.1. Gaming Consoles
- 12.3.2. TVs
- 12.3.3. Mobile Phones
- 12.3.4. Automotive Systems
- 12.3.5. Laptops and Tablets
- 12.3.6. Other Applications
- 12.1. Market Analysis, Insights and Forecast - by Cable Type
- 13. Competitive Analysis
- 13.1. Company Profiles
- 13.1.1 Aten International Co Ltd
- 13.1.1.1. Company Overview
- 13.1.1.2. Products
- 13.1.1.3. Company Financials
- 13.1.1.4. SWOT Analysis
- 13.1.2 Belkin International Inc
- 13.1.2.1. Company Overview
- 13.1.2.2. Products
- 13.1.2.3. Company Financials
- 13.1.2.4. SWOT Analysis
- 13.1.3 CE-Link Limited
- 13.1.3.1. Company Overview
- 13.1.3.2. Products
- 13.1.3.3. Company Financials
- 13.1.3.4. SWOT Analysis
- 13.1.4 Sony Group Corporation
- 13.1.4.1. Company Overview
- 13.1.4.2. Products
- 13.1.4.3. Company Financials
- 13.1.4.4. SWOT Analysis
- 13.1.5 Kramer
- 13.1.5.1. Company Overview
- 13.1.5.2. Products
- 13.1.5.3. Company Financials
- 13.1.5.4. SWOT Analysis
- 13.1.6 Nordost Cables
- 13.1.6.1. Company Overview
- 13.1.6.2. Products
- 13.1.6.3. Company Financials
- 13.1.6.4. SWOT Analysis
- 13.1.7 Koninklijke Philips NV
- 13.1.7.1. Company Overview
- 13.1.7.2. Products
- 13.1.7.3. Company Financials
- 13.1.7.4. SWOT Analysis
- 13.1.8 Eaton Corporation
- 13.1.8.1. Company Overview
- 13.1.8.2. Products
- 13.1.8.3. Company Financials
- 13.1.8.4. SWOT Analysis
- 13.1.9 Extron
- 13.1.9.1. Company Overview
- 13.1.9.2. Products
- 13.1.9.3. Company Financials
- 13.1.9.4. SWOT Analysis
- 13.1.10 Cheng Uei Precision Industry Co Ltd (FoxLink)
- 13.1.10.1. Company Overview
- 13.1.10.2. Products
- 13.1.10.3. Company Financials
- 13.1.10.4. SWOT Analysis
- 13.1.11 Amphenol Corporation
- 13.1.11.1. Company Overview
- 13.1.11.2. Products
- 13.1.11.3. Company Financials
- 13.1.11.4. SWOT Analysis
- 13.1.12 Foxconn Interconnect Technology
- 13.1.12.1. Company Overview
- 13.1.12.2. Products
- 13.1.12.3. Company Financials
- 13.1.12.4. SWOT Analysis
- 13.1.13 Pure Fi Inc
- 13.1.13.1. Company Overview
- 13.1.13.2. Products
- 13.1.13.3. Company Financials
- 13.1.13.4. SWOT Analysis
- 13.1.14 Shenzhen DNS Industries Co Ltd
- 13.1.14.1. Company Overview
- 13.1.14.2. Products
- 13.1.14.3. Company Financials
- 13.1.14.4. SWOT Analysis
- 13.1.15 Honeywell Connection (Honeywell International Inc )
- 13.1.15.1. Company Overview
- 13.1.15.2. Products
- 13.1.15.3. Company Financials
- 13.1.15.4. SWOT Analysis
- 13.1.16 The Chord Company Lt
- 13.1.16.1. Company Overview
- 13.1.16.2. Products
- 13.1.16.3. Company Financials
- 13.1.16.4. SWOT Analysis
- 13.1.1 Aten International Co Ltd
- 13.2. Market Entropy
- 13.2.1 Company's Key Areas Served
- 13.2.2 Recent Developments
- 13.3. Company Market Share Analysis 2025
- 13.3.1 Top 5 Companies Market Share Analysis
- 13.3.2 Top 3 Companies Market Share Analysis
- 13.4. List of Potential Customers
- 14. Research Methodology
List of Figures
- Figure 1: Global HDMI Market Revenue Breakdown (Million, %) by Region 2025 & 2033
- Figure 2: Global HDMI Market Volume Breakdown (Billion, %) by Region 2025 & 2033
- Figure 3: North America HDMI Market Revenue (Million), by Cable Type 2025 & 2033
- Figure 4: North America HDMI Market Volume (Billion), by Cable Type 2025 & 2033
- Figure 5: North America HDMI Market Revenue Share (%), by Cable Type 2025 & 2033
- Figure 6: North America HDMI Market Volume Share (%), by Cable Type 2025 & 2033
- Figure 7: North America HDMI Market Revenue (Million), by Connector Type 2025 & 2033
- Figure 8: North America HDMI Market Volume (Billion), by Connector Type 2025 & 2033
- Figure 9: North America HDMI Market Revenue Share (%), by Connector Type 2025 & 2033
- Figure 10: North America HDMI Market Volume Share (%), by Connector Type 2025 & 2033
- Figure 11: North America HDMI Market Revenue (Million), by Application 2025 & 2033
- Figure 12: North America HDMI Market Volume (Billion), by Application 2025 & 2033
- Figure 13: North America HDMI Market Revenue Share (%), by Application 2025 & 2033
- Figure 14: North America HDMI Market Volume Share (%), by Application 2025 & 2033
- Figure 15: North America HDMI Market Revenue (Million), by Country 2025 & 2033
- Figure 16: North America HDMI Market Volume (Billion), by Country 2025 & 2033
- Figure 17: North America HDMI Market Revenue Share (%), by Country 2025 & 2033
- Figure 18: North America HDMI Market Volume Share (%), by Country 2025 & 2033
- Figure 19: Europe HDMI Market Revenue (Million), by Cable Type 2025 & 2033
- Figure 20: Europe HDMI Market Volume (Billion), by Cable Type 2025 & 2033
- Figure 21: Europe HDMI Market Revenue Share (%), by Cable Type 2025 & 2033
- Figure 22: Europe HDMI Market Volume Share (%), by Cable Type 2025 & 2033
- Figure 23: Europe HDMI Market Revenue (Million), by Connector Type 2025 & 2033
- Figure 24: Europe HDMI Market Volume (Billion), by Connector Type 2025 & 2033
- Figure 25: Europe HDMI Market Revenue Share (%), by Connector Type 2025 & 2033
- Figure 26: Europe HDMI Market Volume Share (%), by Connector Type 2025 & 2033
- Figure 27: Europe HDMI Market Revenue (Million), by Application 2025 & 2033
- Figure 28: Europe HDMI Market Volume (Billion), by Application 2025 & 2033
- Figure 29: Europe HDMI Market Revenue Share (%), by Application 2025 & 2033
- Figure 30: Europe HDMI Market Volume Share (%), by Application 2025 & 2033
- Figure 31: Europe HDMI Market Revenue (Million), by Country 2025 & 2033
- Figure 32: Europe HDMI Market Volume (Billion), by Country 2025 & 2033
- Figure 33: Europe HDMI Market Revenue Share (%), by Country 2025 & 2033
- Figure 34: Europe HDMI Market Volume Share (%), by Country 2025 & 2033
- Figure 35: Asia HDMI Market Revenue (Million), by Cable Type 2025 & 2033
- Figure 36: Asia HDMI Market Volume (Billion), by Cable Type 2025 & 2033
- Figure 37: Asia HDMI Market Revenue Share (%), by Cable Type 2025 & 2033
- Figure 38: Asia HDMI Market Volume Share (%), by Cable Type 2025 & 2033
- Figure 39: Asia HDMI Market Revenue (Million), by Connector Type 2025 & 2033
- Figure 40: Asia HDMI Market Volume (Billion), by Connector Type 2025 & 2033
- Figure 41: Asia HDMI Market Revenue Share (%), by Connector Type 2025 & 2033
- Figure 42: Asia HDMI Market Volume Share (%), by Connector Type 2025 & 2033
- Figure 43: Asia HDMI Market Revenue (Million), by Application 2025 & 2033
- Figure 44: Asia HDMI Market Volume (Billion), by Application 2025 & 2033
- Figure 45: Asia HDMI Market Revenue Share (%), by Application 2025 & 2033
- Figure 46: Asia HDMI Market Volume Share (%), by Application 2025 & 2033
- Figure 47: Asia HDMI Market Revenue (Million), by Country 2025 & 2033
- Figure 48: Asia HDMI Market Volume (Billion), by Country 2025 & 2033
- Figure 49: Asia HDMI Market Revenue Share (%), by Country 2025 & 2033
- Figure 50: Asia HDMI Market Volume Share (%), by Country 2025 & 2033
- Figure 51: Australia and New Zealand HDMI Market Revenue (Million), by Cable Type 2025 & 2033
- Figure 52: Australia and New Zealand HDMI Market Volume (Billion), by Cable Type 2025 & 2033
- Figure 53: Australia and New Zealand HDMI Market Revenue Share (%), by Cable Type 2025 & 2033
- Figure 54: Australia and New Zealand HDMI Market Volume Share (%), by Cable Type 2025 & 2033
- Figure 55: Australia and New Zealand HDMI Market Revenue (Million), by Connector Type 2025 & 2033
- Figure 56: Australia and New Zealand HDMI Market Volume (Billion), by Connector Type 2025 & 2033
- Figure 57: Australia and New Zealand HDMI Market Revenue Share (%), by Connector Type 2025 & 2033
- Figure 58: Australia and New Zealand HDMI Market Volume Share (%), by Connector Type 2025 & 2033
- Figure 59: Australia and New Zealand HDMI Market Revenue (Million), by Application 2025 & 2033
- Figure 60: Australia and New Zealand HDMI Market Volume (Billion), by Application 2025 & 2033
- Figure 61: Australia and New Zealand HDMI Market Revenue Share (%), by Application 2025 & 2033
- Figure 62: Australia and New Zealand HDMI Market Volume Share (%), by Application 2025 & 2033
- Figure 63: Australia and New Zealand HDMI Market Revenue (Million), by Country 2025 & 2033
- Figure 64: Australia and New Zealand HDMI Market Volume (Billion), by Country 2025 & 2033
- Figure 65: Australia and New Zealand HDMI Market Revenue Share (%), by Country 2025 & 2033
- Figure 66: Australia and New Zealand HDMI Market Volume Share (%), by Country 2025 & 2033
- Figure 67: Latin America HDMI Market Revenue (Million), by Cable Type 2025 & 2033
- Figure 68: Latin America HDMI Market Volume (Billion), by Cable Type 2025 & 2033
- Figure 69: Latin America HDMI Market Revenue Share (%), by Cable Type 2025 & 2033
- Figure 70: Latin America HDMI Market Volume Share (%), by Cable Type 2025 & 2033
- Figure 71: Latin America HDMI Market Revenue (Million), by Connector Type 2025 & 2033
- Figure 72: Latin America HDMI Market Volume (Billion), by Connector Type 2025 & 2033
- Figure 73: Latin America HDMI Market Revenue Share (%), by Connector Type 2025 & 2033
- Figure 74: Latin America HDMI Market Volume Share (%), by Connector Type 2025 & 2033
- Figure 75: Latin America HDMI Market Revenue (Million), by Application 2025 & 2033
- Figure 76: Latin America HDMI Market Volume (Billion), by Application 2025 & 2033
- Figure 77: Latin America HDMI Market Revenue Share (%), by Application 2025 & 2033
- Figure 78: Latin America HDMI Market Volume Share (%), by Application 2025 & 2033
- Figure 79: Latin America HDMI Market Revenue (Million), by Country 2025 & 2033
- Figure 80: Latin America HDMI Market Volume (Billion), by Country 2025 & 2033
- Figure 81: Latin America HDMI Market Revenue Share (%), by Country 2025 & 2033
- Figure 82: Latin America HDMI Market Volume Share (%), by Country 2025 & 2033
- Figure 83: Middle East and Africa HDMI Market Revenue (Million), by Cable Type 2025 & 2033
- Figure 84: Middle East and Africa HDMI Market Volume (Billion), by Cable Type 2025 & 2033
- Figure 85: Middle East and Africa HDMI Market Revenue Share (%), by Cable Type 2025 & 2033
- Figure 86: Middle East and Africa HDMI Market Volume Share (%), by Cable Type 2025 & 2033
- Figure 87: Middle East and Africa HDMI Market Revenue (Million), by Connector Type 2025 & 2033
- Figure 88: Middle East and Africa HDMI Market Volume (Billion), by Connector Type 2025 & 2033
- Figure 89: Middle East and Africa HDMI Market Revenue Share (%), by Connector Type 2025 & 2033
- Figure 90: Middle East and Africa HDMI Market Volume Share (%), by Connector Type 2025 & 2033
- Figure 91: Middle East and Africa HDMI Market Revenue (Million), by Application 2025 & 2033
- Figure 92: Middle East and Africa HDMI Market Volume (Billion), by Application 2025 & 2033
- Figure 93: Middle East and Africa HDMI Market Revenue Share (%), by Application 2025 & 2033
- Figure 94: Middle East and Africa HDMI Market Volume Share (%), by Application 2025 & 2033
- Figure 95: Middle East and Africa HDMI Market Revenue (Million), by Country 2025 & 2033
- Figure 96: Middle East and Africa HDMI Market Volume (Billion), by Country 2025 & 2033
- Figure 97: Middle East and Africa HDMI Market Revenue Share (%), by Country 2025 & 2033
- Figure 98: Middle East and Africa HDMI Market Volume Share (%), by Country 2025 & 2033
List of Tables
- Table 1: Global HDMI Market Revenue Million Forecast, by Cable Type 2020 & 2033
- Table 2: Global HDMI Market Volume Billion Forecast, by Cable Type 2020 & 2033
- Table 3: Global HDMI Market Revenue Million Forecast, by Connector Type 2020 & 2033
- Table 4: Global HDMI Market Volume Billion Forecast, by Connector Type 2020 & 2033
- Table 5: Global HDMI Market Revenue Million Forecast, by Application 2020 & 2033
- Table 6: Global HDMI Market Volume Billion Forecast, by Application 2020 & 2033
- Table 7: Global HDMI Market Revenue Million Forecast, by Region 2020 & 2033
- Table 8: Global HDMI Market Volume Billion Forecast, by Region 2020 & 2033
- Table 9: Global HDMI Market Revenue Million Forecast, by Cable Type 2020 & 2033
- Table 10: Global HDMI Market Volume Billion Forecast, by Cable Type 2020 & 2033
- Table 11: Global HDMI Market Revenue Million Forecast, by Connector Type 2020 & 2033
- Table 12: Global HDMI Market Volume Billion Forecast, by Connector Type 2020 & 2033
- Table 13: Global HDMI Market Revenue Million Forecast, by Application 2020 & 2033
- Table 14: Global HDMI Market Volume Billion Forecast, by Application 2020 & 2033
- Table 15: Global HDMI Market Revenue Million Forecast, by Country 2020 & 2033
- Table 16: Global HDMI Market Volume Billion Forecast, by Country 2020 & 2033
- Table 17: Global HDMI Market Revenue Million Forecast, by Cable Type 2020 & 2033
- Table 18: Global HDMI Market Volume Billion Forecast, by Cable Type 2020 & 2033
- Table 19: Global HDMI Market Revenue Million Forecast, by Connector Type 2020 & 2033
- Table 20: Global HDMI Market Volume Billion Forecast, by Connector Type 2020 & 2033
- Table 21: Global HDMI Market Revenue Million Forecast, by Application 2020 & 2033
- Table 22: Global HDMI Market Volume Billion Forecast, by Application 2020 & 2033
- Table 23: Global HDMI Market Revenue Million Forecast, by Country 2020 & 2033
- Table 24: Global HDMI Market Volume Billion Forecast, by Country 2020 & 2033
- Table 25: Global HDMI Market Revenue Million Forecast, by Cable Type 2020 & 2033
- Table 26: Global HDMI Market Volume Billion Forecast, by Cable Type 2020 & 2033
- Table 27: Global HDMI Market Revenue Million Forecast, by Connector Type 2020 & 2033
- Table 28: Global HDMI Market Volume Billion Forecast, by Connector Type 2020 & 2033
- Table 29: Global HDMI Market Revenue Million Forecast, by Application 2020 & 2033
- Table 30: Global HDMI Market Volume Billion Forecast, by Application 2020 & 2033
- Table 31: Global HDMI Market Revenue Million Forecast, by Country 2020 & 2033
- Table 32: Global HDMI Market Volume Billion Forecast, by Country 2020 & 2033
- Table 33: Global HDMI Market Revenue Million Forecast, by Cable Type 2020 & 2033
- Table 34: Global HDMI Market Volume Billion Forecast, by Cable Type 2020 & 2033
- Table 35: Global HDMI Market Revenue Million Forecast, by Connector Type 2020 & 2033
- Table 36: Global HDMI Market Volume Billion Forecast, by Connector Type 2020 & 2033
- Table 37: Global HDMI Market Revenue Million Forecast, by Application 2020 & 2033
- Table 38: Global HDMI Market Volume Billion Forecast, by Application 2020 & 2033
- Table 39: Global HDMI Market Revenue Million Forecast, by Country 2020 & 2033
- Table 40: Global HDMI Market Volume Billion Forecast, by Country 2020 & 2033
- Table 41: Global HDMI Market Revenue Million Forecast, by Cable Type 2020 & 2033
- Table 42: Global HDMI Market Volume Billion Forecast, by Cable Type 2020 & 2033
- Table 43: Global HDMI Market Revenue Million Forecast, by Connector Type 2020 & 2033
- Table 44: Global HDMI Market Volume Billion Forecast, by Connector Type 2020 & 2033
- Table 45: Global HDMI Market Revenue Million Forecast, by Application 2020 & 2033
- Table 46: Global HDMI Market Volume Billion Forecast, by Application 2020 & 2033
- Table 47: Global HDMI Market Revenue Million Forecast, by Country 2020 & 2033
- Table 48: Global HDMI Market Volume Billion Forecast, by Country 2020 & 2033
- Table 49: Global HDMI Market Revenue Million Forecast, by Cable Type 2020 & 2033
- Table 50: Global HDMI Market Volume Billion Forecast, by Cable Type 2020 & 2033
- Table 51: Global HDMI Market Revenue Million Forecast, by Connector Type 2020 & 2033
- Table 52: Global HDMI Market Volume Billion Forecast, by Connector Type 2020 & 2033
- Table 53: Global HDMI Market Revenue Million Forecast, by Application 2020 & 2033
- Table 54: Global HDMI Market Volume Billion Forecast, by Application 2020 & 2033
- Table 55: Global HDMI Market Revenue Million Forecast, by Country 2020 & 2033
- Table 56: Global HDMI Market Volume Billion Forecast, by Country 2020 & 2033
Frequently Asked Questions
1. What is the projected Compound Annual Growth Rate (CAGR) of the HDMI Market?
The projected CAGR is approximately 8.20%.
2. Which companies are prominent players in the HDMI Market?
Key companies in the market include Aten International Co Ltd, Belkin International Inc, CE-Link Limited, Sony Group Corporation, Kramer, Nordost Cables, Koninklijke Philips NV, Eaton Corporation, Extron, Cheng Uei Precision Industry Co Ltd (FoxLink), Amphenol Corporation, Foxconn Interconnect Technology, Pure Fi Inc, Shenzhen DNS Industries Co Ltd, Honeywell Connection (Honeywell International Inc ), The Chord Company Lt.
3. What are the main segments of the HDMI Market?
The market segments include Cable Type, Connector Type, Application.
4. Can you provide details about the market size?
The market size is estimated to be USD 3.15 Million as of 2022.
5. What are some drivers contributing to market growth?
Rising Adoption of Audio-video Devices; Rising Focus on the Gaming Industry Boosts the Adoption of Gaming Consoles. Fueling Market Expansion.
6. What are the notable trends driving market growth?
Applications in Gaming Consoles Are Expected to Hold Significant Market Share.
7. Are there any restraints impacting market growth?
Rising Adoption of Audio-video Devices; Rising Focus on the Gaming Industry Boosts the Adoption of Gaming Consoles. Fueling Market Expansion.
8. Can you provide examples of recent developments in the market?
March 2024: PIC Wire and Cable unveiled the industry's first HDMI-certified cable explicitly tailored for the aerospace and defense sectors. This introduction marks a pivotal evolution in connectivity standards, delivering solutions meticulously aligned with the distinct requirements of aerospace settings. The H1926-HS cable, crafted and rigorously validated to comply with HDMI Cable standards, represents a significant advancement in aerospace and defense connectivity. This cable supports 4K video resolutions, outshining the conventional 1080p, and ensures remarkable detail and color fidelity over distances of up to 5 m (16.4 ft). Additionally, its compatibility with the HDMI Ethernet Channel enhances networking capabilities, providing a fluid connectivity experience without necessitating extra cables.
9. What pricing options are available for accessing the report?
Pricing options include single-user, multi-user, and enterprise licenses priced at USD 4750, USD 5250, and USD 8750 respectively.
10. Is the market size provided in terms of value or volume?
The market size is provided in terms of value, measured in Million and volume, measured in Billion.
11. Are there any specific market keywords associated with the report?
Yes, the market keyword associated with the report is "HDMI Market," which aids in identifying and referencing the specific market segment covered.
12. How do I determine which pricing option suits my needs best?
The pricing options vary based on user requirements and access needs. Individual users may opt for single-user licenses, while businesses requiring broader access may choose multi-user or enterprise licenses for cost-effective access to the report.
13. Are there any additional resources or data provided in the HDMI Market report?
While the report offers comprehensive insights, it's advisable to review the specific contents or supplementary materials provided to ascertain if additional resources or data are available.
14. How can I stay updated on further developments or reports in the HDMI Market?
To stay informed about further developments, trends, and reports in the HDMI Market, consider subscribing to industry newsletters, following relevant companies and organizations, or regularly checking reputable industry news sources and publications.
Methodology
Step 1 - Identification of Relevant Samples Size from Population Database


Step 2 - Approaches for Defining Global Market Size (Value, Volume* & Price*)

Note*: In applicable scenarios
Step 3 - Data Sources
Primary Research
- Web Analytics
- Survey Reports
- Research Institute
- Latest Research Reports
- Opinion Leaders
Secondary Research
- Annual Reports
- White Paper
- Latest Press Release
- Industry Association
- Paid Database
- Investor Presentations

Step 4 - Data Triangulation
Involves using different sources of information in order to increase the validity of a study
These sources are likely to be stakeholders in a program - participants, other researchers, program staff, other community members, and so on.
Then we put all data in single framework & apply various statistical tools to find out the dynamic on the market.
During the analysis stage, feedback from the stakeholder groups would be compared to determine areas of agreement as well as areas of divergence

