
Key Insights
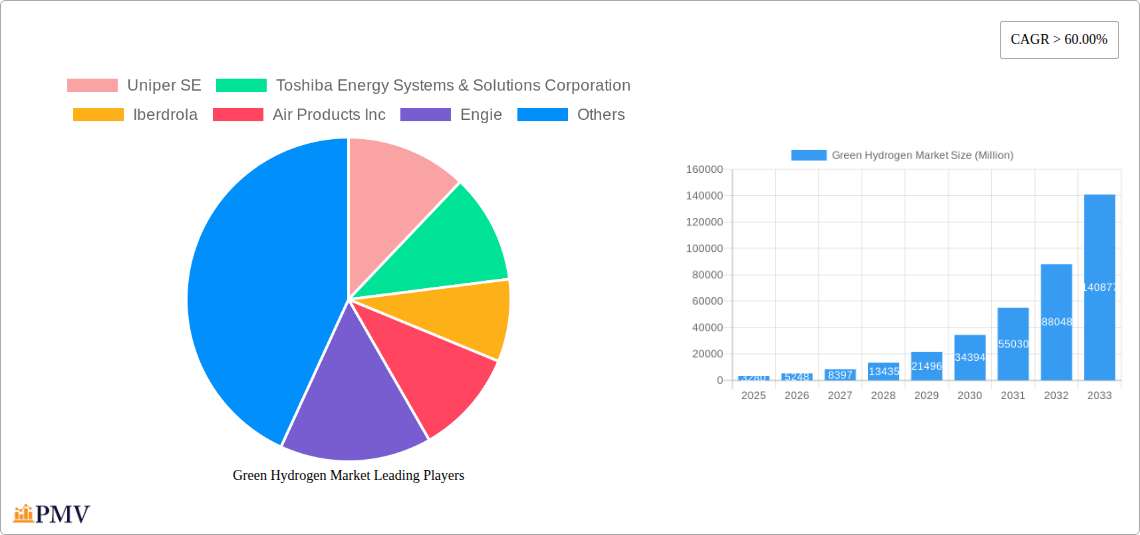
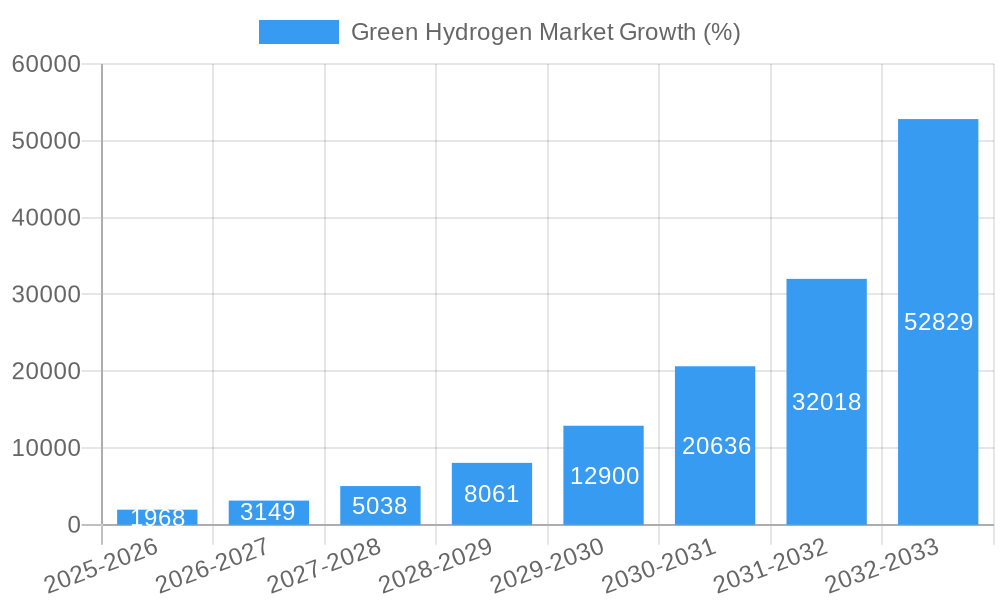
The green hydrogen market is experiencing explosive growth, projected to reach a market size of $3.28 billion in 2025 and exhibiting a remarkable Compound Annual Growth Rate (CAGR) exceeding 60%. This phenomenal expansion is driven by several key factors. Firstly, the urgent global need to decarbonize various sectors, including refining, chemicals, iron and steel, and transportation, is fueling significant investments in green hydrogen production. Government policies promoting renewable energy sources and incentivizing green hydrogen adoption are also playing a crucial role. Technological advancements in electrolysis, leading to increased efficiency and reduced costs of green hydrogen production, further accelerate market growth. Furthermore, growing concerns about climate change and the increasing scarcity of fossil fuels are pushing businesses and governments to explore sustainable alternatives, making green hydrogen an increasingly attractive option. Competition among established players like Uniper SE, Toshiba Energy Systems & Solutions Corporation, and Air Products Inc., along with emerging companies like Lhyfe and Nel ASA, is fostering innovation and driving down prices.
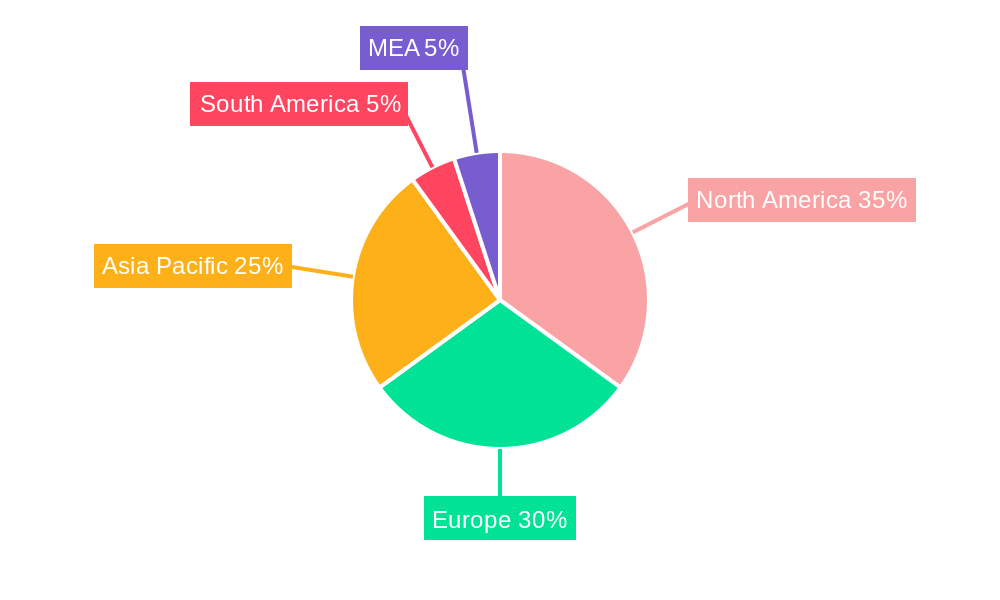
The market's segmentation highlights the diverse applications of green hydrogen. Refining and chemical industries are early adopters, using it in various industrial processes. The iron and steel sector is also seeing increasing interest in green hydrogen for its potential to significantly reduce carbon emissions during steel production. The transportation sector presents a massive long-term opportunity, with the development of hydrogen-powered vehicles gaining traction. Geographical distribution shows a strong presence across North America, Europe, and Asia Pacific, with North America and Europe currently leading in terms of both production and consumption. However, Asia Pacific is anticipated to witness the most significant growth in the coming years, driven by its large energy demand and substantial investments in renewable energy infrastructure. While the market faces challenges, such as the high initial investment costs associated with green hydrogen production and infrastructure development, ongoing technological advancements and supportive policy frameworks are expected to mitigate these restraints over the forecast period (2025-2033).
Green Hydrogen Market: A Comprehensive Report (2019-2033)
This in-depth report provides a comprehensive analysis of the Green Hydrogen Market, offering invaluable insights for investors, industry professionals, and strategic decision-makers. Covering the period 2019-2033, with a base year of 2025 and a forecast period of 2025-2033, this report meticulously examines market structure, competitive dynamics, technological advancements, and future growth potential. The market is expected to reach xx Million by 2033, exhibiting a CAGR of xx% during the forecast period.
Green Hydrogen Market Market Structure & Competitive Dynamics
The Green Hydrogen Market is characterized by a dynamic competitive landscape with a mix of established players and emerging startups. Market concentration is currently [mention level of concentration - e.g., moderate, high] with [mention percentage] market share held by the top five players. Innovation ecosystems are rapidly developing, driven by government incentives and increasing private investment. Regulatory frameworks, while still evolving, are becoming increasingly supportive of green hydrogen production and deployment. Product substitutes, such as blue hydrogen and other renewable energy sources, present competitive pressure, although green hydrogen's environmental advantages provide a strong differentiating factor. End-user trends show a growing demand across various sectors, particularly in refining, chemicals, and transportation. M&A activity has been significant, with deal values totaling xx Million in the last [mention time period, e.g., three years], driven by strategic acquisitions to expand capacity and market share.
- Market Share: [Insert data on market share for top players – e.g., Company A: 15%, Company B: 12%, etc. If data is unavailable use estimated values].
- M&A Deal Values: [Insert data on M&A deal values – e.g., 2022: xx Million, 2021: xx Million, etc. If data is unavailable use estimated values].
- Key Competitive Strategies: [mention examples of competitive strategies used by leading players, e.g. , strategic partnerships, technological advancements, capacity expansion]
Green Hydrogen Market Industry Trends & Insights
The Green Hydrogen Market is experiencing exponential growth, driven by several key factors. Increasing government support through subsidies, tax incentives, and carbon pricing mechanisms is accelerating adoption. Technological advancements in electrolyzer technology are driving down production costs and increasing efficiency. Consumer preferences are shifting towards cleaner energy sources, creating strong demand for green hydrogen. The competitive landscape is fostering innovation, with companies continuously striving to improve production methods, reduce costs, and expand applications. The market's expansion is fueled by a growing awareness of the need for decarbonization across various sectors. This trend is expected to continue, leading to substantial market growth and increased market penetration across various end-use sectors.
Dominant Markets & Segments in Green Hydrogen Market
The [mention leading region/country - e.g., European Union] currently dominates the global green hydrogen market, driven by [mention reasons - e.g., supportive government policies, extensive renewable energy infrastructure, and strong industrial base]. Within the end-user segments, the refining and chemical sectors show the highest demand, owing to their significant energy needs and growing commitment to sustainability.
- Refining: Key drivers include stringent emission regulations and the need for decarbonizing refinery operations.
- Chemicals: The chemical industry's large energy consumption and commitment to sustainable practices fuel high demand.
- Iron and Steel: The sector’s push towards carbon-neutral steel production drives adoption.
- Transportation: Growth is driven by the development of hydrogen fuel cell vehicles and the infrastructure to support them.
- Other End-user Industries: This segment demonstrates steady growth driven by diverse applications across multiple sectors.
Green Hydrogen Market Product Innovations
Significant advancements in electrolyzer technology, including advancements in membrane materials and improved designs, are reducing costs and enhancing efficiency. New applications are emerging in sectors such as ammonia production, power generation, and long-distance transportation. These innovations, coupled with the development of robust storage and distribution infrastructure, are creating a more competitive and accessible green hydrogen market.
Report Segmentation & Scope
This report segments the Green Hydrogen Market by end-user industries: Refining, Chemicals, Iron and Steel, Transportation, and Other End-user Industries. Each segment is analyzed in detail, providing insights into market size, growth projections, and competitive dynamics. The report also considers geographical segmentation, providing regional breakdowns of market trends and growth prospects. Specific growth projections for each segment are included in the detailed report.
Key Drivers of Green Hydrogen Market Growth
Several factors are driving the growth of the green hydrogen market, including supportive government policies, declining production costs, advancements in electrolyzer technology, increasing demand from various sectors seeking decarbonization, and the growing availability of renewable energy sources to power hydrogen production. The EU's Green Deal, along with national-level policies in various countries, exemplifies the significant regulatory support that is propelling the market.
Challenges in the Green Hydrogen Market Sector
Despite its promising potential, the green hydrogen market faces several challenges, including the high initial investment costs associated with production facilities and infrastructure, the intermittent nature of renewable energy sources impacting supply consistency, and the need for robust storage and transportation infrastructure. These factors, combined with competition from other energy sources, present obstacles that need addressing to ensure market maturity.
Leading Players in the Green Hydrogen Market Market
- Uniper SE
- Toshiba Energy Systems & Solutions Corporation
- Iberdrola
- Air Products Inc
- Engie
- Yara International
- Lhyfe
- Linde plc
- Cummins Inc
- Siemens Energy
- Air Liquide
- Nel ASA
- Bloom Energy
Key Developments in Green Hydrogen Market Sector
- September 2022: ENGIE initiates one of the world's first industrial-scale renewable hydrogen projects in Western Australia's Pilbara region, aiming to establish a "Pilbara Green Hydrogen Hub."
- September 2022: Siemens commissions one of Germany's largest green hydrogen generation plants, showcasing digital planning capabilities and its significance for the nation's energy transition.
- June 2022: Siemens Energy and Air Liquide form a joint venture to produce industrial-scale renewable hydrogen electrolyzers in Europe.
- January 2023: Nel and Statkraft partner to deliver 40 MW electrolyzers, strengthening Norway's green hydrogen value chain.
Strategic Green Hydrogen Market Market Outlook
The green hydrogen market presents significant long-term growth potential, driven by its crucial role in global decarbonization efforts. Strategic opportunities exist for companies focusing on innovation in electrolyzer technology, efficient storage and transport solutions, and strategic partnerships across the value chain. The market is poised for substantial expansion, offering attractive investment prospects and creating a pathway toward a sustainable energy future.
Green Hydrogen Market Segmentation
-
1. End-user Industry
- 1.1. Refining
- 1.2. Chemicals
- 1.3. Iron and Steel
- 1.4. Transportation
- 1.5. Power and Other End-user Industries
Green Hydrogen Market Segmentation By Geography
-
1. Asia Pacific
- 1.1. China
- 1.2. India
- 1.3. Japan
- 1.4. South Korea
- 1.5. Rest of Asia Pacific
-
2. North America
- 2.1. United States
- 2.2. Canada
- 2.3. Mexico
-
3. Europe
- 3.1. Germany
- 3.2. United Kingdom
- 3.3. France
- 3.4. Italy
- 3.5. Rest of Europe
-
4. Rest of the World
- 4.1. South America
- 4.2. Middle East and Africa
Green Hydrogen Market REPORT HIGHLIGHTS
| Aspects | Details |
|---|---|
| Study Period | 2019-2033 |
| Base Year | 2024 |
| Estimated Year | 2025 |
| Forecast Period | 2025-2033 |
| Historical Period | 2019-2024 |
| Growth Rate | CAGR of > 60.00% from 2019-2033 |
| Segmentation |
|
Table of Contents
- 1. Introduction
- 1.1. Research Scope
- 1.2. Market Segmentation
- 1.3. Research Methodology
- 1.4. Definitions and Assumptions
- 2. Executive Summary
- 2.1. Introduction
- 3. Market Dynamics
- 3.1. Introduction
- 3.2. Market Drivers
- 3.2.1. Surging Demand in the Chemical Industry; Growing Environmental Concerns Regarding Carbon Emissions
- 3.3. Market Restrains
- 3.3.1. High Cost of Green Hydrogen; Other Market Restraints
- 3.4. Market Trends
- 3.4.1. Surging Demand in the Chemical Industry
- 4. Market Factor Analysis
- 4.1. Porters Five Forces
- 4.2. Supply/Value Chain
- 4.3. PESTEL analysis
- 4.4. Market Entropy
- 4.5. Patent/Trademark Analysis
- 5. Global Green Hydrogen Market Analysis, Insights and Forecast, 2019-2031
- 5.1. Market Analysis, Insights and Forecast - by End-user Industry
- 5.1.1. Refining
- 5.1.2. Chemicals
- 5.1.3. Iron and Steel
- 5.1.4. Transportation
- 5.1.5. Power and Other End-user Industries
- 5.2. Market Analysis, Insights and Forecast - by Region
- 5.2.1. Asia Pacific
- 5.2.2. North America
- 5.2.3. Europe
- 5.2.4. Rest of the World
- 5.1. Market Analysis, Insights and Forecast - by End-user Industry
- 6. Asia Pacific Green Hydrogen Market Analysis, Insights and Forecast, 2019-2031
- 6.1. Market Analysis, Insights and Forecast - by End-user Industry
- 6.1.1. Refining
- 6.1.2. Chemicals
- 6.1.3. Iron and Steel
- 6.1.4. Transportation
- 6.1.5. Power and Other End-user Industries
- 6.1. Market Analysis, Insights and Forecast - by End-user Industry
- 7. North America Green Hydrogen Market Analysis, Insights and Forecast, 2019-2031
- 7.1. Market Analysis, Insights and Forecast - by End-user Industry
- 7.1.1. Refining
- 7.1.2. Chemicals
- 7.1.3. Iron and Steel
- 7.1.4. Transportation
- 7.1.5. Power and Other End-user Industries
- 7.1. Market Analysis, Insights and Forecast - by End-user Industry
- 8. Europe Green Hydrogen Market Analysis, Insights and Forecast, 2019-2031
- 8.1. Market Analysis, Insights and Forecast - by End-user Industry
- 8.1.1. Refining
- 8.1.2. Chemicals
- 8.1.3. Iron and Steel
- 8.1.4. Transportation
- 8.1.5. Power and Other End-user Industries
- 8.1. Market Analysis, Insights and Forecast - by End-user Industry
- 9. Rest of the World Green Hydrogen Market Analysis, Insights and Forecast, 2019-2031
- 9.1. Market Analysis, Insights and Forecast - by End-user Industry
- 9.1.1. Refining
- 9.1.2. Chemicals
- 9.1.3. Iron and Steel
- 9.1.4. Transportation
- 9.1.5. Power and Other End-user Industries
- 9.1. Market Analysis, Insights and Forecast - by End-user Industry
- 10. North America Green Hydrogen Market Analysis, Insights and Forecast, 2019-2031
- 10.1. Market Analysis, Insights and Forecast - By Country/Sub-region
- 10.1.1 United States
- 10.1.2 Canada
- 10.1.3 Mexico
- 11. Europe Green Hydrogen Market Analysis, Insights and Forecast, 2019-2031
- 11.1. Market Analysis, Insights and Forecast - By Country/Sub-region
- 11.1.1 Germany
- 11.1.2 United Kingdom
- 11.1.3 France
- 11.1.4 Spain
- 11.1.5 Italy
- 11.1.6 Spain
- 11.1.7 Belgium
- 11.1.8 Netherland
- 11.1.9 Nordics
- 11.1.10 Rest of Europe
- 12. Asia Pacific Green Hydrogen Market Analysis, Insights and Forecast, 2019-2031
- 12.1. Market Analysis, Insights and Forecast - By Country/Sub-region
- 12.1.1 China
- 12.1.2 Japan
- 12.1.3 India
- 12.1.4 South Korea
- 12.1.5 Southeast Asia
- 12.1.6 Australia
- 12.1.7 Indonesia
- 12.1.8 Phillipes
- 12.1.9 Singapore
- 12.1.10 Thailandc
- 12.1.11 Rest of Asia Pacific
- 13. South America Green Hydrogen Market Analysis, Insights and Forecast, 2019-2031
- 13.1. Market Analysis, Insights and Forecast - By Country/Sub-region
- 13.1.1 Brazil
- 13.1.2 Argentina
- 13.1.3 Peru
- 13.1.4 Chile
- 13.1.5 Colombia
- 13.1.6 Ecuador
- 13.1.7 Venezuela
- 13.1.8 Rest of South America
- 14. North America Green Hydrogen Market Analysis, Insights and Forecast, 2019-2031
- 14.1. Market Analysis, Insights and Forecast - By Country/Sub-region
- 14.1.1 United States
- 14.1.2 Canada
- 14.1.3 Mexico
- 15. MEA Green Hydrogen Market Analysis, Insights and Forecast, 2019-2031
- 15.1. Market Analysis, Insights and Forecast - By Country/Sub-region
- 15.1.1 United Arab Emirates
- 15.1.2 Saudi Arabia
- 15.1.3 South Africa
- 15.1.4 Rest of Middle East and Africa
- 16. Competitive Analysis
- 16.1. Global Market Share Analysis 2024
- 16.2. Company Profiles
- 16.2.1 Uniper SE
- 16.2.1.1. Overview
- 16.2.1.2. Products
- 16.2.1.3. SWOT Analysis
- 16.2.1.4. Recent Developments
- 16.2.1.5. Financials (Based on Availability)
- 16.2.2 Toshiba Energy Systems & Solutions Corporation
- 16.2.2.1. Overview
- 16.2.2.2. Products
- 16.2.2.3. SWOT Analysis
- 16.2.2.4. Recent Developments
- 16.2.2.5. Financials (Based on Availability)
- 16.2.3 Iberdrola
- 16.2.3.1. Overview
- 16.2.3.2. Products
- 16.2.3.3. SWOT Analysis
- 16.2.3.4. Recent Developments
- 16.2.3.5. Financials (Based on Availability)
- 16.2.4 Air Products Inc
- 16.2.4.1. Overview
- 16.2.4.2. Products
- 16.2.4.3. SWOT Analysis
- 16.2.4.4. Recent Developments
- 16.2.4.5. Financials (Based on Availability)
- 16.2.5 Engie
- 16.2.5.1. Overview
- 16.2.5.2. Products
- 16.2.5.3. SWOT Analysis
- 16.2.5.4. Recent Developments
- 16.2.5.5. Financials (Based on Availability)
- 16.2.6 Yara International*List Not Exhaustive
- 16.2.6.1. Overview
- 16.2.6.2. Products
- 16.2.6.3. SWOT Analysis
- 16.2.6.4. Recent Developments
- 16.2.6.5. Financials (Based on Availability)
- 16.2.7 Lhyfe
- 16.2.7.1. Overview
- 16.2.7.2. Products
- 16.2.7.3. SWOT Analysis
- 16.2.7.4. Recent Developments
- 16.2.7.5. Financials (Based on Availability)
- 16.2.8 Linde plc
- 16.2.8.1. Overview
- 16.2.8.2. Products
- 16.2.8.3. SWOT Analysis
- 16.2.8.4. Recent Developments
- 16.2.8.5. Financials (Based on Availability)
- 16.2.9 Cummins Inc
- 16.2.9.1. Overview
- 16.2.9.2. Products
- 16.2.9.3. SWOT Analysis
- 16.2.9.4. Recent Developments
- 16.2.9.5. Financials (Based on Availability)
- 16.2.10 Siemens Energy
- 16.2.10.1. Overview
- 16.2.10.2. Products
- 16.2.10.3. SWOT Analysis
- 16.2.10.4. Recent Developments
- 16.2.10.5. Financials (Based on Availability)
- 16.2.11 Air Liquide
- 16.2.11.1. Overview
- 16.2.11.2. Products
- 16.2.11.3. SWOT Analysis
- 16.2.11.4. Recent Developments
- 16.2.11.5. Financials (Based on Availability)
- 16.2.12 Nel ASA
- 16.2.12.1. Overview
- 16.2.12.2. Products
- 16.2.12.3. SWOT Analysis
- 16.2.12.4. Recent Developments
- 16.2.12.5. Financials (Based on Availability)
- 16.2.13 Bloom Energy
- 16.2.13.1. Overview
- 16.2.13.2. Products
- 16.2.13.3. SWOT Analysis
- 16.2.13.4. Recent Developments
- 16.2.13.5. Financials (Based on Availability)
- 16.2.1 Uniper SE
List of Figures
- Figure 1: Global Green Hydrogen Market Revenue Breakdown (Million, %) by Region 2024 & 2032
- Figure 2: Global Green Hydrogen Market Volume Breakdown (K Tons, %) by Region 2024 & 2032
- Figure 3: North America Green Hydrogen Market Revenue (Million), by Country 2024 & 2032
- Figure 4: North America Green Hydrogen Market Volume (K Tons), by Country 2024 & 2032
- Figure 5: North America Green Hydrogen Market Revenue Share (%), by Country 2024 & 2032
- Figure 6: North America Green Hydrogen Market Volume Share (%), by Country 2024 & 2032
- Figure 7: Europe Green Hydrogen Market Revenue (Million), by Country 2024 & 2032
- Figure 8: Europe Green Hydrogen Market Volume (K Tons), by Country 2024 & 2032
- Figure 9: Europe Green Hydrogen Market Revenue Share (%), by Country 2024 & 2032
- Figure 10: Europe Green Hydrogen Market Volume Share (%), by Country 2024 & 2032
- Figure 11: Asia Pacific Green Hydrogen Market Revenue (Million), by Country 2024 & 2032
- Figure 12: Asia Pacific Green Hydrogen Market Volume (K Tons), by Country 2024 & 2032
- Figure 13: Asia Pacific Green Hydrogen Market Revenue Share (%), by Country 2024 & 2032
- Figure 14: Asia Pacific Green Hydrogen Market Volume Share (%), by Country 2024 & 2032
- Figure 15: South America Green Hydrogen Market Revenue (Million), by Country 2024 & 2032
- Figure 16: South America Green Hydrogen Market Volume (K Tons), by Country 2024 & 2032
- Figure 17: South America Green Hydrogen Market Revenue Share (%), by Country 2024 & 2032
- Figure 18: South America Green Hydrogen Market Volume Share (%), by Country 2024 & 2032
- Figure 19: North America Green Hydrogen Market Revenue (Million), by Country 2024 & 2032
- Figure 20: North America Green Hydrogen Market Volume (K Tons), by Country 2024 & 2032
- Figure 21: North America Green Hydrogen Market Revenue Share (%), by Country 2024 & 2032
- Figure 22: North America Green Hydrogen Market Volume Share (%), by Country 2024 & 2032
- Figure 23: MEA Green Hydrogen Market Revenue (Million), by Country 2024 & 2032
- Figure 24: MEA Green Hydrogen Market Volume (K Tons), by Country 2024 & 2032
- Figure 25: MEA Green Hydrogen Market Revenue Share (%), by Country 2024 & 2032
- Figure 26: MEA Green Hydrogen Market Volume Share (%), by Country 2024 & 2032
- Figure 27: Asia Pacific Green Hydrogen Market Revenue (Million), by End-user Industry 2024 & 2032
- Figure 28: Asia Pacific Green Hydrogen Market Volume (K Tons), by End-user Industry 2024 & 2032
- Figure 29: Asia Pacific Green Hydrogen Market Revenue Share (%), by End-user Industry 2024 & 2032
- Figure 30: Asia Pacific Green Hydrogen Market Volume Share (%), by End-user Industry 2024 & 2032
- Figure 31: Asia Pacific Green Hydrogen Market Revenue (Million), by Country 2024 & 2032
- Figure 32: Asia Pacific Green Hydrogen Market Volume (K Tons), by Country 2024 & 2032
- Figure 33: Asia Pacific Green Hydrogen Market Revenue Share (%), by Country 2024 & 2032
- Figure 34: Asia Pacific Green Hydrogen Market Volume Share (%), by Country 2024 & 2032
- Figure 35: North America Green Hydrogen Market Revenue (Million), by End-user Industry 2024 & 2032
- Figure 36: North America Green Hydrogen Market Volume (K Tons), by End-user Industry 2024 & 2032
- Figure 37: North America Green Hydrogen Market Revenue Share (%), by End-user Industry 2024 & 2032
- Figure 38: North America Green Hydrogen Market Volume Share (%), by End-user Industry 2024 & 2032
- Figure 39: North America Green Hydrogen Market Revenue (Million), by Country 2024 & 2032
- Figure 40: North America Green Hydrogen Market Volume (K Tons), by Country 2024 & 2032
- Figure 41: North America Green Hydrogen Market Revenue Share (%), by Country 2024 & 2032
- Figure 42: North America Green Hydrogen Market Volume Share (%), by Country 2024 & 2032
- Figure 43: Europe Green Hydrogen Market Revenue (Million), by End-user Industry 2024 & 2032
- Figure 44: Europe Green Hydrogen Market Volume (K Tons), by End-user Industry 2024 & 2032
- Figure 45: Europe Green Hydrogen Market Revenue Share (%), by End-user Industry 2024 & 2032
- Figure 46: Europe Green Hydrogen Market Volume Share (%), by End-user Industry 2024 & 2032
- Figure 47: Europe Green Hydrogen Market Revenue (Million), by Country 2024 & 2032
- Figure 48: Europe Green Hydrogen Market Volume (K Tons), by Country 2024 & 2032
- Figure 49: Europe Green Hydrogen Market Revenue Share (%), by Country 2024 & 2032
- Figure 50: Europe Green Hydrogen Market Volume Share (%), by Country 2024 & 2032
- Figure 51: Rest of the World Green Hydrogen Market Revenue (Million), by End-user Industry 2024 & 2032
- Figure 52: Rest of the World Green Hydrogen Market Volume (K Tons), by End-user Industry 2024 & 2032
- Figure 53: Rest of the World Green Hydrogen Market Revenue Share (%), by End-user Industry 2024 & 2032
- Figure 54: Rest of the World Green Hydrogen Market Volume Share (%), by End-user Industry 2024 & 2032
- Figure 55: Rest of the World Green Hydrogen Market Revenue (Million), by Country 2024 & 2032
- Figure 56: Rest of the World Green Hydrogen Market Volume (K Tons), by Country 2024 & 2032
- Figure 57: Rest of the World Green Hydrogen Market Revenue Share (%), by Country 2024 & 2032
- Figure 58: Rest of the World Green Hydrogen Market Volume Share (%), by Country 2024 & 2032
List of Tables
- Table 1: Global Green Hydrogen Market Revenue Million Forecast, by Region 2019 & 2032
- Table 2: Global Green Hydrogen Market Volume K Tons Forecast, by Region 2019 & 2032
- Table 3: Global Green Hydrogen Market Revenue Million Forecast, by End-user Industry 2019 & 2032
- Table 4: Global Green Hydrogen Market Volume K Tons Forecast, by End-user Industry 2019 & 2032
- Table 5: Global Green Hydrogen Market Revenue Million Forecast, by Region 2019 & 2032
- Table 6: Global Green Hydrogen Market Volume K Tons Forecast, by Region 2019 & 2032
- Table 7: Global Green Hydrogen Market Revenue Million Forecast, by Country 2019 & 2032
- Table 8: Global Green Hydrogen Market Volume K Tons Forecast, by Country 2019 & 2032
- Table 9: United States Green Hydrogen Market Revenue (Million) Forecast, by Application 2019 & 2032
- Table 10: United States Green Hydrogen Market Volume (K Tons) Forecast, by Application 2019 & 2032
- Table 11: Canada Green Hydrogen Market Revenue (Million) Forecast, by Application 2019 & 2032
- Table 12: Canada Green Hydrogen Market Volume (K Tons) Forecast, by Application 2019 & 2032
- Table 13: Mexico Green Hydrogen Market Revenue (Million) Forecast, by Application 2019 & 2032
- Table 14: Mexico Green Hydrogen Market Volume (K Tons) Forecast, by Application 2019 & 2032
- Table 15: Global Green Hydrogen Market Revenue Million Forecast, by Country 2019 & 2032
- Table 16: Global Green Hydrogen Market Volume K Tons Forecast, by Country 2019 & 2032
- Table 17: Germany Green Hydrogen Market Revenue (Million) Forecast, by Application 2019 & 2032
- Table 18: Germany Green Hydrogen Market Volume (K Tons) Forecast, by Application 2019 & 2032
- Table 19: United Kingdom Green Hydrogen Market Revenue (Million) Forecast, by Application 2019 & 2032
- Table 20: United Kingdom Green Hydrogen Market Volume (K Tons) Forecast, by Application 2019 & 2032
- Table 21: France Green Hydrogen Market Revenue (Million) Forecast, by Application 2019 & 2032
- Table 22: France Green Hydrogen Market Volume (K Tons) Forecast, by Application 2019 & 2032
- Table 23: Spain Green Hydrogen Market Revenue (Million) Forecast, by Application 2019 & 2032
- Table 24: Spain Green Hydrogen Market Volume (K Tons) Forecast, by Application 2019 & 2032
- Table 25: Italy Green Hydrogen Market Revenue (Million) Forecast, by Application 2019 & 2032
- Table 26: Italy Green Hydrogen Market Volume (K Tons) Forecast, by Application 2019 & 2032
- Table 27: Spain Green Hydrogen Market Revenue (Million) Forecast, by Application 2019 & 2032
- Table 28: Spain Green Hydrogen Market Volume (K Tons) Forecast, by Application 2019 & 2032
- Table 29: Belgium Green Hydrogen Market Revenue (Million) Forecast, by Application 2019 & 2032
- Table 30: Belgium Green Hydrogen Market Volume (K Tons) Forecast, by Application 2019 & 2032
- Table 31: Netherland Green Hydrogen Market Revenue (Million) Forecast, by Application 2019 & 2032
- Table 32: Netherland Green Hydrogen Market Volume (K Tons) Forecast, by Application 2019 & 2032
- Table 33: Nordics Green Hydrogen Market Revenue (Million) Forecast, by Application 2019 & 2032
- Table 34: Nordics Green Hydrogen Market Volume (K Tons) Forecast, by Application 2019 & 2032
- Table 35: Rest of Europe Green Hydrogen Market Revenue (Million) Forecast, by Application 2019 & 2032
- Table 36: Rest of Europe Green Hydrogen Market Volume (K Tons) Forecast, by Application 2019 & 2032
- Table 37: Global Green Hydrogen Market Revenue Million Forecast, by Country 2019 & 2032
- Table 38: Global Green Hydrogen Market Volume K Tons Forecast, by Country 2019 & 2032
- Table 39: China Green Hydrogen Market Revenue (Million) Forecast, by Application 2019 & 2032
- Table 40: China Green Hydrogen Market Volume (K Tons) Forecast, by Application 2019 & 2032
- Table 41: Japan Green Hydrogen Market Revenue (Million) Forecast, by Application 2019 & 2032
- Table 42: Japan Green Hydrogen Market Volume (K Tons) Forecast, by Application 2019 & 2032
- Table 43: India Green Hydrogen Market Revenue (Million) Forecast, by Application 2019 & 2032
- Table 44: India Green Hydrogen Market Volume (K Tons) Forecast, by Application 2019 & 2032
- Table 45: South Korea Green Hydrogen Market Revenue (Million) Forecast, by Application 2019 & 2032
- Table 46: South Korea Green Hydrogen Market Volume (K Tons) Forecast, by Application 2019 & 2032
- Table 47: Southeast Asia Green Hydrogen Market Revenue (Million) Forecast, by Application 2019 & 2032
- Table 48: Southeast Asia Green Hydrogen Market Volume (K Tons) Forecast, by Application 2019 & 2032
- Table 49: Australia Green Hydrogen Market Revenue (Million) Forecast, by Application 2019 & 2032
- Table 50: Australia Green Hydrogen Market Volume (K Tons) Forecast, by Application 2019 & 2032
- Table 51: Indonesia Green Hydrogen Market Revenue (Million) Forecast, by Application 2019 & 2032
- Table 52: Indonesia Green Hydrogen Market Volume (K Tons) Forecast, by Application 2019 & 2032
- Table 53: Phillipes Green Hydrogen Market Revenue (Million) Forecast, by Application 2019 & 2032
- Table 54: Phillipes Green Hydrogen Market Volume (K Tons) Forecast, by Application 2019 & 2032
- Table 55: Singapore Green Hydrogen Market Revenue (Million) Forecast, by Application 2019 & 2032
- Table 56: Singapore Green Hydrogen Market Volume (K Tons) Forecast, by Application 2019 & 2032
- Table 57: Thailandc Green Hydrogen Market Revenue (Million) Forecast, by Application 2019 & 2032
- Table 58: Thailandc Green Hydrogen Market Volume (K Tons) Forecast, by Application 2019 & 2032
- Table 59: Rest of Asia Pacific Green Hydrogen Market Revenue (Million) Forecast, by Application 2019 & 2032
- Table 60: Rest of Asia Pacific Green Hydrogen Market Volume (K Tons) Forecast, by Application 2019 & 2032
- Table 61: Global Green Hydrogen Market Revenue Million Forecast, by Country 2019 & 2032
- Table 62: Global Green Hydrogen Market Volume K Tons Forecast, by Country 2019 & 2032
- Table 63: Brazil Green Hydrogen Market Revenue (Million) Forecast, by Application 2019 & 2032
- Table 64: Brazil Green Hydrogen Market Volume (K Tons) Forecast, by Application 2019 & 2032
- Table 65: Argentina Green Hydrogen Market Revenue (Million) Forecast, by Application 2019 & 2032
- Table 66: Argentina Green Hydrogen Market Volume (K Tons) Forecast, by Application 2019 & 2032
- Table 67: Peru Green Hydrogen Market Revenue (Million) Forecast, by Application 2019 & 2032
- Table 68: Peru Green Hydrogen Market Volume (K Tons) Forecast, by Application 2019 & 2032
- Table 69: Chile Green Hydrogen Market Revenue (Million) Forecast, by Application 2019 & 2032
- Table 70: Chile Green Hydrogen Market Volume (K Tons) Forecast, by Application 2019 & 2032
- Table 71: Colombia Green Hydrogen Market Revenue (Million) Forecast, by Application 2019 & 2032
- Table 72: Colombia Green Hydrogen Market Volume (K Tons) Forecast, by Application 2019 & 2032
- Table 73: Ecuador Green Hydrogen Market Revenue (Million) Forecast, by Application 2019 & 2032
- Table 74: Ecuador Green Hydrogen Market Volume (K Tons) Forecast, by Application 2019 & 2032
- Table 75: Venezuela Green Hydrogen Market Revenue (Million) Forecast, by Application 2019 & 2032
- Table 76: Venezuela Green Hydrogen Market Volume (K Tons) Forecast, by Application 2019 & 2032
- Table 77: Rest of South America Green Hydrogen Market Revenue (Million) Forecast, by Application 2019 & 2032
- Table 78: Rest of South America Green Hydrogen Market Volume (K Tons) Forecast, by Application 2019 & 2032
- Table 79: Global Green Hydrogen Market Revenue Million Forecast, by Country 2019 & 2032
- Table 80: Global Green Hydrogen Market Volume K Tons Forecast, by Country 2019 & 2032
- Table 81: United States Green Hydrogen Market Revenue (Million) Forecast, by Application 2019 & 2032
- Table 82: United States Green Hydrogen Market Volume (K Tons) Forecast, by Application 2019 & 2032
- Table 83: Canada Green Hydrogen Market Revenue (Million) Forecast, by Application 2019 & 2032
- Table 84: Canada Green Hydrogen Market Volume (K Tons) Forecast, by Application 2019 & 2032
- Table 85: Mexico Green Hydrogen Market Revenue (Million) Forecast, by Application 2019 & 2032
- Table 86: Mexico Green Hydrogen Market Volume (K Tons) Forecast, by Application 2019 & 2032
- Table 87: Global Green Hydrogen Market Revenue Million Forecast, by Country 2019 & 2032
- Table 88: Global Green Hydrogen Market Volume K Tons Forecast, by Country 2019 & 2032
- Table 89: United Arab Emirates Green Hydrogen Market Revenue (Million) Forecast, by Application 2019 & 2032
- Table 90: United Arab Emirates Green Hydrogen Market Volume (K Tons) Forecast, by Application 2019 & 2032
- Table 91: Saudi Arabia Green Hydrogen Market Revenue (Million) Forecast, by Application 2019 & 2032
- Table 92: Saudi Arabia Green Hydrogen Market Volume (K Tons) Forecast, by Application 2019 & 2032
- Table 93: South Africa Green Hydrogen Market Revenue (Million) Forecast, by Application 2019 & 2032
- Table 94: South Africa Green Hydrogen Market Volume (K Tons) Forecast, by Application 2019 & 2032
- Table 95: Rest of Middle East and Africa Green Hydrogen Market Revenue (Million) Forecast, by Application 2019 & 2032
- Table 96: Rest of Middle East and Africa Green Hydrogen Market Volume (K Tons) Forecast, by Application 2019 & 2032
- Table 97: Global Green Hydrogen Market Revenue Million Forecast, by End-user Industry 2019 & 2032
- Table 98: Global Green Hydrogen Market Volume K Tons Forecast, by End-user Industry 2019 & 2032
- Table 99: Global Green Hydrogen Market Revenue Million Forecast, by Country 2019 & 2032
- Table 100: Global Green Hydrogen Market Volume K Tons Forecast, by Country 2019 & 2032
- Table 101: China Green Hydrogen Market Revenue (Million) Forecast, by Application 2019 & 2032
- Table 102: China Green Hydrogen Market Volume (K Tons) Forecast, by Application 2019 & 2032
- Table 103: India Green Hydrogen Market Revenue (Million) Forecast, by Application 2019 & 2032
- Table 104: India Green Hydrogen Market Volume (K Tons) Forecast, by Application 2019 & 2032
- Table 105: Japan Green Hydrogen Market Revenue (Million) Forecast, by Application 2019 & 2032
- Table 106: Japan Green Hydrogen Market Volume (K Tons) Forecast, by Application 2019 & 2032
- Table 107: South Korea Green Hydrogen Market Revenue (Million) Forecast, by Application 2019 & 2032
- Table 108: South Korea Green Hydrogen Market Volume (K Tons) Forecast, by Application 2019 & 2032
- Table 109: Rest of Asia Pacific Green Hydrogen Market Revenue (Million) Forecast, by Application 2019 & 2032
- Table 110: Rest of Asia Pacific Green Hydrogen Market Volume (K Tons) Forecast, by Application 2019 & 2032
- Table 111: Global Green Hydrogen Market Revenue Million Forecast, by End-user Industry 2019 & 2032
- Table 112: Global Green Hydrogen Market Volume K Tons Forecast, by End-user Industry 2019 & 2032
- Table 113: Global Green Hydrogen Market Revenue Million Forecast, by Country 2019 & 2032
- Table 114: Global Green Hydrogen Market Volume K Tons Forecast, by Country 2019 & 2032
- Table 115: United States Green Hydrogen Market Revenue (Million) Forecast, by Application 2019 & 2032
- Table 116: United States Green Hydrogen Market Volume (K Tons) Forecast, by Application 2019 & 2032
- Table 117: Canada Green Hydrogen Market Revenue (Million) Forecast, by Application 2019 & 2032
- Table 118: Canada Green Hydrogen Market Volume (K Tons) Forecast, by Application 2019 & 2032
- Table 119: Mexico Green Hydrogen Market Revenue (Million) Forecast, by Application 2019 & 2032
- Table 120: Mexico Green Hydrogen Market Volume (K Tons) Forecast, by Application 2019 & 2032
- Table 121: Global Green Hydrogen Market Revenue Million Forecast, by End-user Industry 2019 & 2032
- Table 122: Global Green Hydrogen Market Volume K Tons Forecast, by End-user Industry 2019 & 2032
- Table 123: Global Green Hydrogen Market Revenue Million Forecast, by Country 2019 & 2032
- Table 124: Global Green Hydrogen Market Volume K Tons Forecast, by Country 2019 & 2032
- Table 125: Germany Green Hydrogen Market Revenue (Million) Forecast, by Application 2019 & 2032
- Table 126: Germany Green Hydrogen Market Volume (K Tons) Forecast, by Application 2019 & 2032
- Table 127: United Kingdom Green Hydrogen Market Revenue (Million) Forecast, by Application 2019 & 2032
- Table 128: United Kingdom Green Hydrogen Market Volume (K Tons) Forecast, by Application 2019 & 2032
- Table 129: France Green Hydrogen Market Revenue (Million) Forecast, by Application 2019 & 2032
- Table 130: France Green Hydrogen Market Volume (K Tons) Forecast, by Application 2019 & 2032
- Table 131: Italy Green Hydrogen Market Revenue (Million) Forecast, by Application 2019 & 2032
- Table 132: Italy Green Hydrogen Market Volume (K Tons) Forecast, by Application 2019 & 2032
- Table 133: Rest of Europe Green Hydrogen Market Revenue (Million) Forecast, by Application 2019 & 2032
- Table 134: Rest of Europe Green Hydrogen Market Volume (K Tons) Forecast, by Application 2019 & 2032
- Table 135: Global Green Hydrogen Market Revenue Million Forecast, by End-user Industry 2019 & 2032
- Table 136: Global Green Hydrogen Market Volume K Tons Forecast, by End-user Industry 2019 & 2032
- Table 137: Global Green Hydrogen Market Revenue Million Forecast, by Country 2019 & 2032
- Table 138: Global Green Hydrogen Market Volume K Tons Forecast, by Country 2019 & 2032
- Table 139: South America Green Hydrogen Market Revenue (Million) Forecast, by Application 2019 & 2032
- Table 140: South America Green Hydrogen Market Volume (K Tons) Forecast, by Application 2019 & 2032
- Table 141: Middle East and Africa Green Hydrogen Market Revenue (Million) Forecast, by Application 2019 & 2032
- Table 142: Middle East and Africa Green Hydrogen Market Volume (K Tons) Forecast, by Application 2019 & 2032
Frequently Asked Questions
1. What is the projected Compound Annual Growth Rate (CAGR) of the Green Hydrogen Market?
The projected CAGR is approximately > 60.00%.
2. Which companies are prominent players in the Green Hydrogen Market?
Key companies in the market include Uniper SE, Toshiba Energy Systems & Solutions Corporation, Iberdrola, Air Products Inc, Engie, Yara International*List Not Exhaustive, Lhyfe, Linde plc, Cummins Inc, Siemens Energy, Air Liquide, Nel ASA, Bloom Energy.
3. What are the main segments of the Green Hydrogen Market?
The market segments include End-user Industry.
4. Can you provide details about the market size?
The market size is estimated to be USD 3.28 Million as of 2022.
5. What are some drivers contributing to market growth?
Surging Demand in the Chemical Industry; Growing Environmental Concerns Regarding Carbon Emissions.
6. What are the notable trends driving market growth?
Surging Demand in the Chemical Industry.
7. Are there any restraints impacting market growth?
High Cost of Green Hydrogen; Other Market Restraints.
8. Can you provide examples of recent developments in the market?
January 2023: Nel and Statkraft, Europe's largest supplier of renewable energy, signed a contract for delivery of 40 MW electrolyzers and will thus collaborate to create a strong value chain for the production of green hydrogen in Norway.
9. What pricing options are available for accessing the report?
Pricing options include single-user, multi-user, and enterprise licenses priced at USD 4750, USD 5250, and USD 8750 respectively.
10. Is the market size provided in terms of value or volume?
The market size is provided in terms of value, measured in Million and volume, measured in K Tons.
11. Are there any specific market keywords associated with the report?
Yes, the market keyword associated with the report is "Green Hydrogen Market," which aids in identifying and referencing the specific market segment covered.
12. How do I determine which pricing option suits my needs best?
The pricing options vary based on user requirements and access needs. Individual users may opt for single-user licenses, while businesses requiring broader access may choose multi-user or enterprise licenses for cost-effective access to the report.
13. Are there any additional resources or data provided in the Green Hydrogen Market report?
While the report offers comprehensive insights, it's advisable to review the specific contents or supplementary materials provided to ascertain if additional resources or data are available.
14. How can I stay updated on further developments or reports in the Green Hydrogen Market?
To stay informed about further developments, trends, and reports in the Green Hydrogen Market, consider subscribing to industry newsletters, following relevant companies and organizations, or regularly checking reputable industry news sources and publications.
Methodology
Step 1 - Identification of Relevant Samples Size from Population Database


Step 2 - Approaches for Defining Global Market Size (Value, Volume* & Price*)

Note*: In applicable scenarios
Step 3 - Data Sources
Primary Research
- Web Analytics
- Survey Reports
- Research Institute
- Latest Research Reports
- Opinion Leaders
Secondary Research
- Annual Reports
- White Paper
- Latest Press Release
- Industry Association
- Paid Database
- Investor Presentations

Step 4 - Data Triangulation
Involves using different sources of information in order to increase the validity of a study
These sources are likely to be stakeholders in a program - participants, other researchers, program staff, other community members, and so on.
Then we put all data in single framework & apply various statistical tools to find out the dynamic on the market.
During the analysis stage, feedback from the stakeholder groups would be compared to determine areas of agreement as well as areas of divergence


