
Key Insights
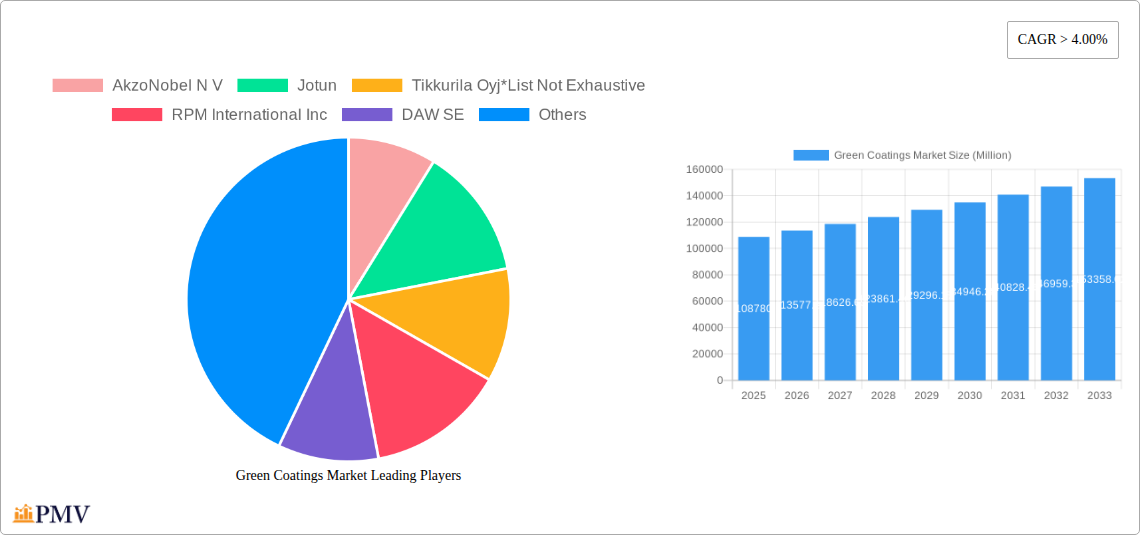
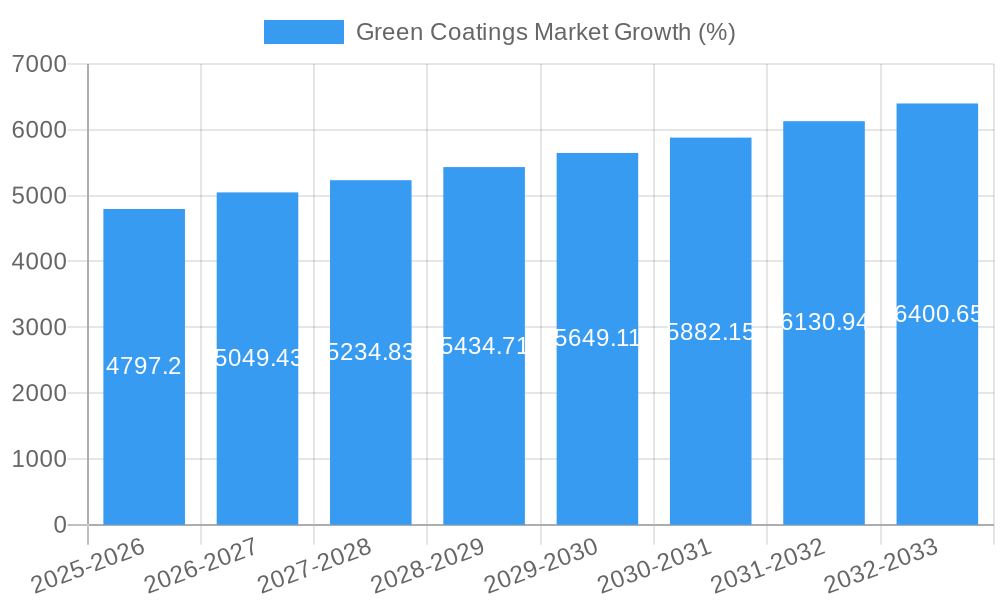
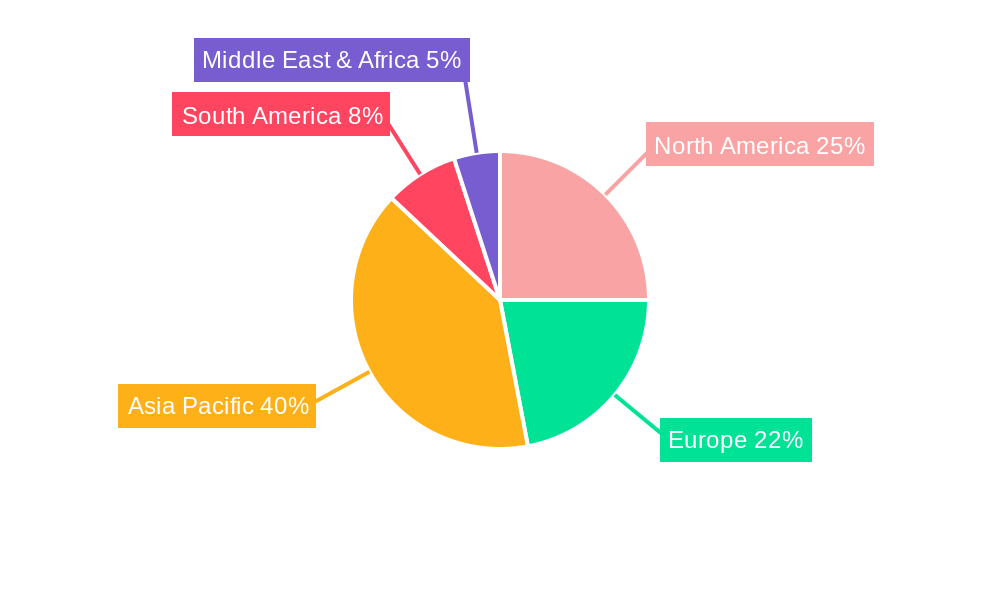
The global green coatings market, valued at $108.78 billion in 2025, is experiencing robust growth, projected to expand at a CAGR exceeding 4% from 2025 to 2033. This surge is driven by increasing environmental concerns, stringent government regulations aimed at reducing VOC emissions, and rising consumer demand for eco-friendly products across diverse sectors. Key application areas like architectural, industrial, and automotive coatings are witnessing significant adoption of green coatings due to their lower environmental impact and improved performance characteristics. The water-borne segment dominates the market due to its low toxicity and ease of application, while advancements in UV-cured and high-solids coatings are further fueling market expansion. Growth is particularly pronounced in the Asia-Pacific region, driven by rapid industrialization and urbanization in countries like China and India. However, the higher initial cost of green coatings compared to conventional options and the limited availability of certain raw materials present challenges to widespread adoption. Nevertheless, ongoing technological advancements, coupled with favorable government policies promoting sustainable practices, are expected to overcome these restraints and propel market growth in the coming years. Competitive landscape analysis reveals key players such as AkzoNobel, Jotun, PPG Industries, and BASF actively investing in research and development to improve the performance and affordability of green coatings, further solidifying the market's growth trajectory.
The market segmentation highlights diverse application areas, each with its own growth drivers. Architectural coatings benefit from growing awareness of indoor air quality, pushing adoption of low-VOC options. Industrial coatings see increased demand for corrosion resistance and durability in sustainable manufacturing. The automotive sector’s focus on lightweighting and reduced emissions fuels the need for high-performance, environmentally-friendly coatings. Wood coatings leverage the natural aesthetic of wood while enhancing its durability, while packaging coatings prioritize food safety and recyclability. Ongoing innovations in formulation, focusing on bio-based materials and improved performance characteristics, are expected to further penetrate these sectors and bolster overall market growth. Regional variations in regulations and consumer preferences will continue to influence growth patterns, with North America and Europe maintaining strong positions alongside the rapidly expanding Asian markets.
Green Coatings Market: A Comprehensive Analysis (2019-2033)
This meticulously researched report provides a detailed analysis of the global Green Coatings Market, offering invaluable insights for stakeholders across the value chain. Covering the period from 2019 to 2033, with a focus on 2025, this report dissects market dynamics, competitive landscapes, and future growth trajectories. The study includes forecasts, market sizing, and segmentation, empowering businesses to make informed strategic decisions.
Green Coatings Market Structure & Competitive Dynamics
The Green Coatings market exhibits a moderately consolidated structure, with several key players dominating significant market shares. AkzoNobel N.V., Jotun, Tikkurila Oyj, RPM International Inc., DAW SE, PPG Industries Inc., BASF SE, Arkema Group, Hempel A/S, The Sherwin-Williams Company, Eastman Chemical Company, Kansai Paint Company Limited, Asian Paints Limited, Berger Paints, Axalta Coating Systems LLC, and Evonik Industries are among the prominent players. However, the market also accommodates a number of smaller, specialized companies focused on niche applications.
Market concentration is influenced by factors such as economies of scale, R&D capabilities, and global distribution networks. The competitive landscape is characterized by intense rivalry, driving innovation and the development of sustainable and high-performance green coatings. The regulatory framework, particularly concerning environmental compliance and VOC emissions, significantly impacts market dynamics. Furthermore, ongoing M&A activities consolidate market share and drive innovation. While precise M&A deal values are proprietary, a notable increase in transactions in the past five years suggests a concerted effort to expand market reach and portfolio diversification.
- Market Share: The top 5 players hold approximately xx% of the global market share in 2025.
- M&A Activity: An estimated xx Million USD was invested in M&A activities within the Green Coatings market from 2020-2024.
- Innovation Ecosystems: Collaborative ventures between chemical manufacturers, coating formulators, and end-users are increasingly common, fostering rapid innovation in green coating technology.
- Product Substitutes: The market faces pressure from substitute materials, including traditional coatings and alternative surface treatments. However, growing environmental awareness and stringent regulations favor the adoption of green coatings.
- End-User Trends: A rising demand for sustainable and eco-friendly solutions across various applications, including automotive, architectural, and industrial coatings, fuels market growth.
Green Coatings Market Industry Trends & Insights
The Green Coatings market is experiencing robust growth, driven by stringent environmental regulations, heightened consumer awareness of sustainability, and technological advancements in green coating formulations. The market's Compound Annual Growth Rate (CAGR) is estimated at xx% during the forecast period (2025-2033). This growth is fueled by several factors, including:
- Increasing Demand for Sustainable Products: Consumers and businesses are increasingly adopting environmentally conscious practices, leading to higher demand for eco-friendly coatings.
- Stringent Environmental Regulations: Governments worldwide are implementing stricter regulations on VOC emissions and hazardous substances, pushing the market towards the adoption of greener alternatives.
- Technological Advancements: Ongoing innovations in water-borne, powder, UV-cured, and high-solids coatings are enhancing the performance and cost-effectiveness of green coating solutions.
- Market Penetration: The penetration rate of green coatings in various end-use segments is gradually increasing, particularly in the architectural and automotive sectors. However, penetration in niche applications remains limited, offering growth opportunities.
- Competitive Dynamics: The competitive landscape is evolving rapidly, with established players and new entrants innovating and expanding their product portfolios.
These factors combine to project a significant expansion of the Green Coatings market in the coming years.
Dominant Markets & Segments in Green Coatings Market
The architectural coatings segment is currently the largest application segment globally, driven by the increasing construction activity and the demand for aesthetically pleasing and sustainable buildings. Asia-Pacific is currently the largest regional market, boosted by rapid urbanization and economic growth. Europe and North America also contribute significantly due to the stringent environmental regulations and high consumer awareness.
Key Drivers:
- Architectural Coatings: Growing construction industry, stringent building codes related to emissions and sustainability, rising awareness among consumers about the benefits of eco-friendly coatings.
- Industrial Coatings: Strict environmental regulations in various industries, the need for corrosion resistance and durability in industrial applications, rising demand for sustainable manufacturing practices.
- Water-borne Coatings: Increased consumer preference for environmentally friendly solutions, the use of water as a solvent, the relatively low toxicity of the product.
- Powder Coatings: High durability and excellent aesthetic qualities, low VOC emissions, and the ease of application, providing cost-effectiveness, leading to higher adoption across multiple sectors.
Dominance Analysis:
The Asia-Pacific region's dominance stems from its rapid economic growth and construction boom. However, Europe and North America are catching up due to their focus on environmental sustainability and the implementation of strict emission standards. The water-borne coatings segment shows the fastest growth rate compared to other types owing to its environmental benefits and high demand.
Green Coatings Market Product Innovations
Recent innovations focus on enhancing the performance characteristics of green coatings while minimizing their environmental impact. This includes developing high-performance water-borne and UV-cured coatings with improved durability, adhesion, and corrosion resistance. Furthermore, there is a growing trend toward bio-based coatings derived from renewable resources, minimizing reliance on petrochemicals. These innovations are well-aligned with growing market demand for eco-friendly and high-performing solutions.
Report Segmentation & Scope
This report provides a comprehensive segmentation of the Green Coatings market across multiple dimensions:
By Type: Water-borne, Powder, High-solids, UV-cured coatings. Each segment showcases individual market sizes, growth projections, and competitive dynamics. The growth of water-borne and powder coatings is particularly strong due to their environmental benefits.
By Application: Architectural Coatings, Industrial Coatings, Automotive Coatings, Wood Coatings, Packaging Coatings, and Others. Each segment's growth is linked to the specific needs and trends of its end-use industry. Architectural coatings hold the largest market share in 2025, followed by industrial coatings.
Each segment has its own specific growth trajectory and market size projections for the forecast period. Competitive dynamics vary across segments, reflecting the specific technologies and applications involved.
Key Drivers of Green Coatings Market Growth
The Green Coatings market is driven by a confluence of factors:
- Stringent environmental regulations: Legislation aimed at reducing VOC emissions and hazardous waste is a significant driver.
- Growing consumer awareness: Increased awareness of the environmental impact of conventional coatings is leading to higher demand for eco-friendly alternatives.
- Technological advancements: Innovations in water-borne, powder, and UV-cured coating technologies are improving performance and reducing environmental impact.
- Economic incentives: Government subsidies and tax breaks for sustainable building materials and manufacturing processes incentivize the adoption of green coatings.
These factors collectively stimulate market growth.
Challenges in the Green Coatings Market Sector
Despite promising growth, the Green Coatings market faces challenges:
- Higher initial costs: Green coatings often have a higher initial cost compared to conventional coatings, potentially hindering adoption in price-sensitive markets.
- Performance limitations: In certain applications, green coatings may not yet match the performance characteristics of conventional coatings.
- Supply chain complexities: Sourcing sustainable raw materials and managing the supply chain sustainably can pose significant challenges.
- Regulatory uncertainties: Evolving regulations and compliance requirements create uncertainty for market participants.
Leading Players in the Green Coatings Market Market
- AkzoNobel N.V.
- Jotun
- Tikkurila Oyj
- RPM International Inc.
- DAW SE
- PPG Industries Inc.
- BASF SE
- Arkema Group
- Hempel A/S
- The Sherwin-Williams Company
- Eastman Chemical Company
- Kansai Paint Company Limited
- Asian Paints Limited
- Berger Paints
- Axalta Coating Systems LLC
- Evonik Industries
Key Developments in Green Coatings Market Sector
- January 2023: AkzoNobel launches a new range of sustainable water-based wood coatings.
- April 2022: BASF invests xx Million USD in expanding its production capacity for bio-based coatings.
- October 2021: Jotun acquires a smaller company specializing in powder coatings, expanding its product portfolio.
- Further developments: (Add further relevant developments with dates and brief descriptions of impact).
Strategic Green Coatings Market Market Outlook
The Green Coatings market presents substantial growth opportunities. Continued innovation in sustainable coating technologies, coupled with stricter environmental regulations and rising consumer demand for eco-friendly products, will drive market expansion. Strategic partnerships, investments in R&D, and expansion into emerging markets are key to success. The focus on sustainable raw materials and circular economy practices will shape future market trends. Companies can gain a competitive advantage by developing high-performance, cost-effective, and environmentally benign coatings tailored to the specific needs of various end-use sectors.
Green Coatings Market Segmentation
-
1. Type
- 1.1. Water-Borne
- 1.2. Powder
- 1.3. High-solids
- 1.4. UV-cured coatings
-
2. Application
- 2.1. Architectural Coatings
- 2.2. Industrial Coatings
- 2.3. Automotive Coatings
- 2.4. Wood Coatings
- 2.5. Packaging Coatings
- 2.6. Others
Green Coatings Market Segmentation By Geography
-
1. Asia Pacific
- 1.1. China
- 1.2. India
- 1.3. Japan
- 1.4. South Korea
- 1.5. Rest of Asia Pacific
-
2. North America
- 2.1. United States
- 2.2. Canada
- 2.3. Mexico
-
3. Europe
- 3.1. Germany
- 3.2. United Kingdom
- 3.3. Italy
- 3.4. France
- 3.5. Rest of Europe
-
4. South America
- 4.1. Brazil
- 4.2. Argentina
- 4.3. Rest of South America
- 5. Middle East
-
6. Saudi Arabia
- 6.1. South Africa
- 6.2. Rest of Middle East
Green Coatings Market REPORT HIGHLIGHTS
| Aspects | Details |
|---|---|
| Study Period | 2019-2033 |
| Base Year | 2024 |
| Estimated Year | 2025 |
| Forecast Period | 2025-2033 |
| Historical Period | 2019-2024 |
| Growth Rate | CAGR of > 4.00% from 2019-2033 |
| Segmentation |
|
Table of Contents
- 1. Introduction
- 1.1. Research Scope
- 1.2. Market Segmentation
- 1.3. Research Methodology
- 1.4. Definitions and Assumptions
- 2. Executive Summary
- 2.1. Introduction
- 3. Market Dynamics
- 3.1. Introduction
- 3.2. Market Drivers
- 3.2.1. ; Stringent Environmental Regulations to Control VOC Emissions; Others
- 3.3. Market Restrains
- 3.3.1. Price Hikes of Raw Materials; Other Restraints
- 3.4. Market Trends
- 3.4.1. Water-borne Segment to Dominate the Market
- 4. Market Factor Analysis
- 4.1. Porters Five Forces
- 4.2. Supply/Value Chain
- 4.3. PESTEL analysis
- 4.4. Market Entropy
- 4.5. Patent/Trademark Analysis
- 5. Global Green Coatings Market Analysis, Insights and Forecast, 2019-2031
- 5.1. Market Analysis, Insights and Forecast - by Type
- 5.1.1. Water-Borne
- 5.1.2. Powder
- 5.1.3. High-solids
- 5.1.4. UV-cured coatings
- 5.2. Market Analysis, Insights and Forecast - by Application
- 5.2.1. Architectural Coatings
- 5.2.2. Industrial Coatings
- 5.2.3. Automotive Coatings
- 5.2.4. Wood Coatings
- 5.2.5. Packaging Coatings
- 5.2.6. Others
- 5.3. Market Analysis, Insights and Forecast - by Region
- 5.3.1. Asia Pacific
- 5.3.2. North America
- 5.3.3. Europe
- 5.3.4. South America
- 5.3.5. Middle East
- 5.3.6. Saudi Arabia
- 5.1. Market Analysis, Insights and Forecast - by Type
- 6. Asia Pacific Green Coatings Market Analysis, Insights and Forecast, 2019-2031
- 6.1. Market Analysis, Insights and Forecast - by Type
- 6.1.1. Water-Borne
- 6.1.2. Powder
- 6.1.3. High-solids
- 6.1.4. UV-cured coatings
- 6.2. Market Analysis, Insights and Forecast - by Application
- 6.2.1. Architectural Coatings
- 6.2.2. Industrial Coatings
- 6.2.3. Automotive Coatings
- 6.2.4. Wood Coatings
- 6.2.5. Packaging Coatings
- 6.2.6. Others
- 6.1. Market Analysis, Insights and Forecast - by Type
- 7. North America Green Coatings Market Analysis, Insights and Forecast, 2019-2031
- 7.1. Market Analysis, Insights and Forecast - by Type
- 7.1.1. Water-Borne
- 7.1.2. Powder
- 7.1.3. High-solids
- 7.1.4. UV-cured coatings
- 7.2. Market Analysis, Insights and Forecast - by Application
- 7.2.1. Architectural Coatings
- 7.2.2. Industrial Coatings
- 7.2.3. Automotive Coatings
- 7.2.4. Wood Coatings
- 7.2.5. Packaging Coatings
- 7.2.6. Others
- 7.1. Market Analysis, Insights and Forecast - by Type
- 8. Europe Green Coatings Market Analysis, Insights and Forecast, 2019-2031
- 8.1. Market Analysis, Insights and Forecast - by Type
- 8.1.1. Water-Borne
- 8.1.2. Powder
- 8.1.3. High-solids
- 8.1.4. UV-cured coatings
- 8.2. Market Analysis, Insights and Forecast - by Application
- 8.2.1. Architectural Coatings
- 8.2.2. Industrial Coatings
- 8.2.3. Automotive Coatings
- 8.2.4. Wood Coatings
- 8.2.5. Packaging Coatings
- 8.2.6. Others
- 8.1. Market Analysis, Insights and Forecast - by Type
- 9. South America Green Coatings Market Analysis, Insights and Forecast, 2019-2031
- 9.1. Market Analysis, Insights and Forecast - by Type
- 9.1.1. Water-Borne
- 9.1.2. Powder
- 9.1.3. High-solids
- 9.1.4. UV-cured coatings
- 9.2. Market Analysis, Insights and Forecast - by Application
- 9.2.1. Architectural Coatings
- 9.2.2. Industrial Coatings
- 9.2.3. Automotive Coatings
- 9.2.4. Wood Coatings
- 9.2.5. Packaging Coatings
- 9.2.6. Others
- 9.1. Market Analysis, Insights and Forecast - by Type
- 10. Middle East Green Coatings Market Analysis, Insights and Forecast, 2019-2031
- 10.1. Market Analysis, Insights and Forecast - by Type
- 10.1.1. Water-Borne
- 10.1.2. Powder
- 10.1.3. High-solids
- 10.1.4. UV-cured coatings
- 10.2. Market Analysis, Insights and Forecast - by Application
- 10.2.1. Architectural Coatings
- 10.2.2. Industrial Coatings
- 10.2.3. Automotive Coatings
- 10.2.4. Wood Coatings
- 10.2.5. Packaging Coatings
- 10.2.6. Others
- 10.1. Market Analysis, Insights and Forecast - by Type
- 11. Saudi Arabia Green Coatings Market Analysis, Insights and Forecast, 2019-2031
- 11.1. Market Analysis, Insights and Forecast - by Type
- 11.1.1. Water-Borne
- 11.1.2. Powder
- 11.1.3. High-solids
- 11.1.4. UV-cured coatings
- 11.2. Market Analysis, Insights and Forecast - by Application
- 11.2.1. Architectural Coatings
- 11.2.2. Industrial Coatings
- 11.2.3. Automotive Coatings
- 11.2.4. Wood Coatings
- 11.2.5. Packaging Coatings
- 11.2.6. Others
- 11.1. Market Analysis, Insights and Forecast - by Type
- 12. Asia Pacific Green Coatings Market Analysis, Insights and Forecast, 2019-2031
- 12.1. Market Analysis, Insights and Forecast - By Country/Sub-region
- 12.1.1 China
- 12.1.2 India
- 12.1.3 Japan
- 12.1.4 South Korea
- 12.1.5 Rest of Asia Pacific
- 13. North America Green Coatings Market Analysis, Insights and Forecast, 2019-2031
- 13.1. Market Analysis, Insights and Forecast - By Country/Sub-region
- 13.1.1 United States
- 13.1.2 Canada
- 13.1.3 Mexico
- 14. Europe Green Coatings Market Analysis, Insights and Forecast, 2019-2031
- 14.1. Market Analysis, Insights and Forecast - By Country/Sub-region
- 14.1.1 Germany
- 14.1.2 United Kingdom
- 14.1.3 Italy
- 14.1.4 France
- 14.1.5 Rest of Europe
- 15. South America Green Coatings Market Analysis, Insights and Forecast, 2019-2031
- 15.1. Market Analysis, Insights and Forecast - By Country/Sub-region
- 15.1.1 Brazil
- 15.1.2 Argentina
- 15.1.3 Rest of South America
- 16. Middle East Green Coatings Market Analysis, Insights and Forecast, 2019-2031
- 16.1. Market Analysis, Insights and Forecast - By Country/Sub-region
- 16.1.1 Middle East
- 16.1.2 Africa
- 17. Saudi Arabia Green Coatings Market Analysis, Insights and Forecast, 2019-2031
- 17.1. Market Analysis, Insights and Forecast - By Country/Sub-region
- 17.1.1 South Africa
- 17.1.2 Rest of Middle East
- 18. Competitive Analysis
- 18.1. Global Market Share Analysis 2024
- 18.2. Company Profiles
- 18.2.1 AkzoNobel N V
- 18.2.1.1. Overview
- 18.2.1.2. Products
- 18.2.1.3. SWOT Analysis
- 18.2.1.4. Recent Developments
- 18.2.1.5. Financials (Based on Availability)
- 18.2.2 Jotun
- 18.2.2.1. Overview
- 18.2.2.2. Products
- 18.2.2.3. SWOT Analysis
- 18.2.2.4. Recent Developments
- 18.2.2.5. Financials (Based on Availability)
- 18.2.3 Tikkurila Oyj*List Not Exhaustive
- 18.2.3.1. Overview
- 18.2.3.2. Products
- 18.2.3.3. SWOT Analysis
- 18.2.3.4. Recent Developments
- 18.2.3.5. Financials (Based on Availability)
- 18.2.4 RPM International Inc
- 18.2.4.1. Overview
- 18.2.4.2. Products
- 18.2.4.3. SWOT Analysis
- 18.2.4.4. Recent Developments
- 18.2.4.5. Financials (Based on Availability)
- 18.2.5 DAW SE
- 18.2.5.1. Overview
- 18.2.5.2. Products
- 18.2.5.3. SWOT Analysis
- 18.2.5.4. Recent Developments
- 18.2.5.5. Financials (Based on Availability)
- 18.2.6 PPG Industries Inc
- 18.2.6.1. Overview
- 18.2.6.2. Products
- 18.2.6.3. SWOT Analysis
- 18.2.6.4. Recent Developments
- 18.2.6.5. Financials (Based on Availability)
- 18.2.7 BASF SE
- 18.2.7.1. Overview
- 18.2.7.2. Products
- 18.2.7.3. SWOT Analysis
- 18.2.7.4. Recent Developments
- 18.2.7.5. Financials (Based on Availability)
- 18.2.8 Arkema Group
- 18.2.8.1. Overview
- 18.2.8.2. Products
- 18.2.8.3. SWOT Analysis
- 18.2.8.4. Recent Developments
- 18.2.8.5. Financials (Based on Availability)
- 18.2.9 Hempel A/S
- 18.2.9.1. Overview
- 18.2.9.2. Products
- 18.2.9.3. SWOT Analysis
- 18.2.9.4. Recent Developments
- 18.2.9.5. Financials (Based on Availability)
- 18.2.10 The Sherwin Williams Company
- 18.2.10.1. Overview
- 18.2.10.2. Products
- 18.2.10.3. SWOT Analysis
- 18.2.10.4. Recent Developments
- 18.2.10.5. Financials (Based on Availability)
- 18.2.11 Eastman Chemical Company
- 18.2.11.1. Overview
- 18.2.11.2. Products
- 18.2.11.3. SWOT Analysis
- 18.2.11.4. Recent Developments
- 18.2.11.5. Financials (Based on Availability)
- 18.2.12 Kansai Paint Company Limited
- 18.2.12.1. Overview
- 18.2.12.2. Products
- 18.2.12.3. SWOT Analysis
- 18.2.12.4. Recent Developments
- 18.2.12.5. Financials (Based on Availability)
- 18.2.13 Asian Paints Limited
- 18.2.13.1. Overview
- 18.2.13.2. Products
- 18.2.13.3. SWOT Analysis
- 18.2.13.4. Recent Developments
- 18.2.13.5. Financials (Based on Availability)
- 18.2.14 Berger Paints
- 18.2.14.1. Overview
- 18.2.14.2. Products
- 18.2.14.3. SWOT Analysis
- 18.2.14.4. Recent Developments
- 18.2.14.5. Financials (Based on Availability)
- 18.2.15 Axalta Coating Systems LLC
- 18.2.15.1. Overview
- 18.2.15.2. Products
- 18.2.15.3. SWOT Analysis
- 18.2.15.4. Recent Developments
- 18.2.15.5. Financials (Based on Availability)
- 18.2.16 Evonik Industries
- 18.2.16.1. Overview
- 18.2.16.2. Products
- 18.2.16.3. SWOT Analysis
- 18.2.16.4. Recent Developments
- 18.2.16.5. Financials (Based on Availability)
- 18.2.1 AkzoNobel N V
List of Figures
- Figure 1: Global Green Coatings Market Revenue Breakdown (Million, %) by Region 2024 & 2032
- Figure 2: Global Green Coatings Market Volume Breakdown (liter , %) by Region 2024 & 2032
- Figure 3: Asia Pacific Green Coatings Market Revenue (Million), by Country 2024 & 2032
- Figure 4: Asia Pacific Green Coatings Market Volume (liter ), by Country 2024 & 2032
- Figure 5: Asia Pacific Green Coatings Market Revenue Share (%), by Country 2024 & 2032
- Figure 6: Asia Pacific Green Coatings Market Volume Share (%), by Country 2024 & 2032
- Figure 7: North America Green Coatings Market Revenue (Million), by Country 2024 & 2032
- Figure 8: North America Green Coatings Market Volume (liter ), by Country 2024 & 2032
- Figure 9: North America Green Coatings Market Revenue Share (%), by Country 2024 & 2032
- Figure 10: North America Green Coatings Market Volume Share (%), by Country 2024 & 2032
- Figure 11: Europe Green Coatings Market Revenue (Million), by Country 2024 & 2032
- Figure 12: Europe Green Coatings Market Volume (liter ), by Country 2024 & 2032
- Figure 13: Europe Green Coatings Market Revenue Share (%), by Country 2024 & 2032
- Figure 14: Europe Green Coatings Market Volume Share (%), by Country 2024 & 2032
- Figure 15: South America Green Coatings Market Revenue (Million), by Country 2024 & 2032
- Figure 16: South America Green Coatings Market Volume (liter ), by Country 2024 & 2032
- Figure 17: South America Green Coatings Market Revenue Share (%), by Country 2024 & 2032
- Figure 18: South America Green Coatings Market Volume Share (%), by Country 2024 & 2032
- Figure 19: Middle East Green Coatings Market Revenue (Million), by Country 2024 & 2032
- Figure 20: Middle East Green Coatings Market Volume (liter ), by Country 2024 & 2032
- Figure 21: Middle East Green Coatings Market Revenue Share (%), by Country 2024 & 2032
- Figure 22: Middle East Green Coatings Market Volume Share (%), by Country 2024 & 2032
- Figure 23: Saudi Arabia Green Coatings Market Revenue (Million), by Country 2024 & 2032
- Figure 24: Saudi Arabia Green Coatings Market Volume (liter ), by Country 2024 & 2032
- Figure 25: Saudi Arabia Green Coatings Market Revenue Share (%), by Country 2024 & 2032
- Figure 26: Saudi Arabia Green Coatings Market Volume Share (%), by Country 2024 & 2032
- Figure 27: Asia Pacific Green Coatings Market Revenue (Million), by Type 2024 & 2032
- Figure 28: Asia Pacific Green Coatings Market Volume (liter ), by Type 2024 & 2032
- Figure 29: Asia Pacific Green Coatings Market Revenue Share (%), by Type 2024 & 2032
- Figure 30: Asia Pacific Green Coatings Market Volume Share (%), by Type 2024 & 2032
- Figure 31: Asia Pacific Green Coatings Market Revenue (Million), by Application 2024 & 2032
- Figure 32: Asia Pacific Green Coatings Market Volume (liter ), by Application 2024 & 2032
- Figure 33: Asia Pacific Green Coatings Market Revenue Share (%), by Application 2024 & 2032
- Figure 34: Asia Pacific Green Coatings Market Volume Share (%), by Application 2024 & 2032
- Figure 35: Asia Pacific Green Coatings Market Revenue (Million), by Country 2024 & 2032
- Figure 36: Asia Pacific Green Coatings Market Volume (liter ), by Country 2024 & 2032
- Figure 37: Asia Pacific Green Coatings Market Revenue Share (%), by Country 2024 & 2032
- Figure 38: Asia Pacific Green Coatings Market Volume Share (%), by Country 2024 & 2032
- Figure 39: North America Green Coatings Market Revenue (Million), by Type 2024 & 2032
- Figure 40: North America Green Coatings Market Volume (liter ), by Type 2024 & 2032
- Figure 41: North America Green Coatings Market Revenue Share (%), by Type 2024 & 2032
- Figure 42: North America Green Coatings Market Volume Share (%), by Type 2024 & 2032
- Figure 43: North America Green Coatings Market Revenue (Million), by Application 2024 & 2032
- Figure 44: North America Green Coatings Market Volume (liter ), by Application 2024 & 2032
- Figure 45: North America Green Coatings Market Revenue Share (%), by Application 2024 & 2032
- Figure 46: North America Green Coatings Market Volume Share (%), by Application 2024 & 2032
- Figure 47: North America Green Coatings Market Revenue (Million), by Country 2024 & 2032
- Figure 48: North America Green Coatings Market Volume (liter ), by Country 2024 & 2032
- Figure 49: North America Green Coatings Market Revenue Share (%), by Country 2024 & 2032
- Figure 50: North America Green Coatings Market Volume Share (%), by Country 2024 & 2032
- Figure 51: Europe Green Coatings Market Revenue (Million), by Type 2024 & 2032
- Figure 52: Europe Green Coatings Market Volume (liter ), by Type 2024 & 2032
- Figure 53: Europe Green Coatings Market Revenue Share (%), by Type 2024 & 2032
- Figure 54: Europe Green Coatings Market Volume Share (%), by Type 2024 & 2032
- Figure 55: Europe Green Coatings Market Revenue (Million), by Application 2024 & 2032
- Figure 56: Europe Green Coatings Market Volume (liter ), by Application 2024 & 2032
- Figure 57: Europe Green Coatings Market Revenue Share (%), by Application 2024 & 2032
- Figure 58: Europe Green Coatings Market Volume Share (%), by Application 2024 & 2032
- Figure 59: Europe Green Coatings Market Revenue (Million), by Country 2024 & 2032
- Figure 60: Europe Green Coatings Market Volume (liter ), by Country 2024 & 2032
- Figure 61: Europe Green Coatings Market Revenue Share (%), by Country 2024 & 2032
- Figure 62: Europe Green Coatings Market Volume Share (%), by Country 2024 & 2032
- Figure 63: South America Green Coatings Market Revenue (Million), by Type 2024 & 2032
- Figure 64: South America Green Coatings Market Volume (liter ), by Type 2024 & 2032
- Figure 65: South America Green Coatings Market Revenue Share (%), by Type 2024 & 2032
- Figure 66: South America Green Coatings Market Volume Share (%), by Type 2024 & 2032
- Figure 67: South America Green Coatings Market Revenue (Million), by Application 2024 & 2032
- Figure 68: South America Green Coatings Market Volume (liter ), by Application 2024 & 2032
- Figure 69: South America Green Coatings Market Revenue Share (%), by Application 2024 & 2032
- Figure 70: South America Green Coatings Market Volume Share (%), by Application 2024 & 2032
- Figure 71: South America Green Coatings Market Revenue (Million), by Country 2024 & 2032
- Figure 72: South America Green Coatings Market Volume (liter ), by Country 2024 & 2032
- Figure 73: South America Green Coatings Market Revenue Share (%), by Country 2024 & 2032
- Figure 74: South America Green Coatings Market Volume Share (%), by Country 2024 & 2032
- Figure 75: Middle East Green Coatings Market Revenue (Million), by Type 2024 & 2032
- Figure 76: Middle East Green Coatings Market Volume (liter ), by Type 2024 & 2032
- Figure 77: Middle East Green Coatings Market Revenue Share (%), by Type 2024 & 2032
- Figure 78: Middle East Green Coatings Market Volume Share (%), by Type 2024 & 2032
- Figure 79: Middle East Green Coatings Market Revenue (Million), by Application 2024 & 2032
- Figure 80: Middle East Green Coatings Market Volume (liter ), by Application 2024 & 2032
- Figure 81: Middle East Green Coatings Market Revenue Share (%), by Application 2024 & 2032
- Figure 82: Middle East Green Coatings Market Volume Share (%), by Application 2024 & 2032
- Figure 83: Middle East Green Coatings Market Revenue (Million), by Country 2024 & 2032
- Figure 84: Middle East Green Coatings Market Volume (liter ), by Country 2024 & 2032
- Figure 85: Middle East Green Coatings Market Revenue Share (%), by Country 2024 & 2032
- Figure 86: Middle East Green Coatings Market Volume Share (%), by Country 2024 & 2032
- Figure 87: Saudi Arabia Green Coatings Market Revenue (Million), by Type 2024 & 2032
- Figure 88: Saudi Arabia Green Coatings Market Volume (liter ), by Type 2024 & 2032
- Figure 89: Saudi Arabia Green Coatings Market Revenue Share (%), by Type 2024 & 2032
- Figure 90: Saudi Arabia Green Coatings Market Volume Share (%), by Type 2024 & 2032
- Figure 91: Saudi Arabia Green Coatings Market Revenue (Million), by Application 2024 & 2032
- Figure 92: Saudi Arabia Green Coatings Market Volume (liter ), by Application 2024 & 2032
- Figure 93: Saudi Arabia Green Coatings Market Revenue Share (%), by Application 2024 & 2032
- Figure 94: Saudi Arabia Green Coatings Market Volume Share (%), by Application 2024 & 2032
- Figure 95: Saudi Arabia Green Coatings Market Revenue (Million), by Country 2024 & 2032
- Figure 96: Saudi Arabia Green Coatings Market Volume (liter ), by Country 2024 & 2032
- Figure 97: Saudi Arabia Green Coatings Market Revenue Share (%), by Country 2024 & 2032
- Figure 98: Saudi Arabia Green Coatings Market Volume Share (%), by Country 2024 & 2032
List of Tables
- Table 1: Global Green Coatings Market Revenue Million Forecast, by Region 2019 & 2032
- Table 2: Global Green Coatings Market Volume liter Forecast, by Region 2019 & 2032
- Table 3: Global Green Coatings Market Revenue Million Forecast, by Type 2019 & 2032
- Table 4: Global Green Coatings Market Volume liter Forecast, by Type 2019 & 2032
- Table 5: Global Green Coatings Market Revenue Million Forecast, by Application 2019 & 2032
- Table 6: Global Green Coatings Market Volume liter Forecast, by Application 2019 & 2032
- Table 7: Global Green Coatings Market Revenue Million Forecast, by Region 2019 & 2032
- Table 8: Global Green Coatings Market Volume liter Forecast, by Region 2019 & 2032
- Table 9: Global Green Coatings Market Revenue Million Forecast, by Country 2019 & 2032
- Table 10: Global Green Coatings Market Volume liter Forecast, by Country 2019 & 2032
- Table 11: China Green Coatings Market Revenue (Million) Forecast, by Application 2019 & 2032
- Table 12: China Green Coatings Market Volume (liter ) Forecast, by Application 2019 & 2032
- Table 13: India Green Coatings Market Revenue (Million) Forecast, by Application 2019 & 2032
- Table 14: India Green Coatings Market Volume (liter ) Forecast, by Application 2019 & 2032
- Table 15: Japan Green Coatings Market Revenue (Million) Forecast, by Application 2019 & 2032
- Table 16: Japan Green Coatings Market Volume (liter ) Forecast, by Application 2019 & 2032
- Table 17: South Korea Green Coatings Market Revenue (Million) Forecast, by Application 2019 & 2032
- Table 18: South Korea Green Coatings Market Volume (liter ) Forecast, by Application 2019 & 2032
- Table 19: Rest of Asia Pacific Green Coatings Market Revenue (Million) Forecast, by Application 2019 & 2032
- Table 20: Rest of Asia Pacific Green Coatings Market Volume (liter ) Forecast, by Application 2019 & 2032
- Table 21: Global Green Coatings Market Revenue Million Forecast, by Country 2019 & 2032
- Table 22: Global Green Coatings Market Volume liter Forecast, by Country 2019 & 2032
- Table 23: United States Green Coatings Market Revenue (Million) Forecast, by Application 2019 & 2032
- Table 24: United States Green Coatings Market Volume (liter ) Forecast, by Application 2019 & 2032
- Table 25: Canada Green Coatings Market Revenue (Million) Forecast, by Application 2019 & 2032
- Table 26: Canada Green Coatings Market Volume (liter ) Forecast, by Application 2019 & 2032
- Table 27: Mexico Green Coatings Market Revenue (Million) Forecast, by Application 2019 & 2032
- Table 28: Mexico Green Coatings Market Volume (liter ) Forecast, by Application 2019 & 2032
- Table 29: Global Green Coatings Market Revenue Million Forecast, by Country 2019 & 2032
- Table 30: Global Green Coatings Market Volume liter Forecast, by Country 2019 & 2032
- Table 31: Germany Green Coatings Market Revenue (Million) Forecast, by Application 2019 & 2032
- Table 32: Germany Green Coatings Market Volume (liter ) Forecast, by Application 2019 & 2032
- Table 33: United Kingdom Green Coatings Market Revenue (Million) Forecast, by Application 2019 & 2032
- Table 34: United Kingdom Green Coatings Market Volume (liter ) Forecast, by Application 2019 & 2032
- Table 35: Italy Green Coatings Market Revenue (Million) Forecast, by Application 2019 & 2032
- Table 36: Italy Green Coatings Market Volume (liter ) Forecast, by Application 2019 & 2032
- Table 37: France Green Coatings Market Revenue (Million) Forecast, by Application 2019 & 2032
- Table 38: France Green Coatings Market Volume (liter ) Forecast, by Application 2019 & 2032
- Table 39: Rest of Europe Green Coatings Market Revenue (Million) Forecast, by Application 2019 & 2032
- Table 40: Rest of Europe Green Coatings Market Volume (liter ) Forecast, by Application 2019 & 2032
- Table 41: Global Green Coatings Market Revenue Million Forecast, by Country 2019 & 2032
- Table 42: Global Green Coatings Market Volume liter Forecast, by Country 2019 & 2032
- Table 43: Brazil Green Coatings Market Revenue (Million) Forecast, by Application 2019 & 2032
- Table 44: Brazil Green Coatings Market Volume (liter ) Forecast, by Application 2019 & 2032
- Table 45: Argentina Green Coatings Market Revenue (Million) Forecast, by Application 2019 & 2032
- Table 46: Argentina Green Coatings Market Volume (liter ) Forecast, by Application 2019 & 2032
- Table 47: Rest of South America Green Coatings Market Revenue (Million) Forecast, by Application 2019 & 2032
- Table 48: Rest of South America Green Coatings Market Volume (liter ) Forecast, by Application 2019 & 2032
- Table 49: Global Green Coatings Market Revenue Million Forecast, by Country 2019 & 2032
- Table 50: Global Green Coatings Market Volume liter Forecast, by Country 2019 & 2032
- Table 51: Middle East Green Coatings Market Revenue (Million) Forecast, by Application 2019 & 2032
- Table 52: Middle East Green Coatings Market Volume (liter ) Forecast, by Application 2019 & 2032
- Table 53: Africa Green Coatings Market Revenue (Million) Forecast, by Application 2019 & 2032
- Table 54: Africa Green Coatings Market Volume (liter ) Forecast, by Application 2019 & 2032
- Table 55: Global Green Coatings Market Revenue Million Forecast, by Country 2019 & 2032
- Table 56: Global Green Coatings Market Volume liter Forecast, by Country 2019 & 2032
- Table 57: South Africa Green Coatings Market Revenue (Million) Forecast, by Application 2019 & 2032
- Table 58: South Africa Green Coatings Market Volume (liter ) Forecast, by Application 2019 & 2032
- Table 59: Rest of Middle East Green Coatings Market Revenue (Million) Forecast, by Application 2019 & 2032
- Table 60: Rest of Middle East Green Coatings Market Volume (liter ) Forecast, by Application 2019 & 2032
- Table 61: Global Green Coatings Market Revenue Million Forecast, by Type 2019 & 2032
- Table 62: Global Green Coatings Market Volume liter Forecast, by Type 2019 & 2032
- Table 63: Global Green Coatings Market Revenue Million Forecast, by Application 2019 & 2032
- Table 64: Global Green Coatings Market Volume liter Forecast, by Application 2019 & 2032
- Table 65: Global Green Coatings Market Revenue Million Forecast, by Country 2019 & 2032
- Table 66: Global Green Coatings Market Volume liter Forecast, by Country 2019 & 2032
- Table 67: China Green Coatings Market Revenue (Million) Forecast, by Application 2019 & 2032
- Table 68: China Green Coatings Market Volume (liter ) Forecast, by Application 2019 & 2032
- Table 69: India Green Coatings Market Revenue (Million) Forecast, by Application 2019 & 2032
- Table 70: India Green Coatings Market Volume (liter ) Forecast, by Application 2019 & 2032
- Table 71: Japan Green Coatings Market Revenue (Million) Forecast, by Application 2019 & 2032
- Table 72: Japan Green Coatings Market Volume (liter ) Forecast, by Application 2019 & 2032
- Table 73: South Korea Green Coatings Market Revenue (Million) Forecast, by Application 2019 & 2032
- Table 74: South Korea Green Coatings Market Volume (liter ) Forecast, by Application 2019 & 2032
- Table 75: Rest of Asia Pacific Green Coatings Market Revenue (Million) Forecast, by Application 2019 & 2032
- Table 76: Rest of Asia Pacific Green Coatings Market Volume (liter ) Forecast, by Application 2019 & 2032
- Table 77: Global Green Coatings Market Revenue Million Forecast, by Type 2019 & 2032
- Table 78: Global Green Coatings Market Volume liter Forecast, by Type 2019 & 2032
- Table 79: Global Green Coatings Market Revenue Million Forecast, by Application 2019 & 2032
- Table 80: Global Green Coatings Market Volume liter Forecast, by Application 2019 & 2032
- Table 81: Global Green Coatings Market Revenue Million Forecast, by Country 2019 & 2032
- Table 82: Global Green Coatings Market Volume liter Forecast, by Country 2019 & 2032
- Table 83: United States Green Coatings Market Revenue (Million) Forecast, by Application 2019 & 2032
- Table 84: United States Green Coatings Market Volume (liter ) Forecast, by Application 2019 & 2032
- Table 85: Canada Green Coatings Market Revenue (Million) Forecast, by Application 2019 & 2032
- Table 86: Canada Green Coatings Market Volume (liter ) Forecast, by Application 2019 & 2032
- Table 87: Mexico Green Coatings Market Revenue (Million) Forecast, by Application 2019 & 2032
- Table 88: Mexico Green Coatings Market Volume (liter ) Forecast, by Application 2019 & 2032
- Table 89: Global Green Coatings Market Revenue Million Forecast, by Type 2019 & 2032
- Table 90: Global Green Coatings Market Volume liter Forecast, by Type 2019 & 2032
- Table 91: Global Green Coatings Market Revenue Million Forecast, by Application 2019 & 2032
- Table 92: Global Green Coatings Market Volume liter Forecast, by Application 2019 & 2032
- Table 93: Global Green Coatings Market Revenue Million Forecast, by Country 2019 & 2032
- Table 94: Global Green Coatings Market Volume liter Forecast, by Country 2019 & 2032
- Table 95: Germany Green Coatings Market Revenue (Million) Forecast, by Application 2019 & 2032
- Table 96: Germany Green Coatings Market Volume (liter ) Forecast, by Application 2019 & 2032
- Table 97: United Kingdom Green Coatings Market Revenue (Million) Forecast, by Application 2019 & 2032
- Table 98: United Kingdom Green Coatings Market Volume (liter ) Forecast, by Application 2019 & 2032
- Table 99: Italy Green Coatings Market Revenue (Million) Forecast, by Application 2019 & 2032
- Table 100: Italy Green Coatings Market Volume (liter ) Forecast, by Application 2019 & 2032
- Table 101: France Green Coatings Market Revenue (Million) Forecast, by Application 2019 & 2032
- Table 102: France Green Coatings Market Volume (liter ) Forecast, by Application 2019 & 2032
- Table 103: Rest of Europe Green Coatings Market Revenue (Million) Forecast, by Application 2019 & 2032
- Table 104: Rest of Europe Green Coatings Market Volume (liter ) Forecast, by Application 2019 & 2032
- Table 105: Global Green Coatings Market Revenue Million Forecast, by Type 2019 & 2032
- Table 106: Global Green Coatings Market Volume liter Forecast, by Type 2019 & 2032
- Table 107: Global Green Coatings Market Revenue Million Forecast, by Application 2019 & 2032
- Table 108: Global Green Coatings Market Volume liter Forecast, by Application 2019 & 2032
- Table 109: Global Green Coatings Market Revenue Million Forecast, by Country 2019 & 2032
- Table 110: Global Green Coatings Market Volume liter Forecast, by Country 2019 & 2032
- Table 111: Brazil Green Coatings Market Revenue (Million) Forecast, by Application 2019 & 2032
- Table 112: Brazil Green Coatings Market Volume (liter ) Forecast, by Application 2019 & 2032
- Table 113: Argentina Green Coatings Market Revenue (Million) Forecast, by Application 2019 & 2032
- Table 114: Argentina Green Coatings Market Volume (liter ) Forecast, by Application 2019 & 2032
- Table 115: Rest of South America Green Coatings Market Revenue (Million) Forecast, by Application 2019 & 2032
- Table 116: Rest of South America Green Coatings Market Volume (liter ) Forecast, by Application 2019 & 2032
- Table 117: Global Green Coatings Market Revenue Million Forecast, by Type 2019 & 2032
- Table 118: Global Green Coatings Market Volume liter Forecast, by Type 2019 & 2032
- Table 119: Global Green Coatings Market Revenue Million Forecast, by Application 2019 & 2032
- Table 120: Global Green Coatings Market Volume liter Forecast, by Application 2019 & 2032
- Table 121: Global Green Coatings Market Revenue Million Forecast, by Country 2019 & 2032
- Table 122: Global Green Coatings Market Volume liter Forecast, by Country 2019 & 2032
- Table 123: Global Green Coatings Market Revenue Million Forecast, by Type 2019 & 2032
- Table 124: Global Green Coatings Market Volume liter Forecast, by Type 2019 & 2032
- Table 125: Global Green Coatings Market Revenue Million Forecast, by Application 2019 & 2032
- Table 126: Global Green Coatings Market Volume liter Forecast, by Application 2019 & 2032
- Table 127: Global Green Coatings Market Revenue Million Forecast, by Country 2019 & 2032
- Table 128: Global Green Coatings Market Volume liter Forecast, by Country 2019 & 2032
- Table 129: South Africa Green Coatings Market Revenue (Million) Forecast, by Application 2019 & 2032
- Table 130: South Africa Green Coatings Market Volume (liter ) Forecast, by Application 2019 & 2032
- Table 131: Rest of Middle East Green Coatings Market Revenue (Million) Forecast, by Application 2019 & 2032
- Table 132: Rest of Middle East Green Coatings Market Volume (liter ) Forecast, by Application 2019 & 2032
Frequently Asked Questions
1. What is the projected Compound Annual Growth Rate (CAGR) of the Green Coatings Market?
The projected CAGR is approximately > 4.00%.
2. Which companies are prominent players in the Green Coatings Market?
Key companies in the market include AkzoNobel N V, Jotun, Tikkurila Oyj*List Not Exhaustive, RPM International Inc, DAW SE, PPG Industries Inc, BASF SE, Arkema Group, Hempel A/S, The Sherwin Williams Company, Eastman Chemical Company, Kansai Paint Company Limited, Asian Paints Limited, Berger Paints, Axalta Coating Systems LLC, Evonik Industries.
3. What are the main segments of the Green Coatings Market?
The market segments include Type, Application.
4. Can you provide details about the market size?
The market size is estimated to be USD 108780 Million as of 2022.
5. What are some drivers contributing to market growth?
; Stringent Environmental Regulations to Control VOC Emissions; Others.
6. What are the notable trends driving market growth?
Water-borne Segment to Dominate the Market.
7. Are there any restraints impacting market growth?
Price Hikes of Raw Materials; Other Restraints.
8. Can you provide examples of recent developments in the market?
N/A
9. What pricing options are available for accessing the report?
Pricing options include single-user, multi-user, and enterprise licenses priced at USD 4750, USD 5250, and USD 8750 respectively.
10. Is the market size provided in terms of value or volume?
The market size is provided in terms of value, measured in Million and volume, measured in liter .
11. Are there any specific market keywords associated with the report?
Yes, the market keyword associated with the report is "Green Coatings Market," which aids in identifying and referencing the specific market segment covered.
12. How do I determine which pricing option suits my needs best?
The pricing options vary based on user requirements and access needs. Individual users may opt for single-user licenses, while businesses requiring broader access may choose multi-user or enterprise licenses for cost-effective access to the report.
13. Are there any additional resources or data provided in the Green Coatings Market report?
While the report offers comprehensive insights, it's advisable to review the specific contents or supplementary materials provided to ascertain if additional resources or data are available.
14. How can I stay updated on further developments or reports in the Green Coatings Market?
To stay informed about further developments, trends, and reports in the Green Coatings Market, consider subscribing to industry newsletters, following relevant companies and organizations, or regularly checking reputable industry news sources and publications.
Methodology
Step 1 - Identification of Relevant Samples Size from Population Database


Step 2 - Approaches for Defining Global Market Size (Value, Volume* & Price*)

Note*: In applicable scenarios
Step 3 - Data Sources
Primary Research
- Web Analytics
- Survey Reports
- Research Institute
- Latest Research Reports
- Opinion Leaders
Secondary Research
- Annual Reports
- White Paper
- Latest Press Release
- Industry Association
- Paid Database
- Investor Presentations

Step 4 - Data Triangulation
Involves using different sources of information in order to increase the validity of a study
These sources are likely to be stakeholders in a program - participants, other researchers, program staff, other community members, and so on.
Then we put all data in single framework & apply various statistical tools to find out the dynamic on the market.
During the analysis stage, feedback from the stakeholder groups would be compared to determine areas of agreement as well as areas of divergence


