

Key Insights
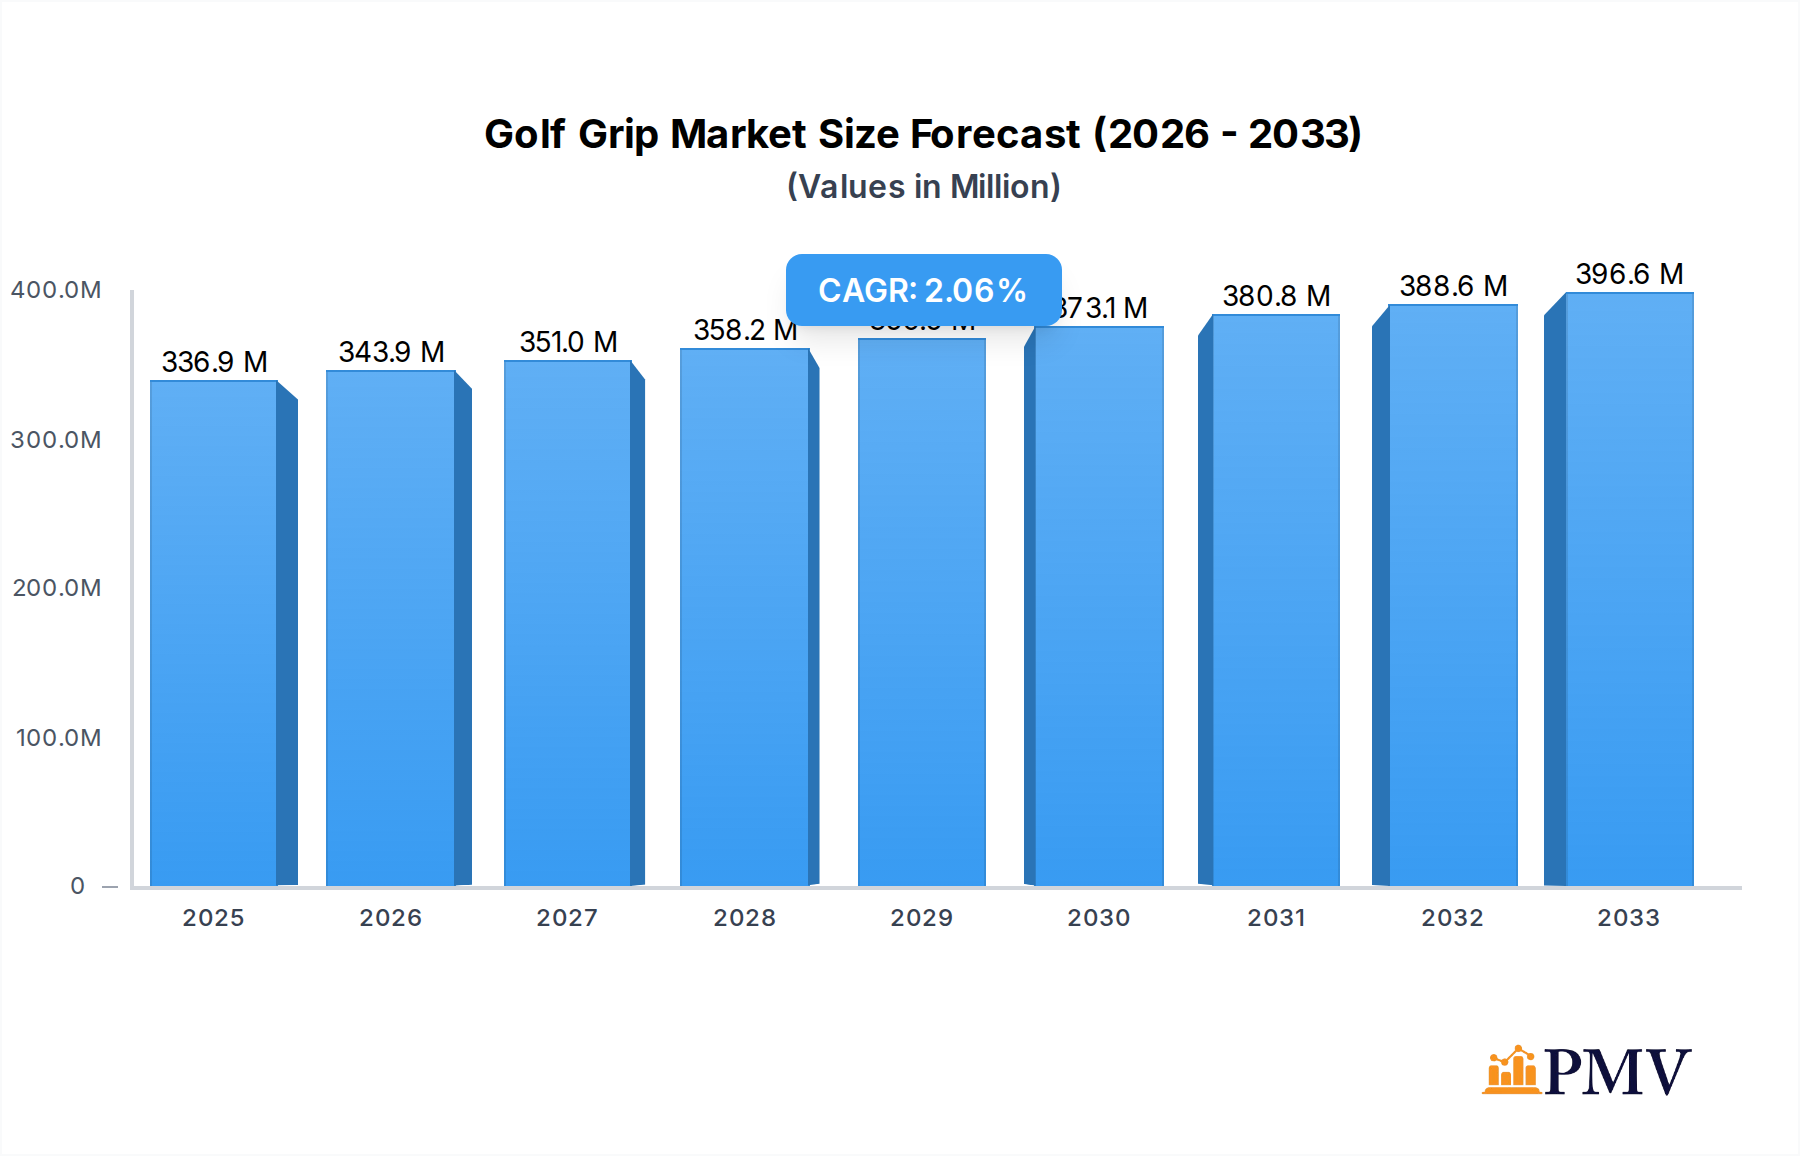
The global golf grip market is poised for steady growth, projected to reach USD 336.89 million in 2025, with an estimated Compound Annual Growth Rate (CAGR) of 2.09% between 2025 and 2033. This sustained expansion is driven by several key factors, including the increasing participation in golf globally, particularly among emerging economies, and a growing trend towards personalized equipment. Golfers are increasingly investing in premium grips that enhance performance, offer superior comfort, and provide a distinct aesthetic appeal, leading to a demand for innovative materials and designs. The market segmentation reflects this diversity, with applications spanning male, female, and junior golfers, each with distinct needs. The types of grips—rubber, corded, and other advanced materials—cater to varying playing styles and environmental conditions, further stimulating market activity. Furthermore, the growing popularity of golf as a recreational and professional sport, coupled with significant investments in golf course development and infrastructure, especially in the Asia Pacific and Middle East & Africa regions, will continue to fuel demand for golf grips.

Golf Grip Market Size (In Million)
The competitive landscape is characterized by the presence of established global brands and emerging players, all vying for market share through product innovation, strategic partnerships, and aggressive marketing campaigns. Companies are focusing on developing grips with enhanced durability, improved tackiness, and ergonomic designs to meet the evolving demands of golfers. The market is also witnessing a trend towards custom fitting and specialized grips, catering to the specific swing mechanics and preferences of individual players. While the market exhibits robust growth potential, certain restraints such as the high cost of premium grip materials and the availability of cheaper, less durable alternatives in certain price-sensitive segments could pose challenges. However, the overall trajectory remains positive, supported by a strong and loyal consumer base, ongoing technological advancements in grip manufacturing, and the enduring appeal of golf as a sport and lifestyle.
Golf Grip Company Market Share
This comprehensive golf grip market report offers an in-depth analysis of the global golf grip industry, meticulously examining its structure, competitive landscape, and future outlook. Covering the period from 2019 to 2033, with a base year of 2025, this report provides invaluable insights for manufacturers, distributors, investors, and golf enthusiasts. We delve into market concentration, key industry trends, dominant geographical regions and application segments, product innovations, and the critical growth drivers and challenges shaping the future of golf grips. With millions of dollars in market value projected, understanding these dynamics is paramount for strategic decision-making.
Golf Grip Market Structure & Competitive Dynamics
The global golf grip market is characterized by a moderately concentrated structure, with a few key players holding significant market share. Companies like Golf Pride, Lamkin, and SuperStroke are at the forefront, driving innovation and capturing a substantial portion of the golf equipment market. The market's health is further influenced by the interconnectedness of golf accessories and golf club components. Innovation ecosystems are robust, fueled by continuous research and development into new materials and ergonomic designs. Regulatory frameworks, primarily concerning material safety and environmental impact, are generally supportive, although evolving standards require constant adaptation. Product substitutes, such as alternative grip technologies or advancements in club design, present a minor threat, but the core function of a grip remains indispensable. End-user trends, influenced by professional endorsements and amateur player preferences, significantly shape product demand. Mergers and acquisitions (M&A) activity has been a notable feature, with deal values in the hundreds of millions of dollars, consolidating market power and expanding product portfolios. For instance, recent M&A deals have focused on acquiring innovative technologies or expanding regional reach. The golf grip industry is a dynamic segment of the broader golf sports market.
- Market Concentration: Dominated by a few key players with substantial market share.
- Innovation Ecosystems: Driven by R&D in materials, ergonomics, and performance enhancement.
- Regulatory Frameworks: Primarily focused on material safety and environmental compliance.
- Product Substitutes: Limited, with the core function of a grip being essential.
- End-User Trends: Influenced by professional endorsements and amateur player adoption.
- M&A Activities: Significant, with hundreds of millions of dollars in deal values, aimed at market consolidation and technology acquisition.
Golf Grip Industry Trends & Insights
The golf grip industry is poised for robust growth, propelled by several interconnected trends. A projected Compound Annual Growth Rate (CAGR) of approximately 6.2% over the forecast period (2025-2033) underscores the sector's upward trajectory. This expansion is primarily driven by increasing golf participation rates globally, particularly among emerging economies, and a growing emphasis on personalized golf equipment. Technological disruptions are revolutionizing grip design, with advancements in materials like advanced polymers and hybrid compounds offering enhanced durability, feel, and weather resistance. The integration of smart technologies for performance tracking is also gaining traction, though still in its nascent stages. Consumer preferences are shifting towards grips that offer superior comfort, vibration dampening, and specific tactile feedback, catering to a diverse range of playing styles and skill levels. The demand for ergonomic golf grips and high-performance golf grips is on the rise. Competitive dynamics are intensifying, with established brands investing heavily in marketing and product differentiation, while new entrants are focusing on niche segments and disruptive technologies. Market penetration for specialized grips, such as those designed for specific weather conditions or hand sizes, is steadily increasing. The rise of online retail channels has also democratized access to a wider variety of golf grip brands and product options, fostering a more informed consumer base. The golf market continues to evolve, with grips playing a crucial role in player performance and enjoyment. The total market size is estimated to be in the hundreds of millions of dollars.
Dominant Markets & Segments in Golf Grip
The golf grip market exhibits significant regional and segment-specific dominance. North America, particularly the United States, currently leads the market, driven by a mature golf culture, high disposable incomes, and a strong presence of leading manufacturers like Golf Pride, Lamkin, and SuperStroke. The Male segment within the Application category accounts for the largest market share, reflecting the historical dominance of men in the sport. However, the Female segment is exhibiting a higher growth rate, fueled by increasing women's golf participation and the availability of specialized, aesthetically pleasing, and performance-oriented women's golf grips. The Children segment, while smaller, represents a significant future growth opportunity as junior golf programs expand.
In terms of Type, Rubber grips continue to be the most prevalent due to their affordability, durability, and widespread availability. However, Corded grips are gaining popularity among players seeking enhanced traction and control, especially in wet conditions. The "Other" category, encompassing hybrid materials, gels, and advanced composites, is witnessing the most rapid innovation and is expected to capture a larger market share in the coming years, driven by the pursuit of enhanced performance and unique tactile experiences. Economic policies promoting sports and recreation, coupled with significant investments in golf course infrastructure, are key drivers of market growth in dominant regions. The demand for custom golf grips is also a growing trend.
- Leading Region: North America (USA) - Mature golf culture, high disposable income, strong manufacturing base.
- Leading Application Segment: Male - Historically dominant, with increasing growth in Female and Children segments.
- Dominant Type: Rubber - Cost-effective and durable, with growing interest in Corded and Other (hybrid/advanced material) grips.
- Key Drivers: Economic policies, sports participation initiatives, golf infrastructure development, technological advancements in grip materials.
Golf Grip Product Innovations
Product innovations in the golf grip sector are primarily focused on enhancing player performance, comfort, and durability. Key developments include the introduction of proprietary rubber compounds for superior tackiness and moisture-wicking, the use of hybrid materials combining the benefits of rubber and cord, and the exploration of ergonomic designs to reduce hand fatigue and improve swing consistency. SuperStroke's oversized grips, for instance, have revolutionized putting stability. Lamkin's advancements in zonal grip technology offer varied textures for optimal control. These innovations provide a competitive advantage by addressing specific player needs, from amateur golfers seeking improved feel to professional players demanding ultimate control. The market fit for these innovations is driven by the continuous quest for better scores and a more enjoyable golfing experience.
Report Segmentation & Scope
This report segments the golf grip market across key dimensions to provide granular insights. The Application segmentation includes Female, Male, and Children, each with distinct market sizes and growth projections. The Male segment is currently the largest, projected to reach a market size of over $500 million by 2025. The Female segment is expected to grow at a CAGR of 7.5%, reaching over $250 million by 2025. The Children segment, while smaller, is projected for significant expansion. The Type segmentation encompasses Rubber (projected market size over $600 million by 2025), Corded (projected market size over $150 million by 2025), and Other (including advanced composites and hybrid materials, projected to grow at a CAGR of 8.2% and reach over $100 million by 2025). Competitive dynamics within each segment vary, with specialized brands catering to niche demands.
Key Drivers of Golf Grip Growth
The golf grip market's expansion is fueled by a confluence of technological, economic, and societal factors. The increasing global participation in golf, particularly in Asia and other emerging markets, is a significant economic driver. Technological advancements in material science are enabling the development of performance golf grips with enhanced durability, grip comfort, and weather resistance, appealing to a wider player base. Government initiatives promoting sports and healthy lifestyles, coupled with substantial investments in golf course development, are further bolstering demand. The growing popularity of custom golf grips and personalization options reflects a key consumer trend. Furthermore, the influence of professional golfers and amplified media coverage of golf tournaments continue to inspire amateur players, driving the demand for premium and technologically advanced golf grips.
Challenges in the Golf Grip Sector
Despite the positive growth trajectory, the golf grip industry faces several challenges. Regulatory hurdles, particularly concerning material sourcing and environmental impact of manufacturing processes, can lead to increased production costs and necessitate ongoing compliance efforts. Supply chain disruptions, as evidenced by recent global events, can impact the availability and pricing of raw materials, affecting overall market stability. Intense competitive pressures from established players and the emergence of low-cost alternatives can squeeze profit margins. Furthermore, the relatively long lifespan of high-quality golf grips can sometimes limit the frequency of replacement purchases, posing a restraint on market growth. The cyclical nature of consumer spending on discretionary items like golf accessories also presents a potential challenge.
Leading Players in the Golf Grip Market
- Golf Pride
- Lamkin
- SuperStroke
- Winn
- TaylorMade
- Iomic
- Boccieri
- Avon Grips
- Integra
- Loudmouth Golf
- Cobra
- Scotty Cameron
- Tacki-Mac
- The Grip Master
- JumboMax
- EGIGO
- Ray Cook
- Rife
Key Developments in Golf Grip Sector
- 2023: Introduction of new hybrid materials offering enhanced grip and durability.
- 2023: Increased focus on sustainable manufacturing practices and eco-friendly materials.
- 2022: Launch of "smart" grips with integrated sensors for swing analysis.
- 2022: Expansion of XXL grip sizes catering to players with larger hands.
- 2021: Significant M&A activity, with consolidation aimed at expanding product portfolios.
- 2021: Increased adoption of custom-fitting services for personalized grips.
- 2020: Development of advanced vibration-dampening technologies for enhanced comfort.
Strategic Golf Grip Market Outlook
The strategic outlook for the golf grip market is exceptionally promising, driven by sustained growth accelerators. The expanding global golf economy, coupled with an increasing focus on player performance and personalized equipment, presents significant opportunities. Future market potential lies in further innovation within advanced golf grip materials, the integration of smart technology for data-driven insights, and the continued expansion into emerging golf markets. Strategic opportunities include forging partnerships with golf academies, investing in direct-to-consumer channels, and developing sustainable product lines to align with evolving consumer values. The golf accessories market continues to be a dynamic and lucrative segment within the broader sports industry.
Golf Grip Segmentation
-
1. Application
- 1.1. Female
- 1.2. Male
- 1.3. Children
-
2. Types
- 2.1. Rubber
- 2.2. Corded
- 2.3. Other
Golf Grip Segmentation By Geography
-
1. North America
- 1.1. United States
- 1.2. Canada
- 1.3. Mexico
-
2. South America
- 2.1. Brazil
- 2.2. Argentina
- 2.3. Rest of South America
-
3. Europe
- 3.1. United Kingdom
- 3.2. Germany
- 3.3. France
- 3.4. Italy
- 3.5. Spain
- 3.6. Russia
- 3.7. Benelux
- 3.8. Nordics
- 3.9. Rest of Europe
-
4. Middle East & Africa
- 4.1. Turkey
- 4.2. Israel
- 4.3. GCC
- 4.4. North Africa
- 4.5. South Africa
- 4.6. Rest of Middle East & Africa
-
5. Asia Pacific
- 5.1. China
- 5.2. India
- 5.3. Japan
- 5.4. South Korea
- 5.5. ASEAN
- 5.6. Oceania
- 5.7. Rest of Asia Pacific
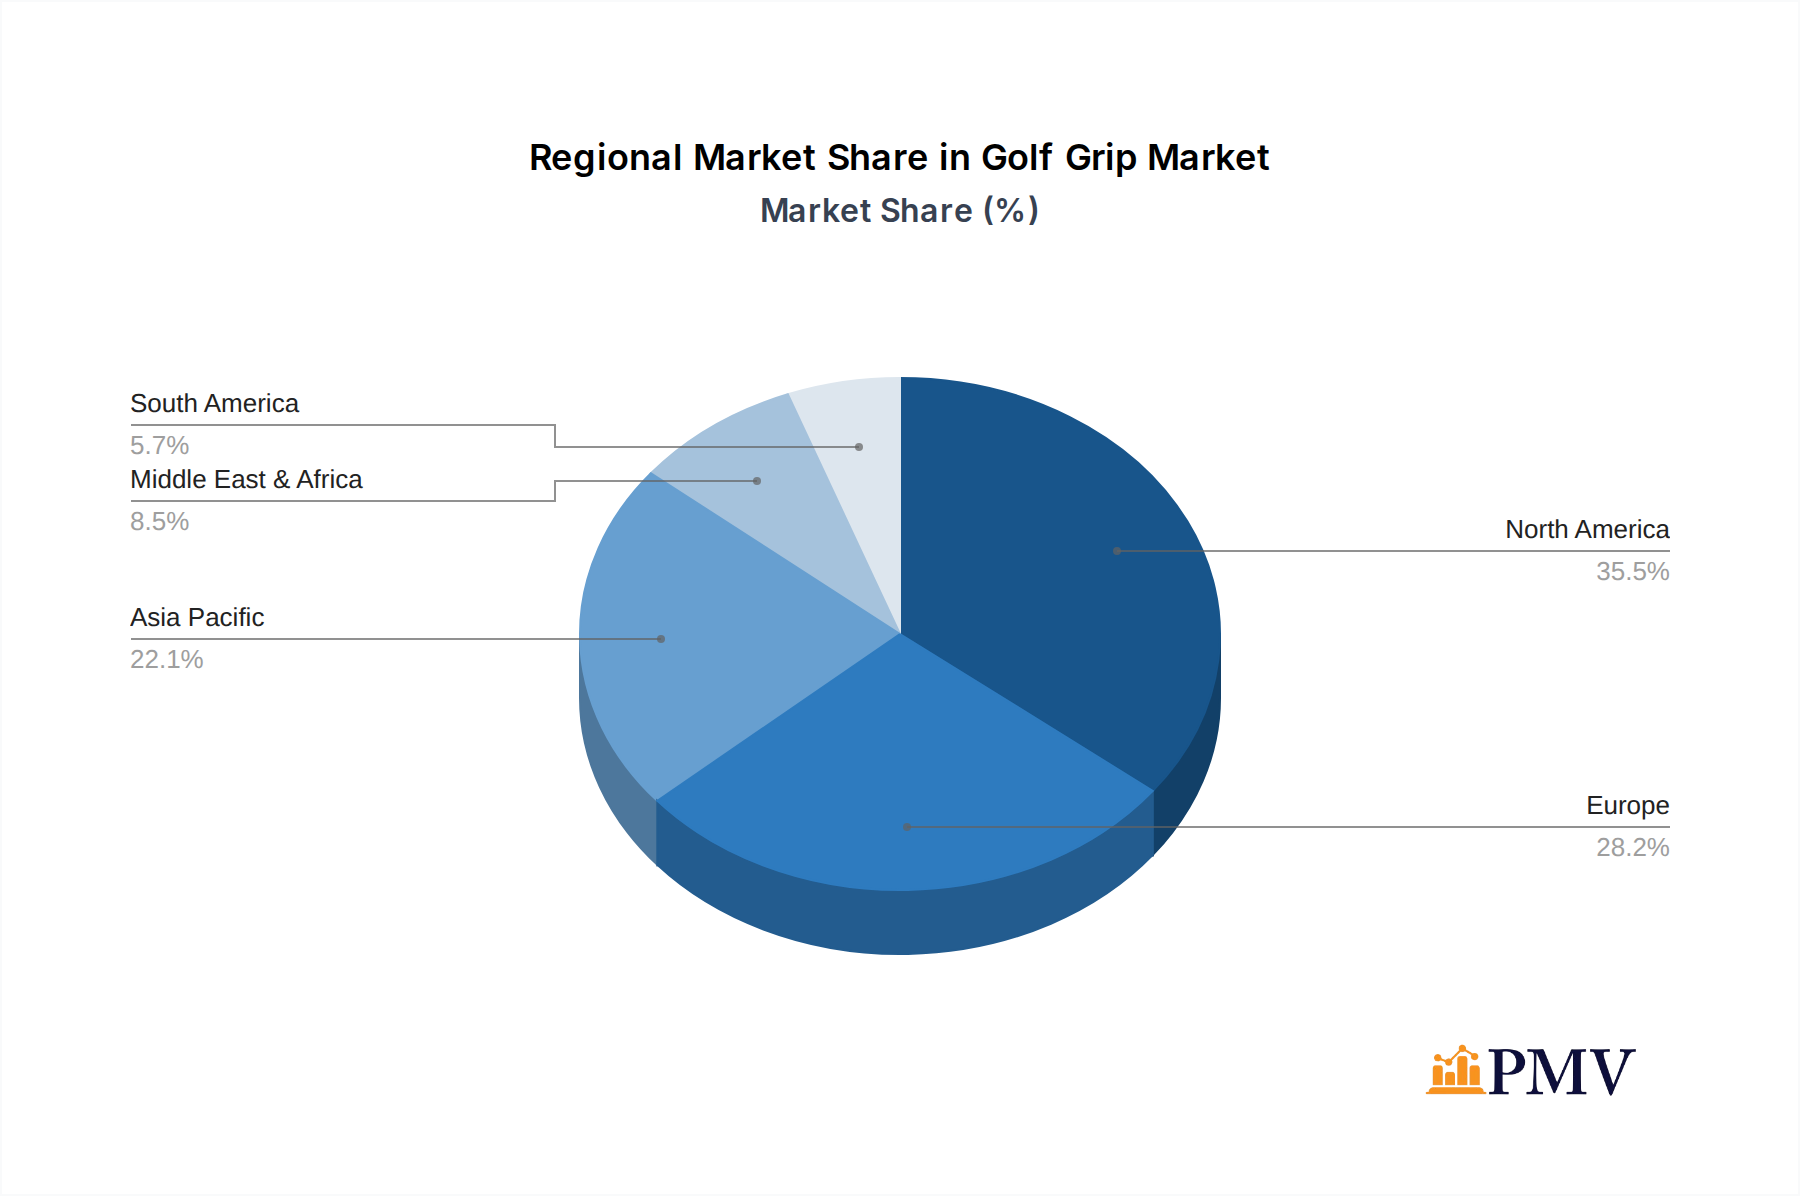
Golf Grip Regional Market Share
Geographic Coverage of Golf Grip
Golf Grip REPORT HIGHLIGHTS
| Aspects | Details |
|---|---|
| Study Period | 2020-2034 |
| Base Year | 2025 |
| Estimated Year | 2026 |
| Forecast Period | 2026-2034 |
| Historical Period | 2020-2025 |
| Growth Rate | CAGR of 2.09% from 2020-2034 |
| Segmentation |
|
Table of Contents
- 1. Introduction
- 1.1. Research Scope
- 1.2. Market Segmentation
- 1.3. Research Objective
- 1.4. Definitions and Assumptions
- 2. Executive Summary
- 2.1. Market Snapshot
- 3. Market Dynamics
- 3.1. Market Drivers
- 3.2. Market Restrains
- 3.3. Market Trends
- 3.4. Market Opportunities
- 4. Market Factor Analysis
- 4.1. Porters Five Forces
- 4.1.1. Bargaining Power of Suppliers
- 4.1.2. Bargaining Power of Buyers
- 4.1.3. Threat of New Entrants
- 4.1.4. Threat of Substitutes
- 4.1.5. Competitive Rivalry
- 4.2. PESTEL analysis
- 4.3. BCG Analysis
- 4.3.1. Stars (High Growth, High Market Share)
- 4.3.2. Cash Cows (Low Growth, High Market Share)
- 4.3.3. Question Mark (High Growth, Low Market Share)
- 4.3.4. Dogs (Low Growth, Low Market Share)
- 4.4. Ansoff Matrix Analysis
- 4.5. Supply Chain Analysis
- 4.6. Regulatory Landscape
- 4.7. Current Market Potential and Opportunity Assessment (TAM–SAM–SOM Framework)
- 4.8. PMV Analyst Note
- 4.1. Porters Five Forces
- 5. Market Analysis, Insights and Forecast 2021-2033
- 5.1. Market Analysis, Insights and Forecast - by Application
- 5.1.1. Female
- 5.1.2. Male
- 5.1.3. Children
- 5.2. Market Analysis, Insights and Forecast - by Types
- 5.2.1. Rubber
- 5.2.2. Corded
- 5.2.3. Other
- 5.3. Market Analysis, Insights and Forecast - by Region
- 5.3.1. North America
- 5.3.2. South America
- 5.3.3. Europe
- 5.3.4. Middle East & Africa
- 5.3.5. Asia Pacific
- 5.1. Market Analysis, Insights and Forecast - by Application
- 6. Global Golf Grip Analysis, Insights and Forecast, 2021-2033
- 6.1. Market Analysis, Insights and Forecast - by Application
- 6.1.1. Female
- 6.1.2. Male
- 6.1.3. Children
- 6.2. Market Analysis, Insights and Forecast - by Types
- 6.2.1. Rubber
- 6.2.2. Corded
- 6.2.3. Other
- 6.1. Market Analysis, Insights and Forecast - by Application
- 7. North America Golf Grip Analysis, Insights and Forecast, 2020-2032
- 7.1. Market Analysis, Insights and Forecast - by Application
- 7.1.1. Female
- 7.1.2. Male
- 7.1.3. Children
- 7.2. Market Analysis, Insights and Forecast - by Types
- 7.2.1. Rubber
- 7.2.2. Corded
- 7.2.3. Other
- 7.1. Market Analysis, Insights and Forecast - by Application
- 8. South America Golf Grip Analysis, Insights and Forecast, 2020-2032
- 8.1. Market Analysis, Insights and Forecast - by Application
- 8.1.1. Female
- 8.1.2. Male
- 8.1.3. Children
- 8.2. Market Analysis, Insights and Forecast - by Types
- 8.2.1. Rubber
- 8.2.2. Corded
- 8.2.3. Other
- 8.1. Market Analysis, Insights and Forecast - by Application
- 9. Europe Golf Grip Analysis, Insights and Forecast, 2020-2032
- 9.1. Market Analysis, Insights and Forecast - by Application
- 9.1.1. Female
- 9.1.2. Male
- 9.1.3. Children
- 9.2. Market Analysis, Insights and Forecast - by Types
- 9.2.1. Rubber
- 9.2.2. Corded
- 9.2.3. Other
- 9.1. Market Analysis, Insights and Forecast - by Application
- 10. Middle East & Africa Golf Grip Analysis, Insights and Forecast, 2020-2032
- 10.1. Market Analysis, Insights and Forecast - by Application
- 10.1.1. Female
- 10.1.2. Male
- 10.1.3. Children
- 10.2. Market Analysis, Insights and Forecast - by Types
- 10.2.1. Rubber
- 10.2.2. Corded
- 10.2.3. Other
- 10.1. Market Analysis, Insights and Forecast - by Application
- 11. Asia Pacific Golf Grip Analysis, Insights and Forecast, 2020-2032
- 11.1. Market Analysis, Insights and Forecast - by Application
- 11.1.1. Female
- 11.1.2. Male
- 11.1.3. Children
- 11.2. Market Analysis, Insights and Forecast - by Types
- 11.2.1. Rubber
- 11.2.2. Corded
- 11.2.3. Other
- 11.1. Market Analysis, Insights and Forecast - by Application
- 12. Competitive Analysis
- 12.1. Company Profiles
- 12.1.1 Golf Pride (US)
- 12.1.1.1. Company Overview
- 12.1.1.2. Products
- 12.1.1.3. Company Financials
- 12.1.1.4. SWOT Analysis
- 12.1.2 Lamkin (US)
- 12.1.2.1. Company Overview
- 12.1.2.2. Products
- 12.1.2.3. Company Financials
- 12.1.2.4. SWOT Analysis
- 12.1.3 SuperStroke (US)
- 12.1.3.1. Company Overview
- 12.1.3.2. Products
- 12.1.3.3. Company Financials
- 12.1.3.4. SWOT Analysis
- 12.1.4 Winn (US)
- 12.1.4.1. Company Overview
- 12.1.4.2. Products
- 12.1.4.3. Company Financials
- 12.1.4.4. SWOT Analysis
- 12.1.5 TaylorMade (US)
- 12.1.5.1. Company Overview
- 12.1.5.2. Products
- 12.1.5.3. Company Financials
- 12.1.5.4. SWOT Analysis
- 12.1.6 Iomic (JP)
- 12.1.6.1. Company Overview
- 12.1.6.2. Products
- 12.1.6.3. Company Financials
- 12.1.6.4. SWOT Analysis
- 12.1.7 Boccieri (US)
- 12.1.7.1. Company Overview
- 12.1.7.2. Products
- 12.1.7.3. Company Financials
- 12.1.7.4. SWOT Analysis
- 12.1.8 Avon Grips (US)
- 12.1.8.1. Company Overview
- 12.1.8.2. Products
- 12.1.8.3. Company Financials
- 12.1.8.4. SWOT Analysis
- 12.1.9 Integra (US)
- 12.1.9.1. Company Overview
- 12.1.9.2. Products
- 12.1.9.3. Company Financials
- 12.1.9.4. SWOT Analysis
- 12.1.10 Loudmouth Golf (US)
- 12.1.10.1. Company Overview
- 12.1.10.2. Products
- 12.1.10.3. Company Financials
- 12.1.10.4. SWOT Analysis
- 12.1.11 Cobra (US)
- 12.1.11.1. Company Overview
- 12.1.11.2. Products
- 12.1.11.3. Company Financials
- 12.1.11.4. SWOT Analysis
- 12.1.12 Scotty Cameron (US)
- 12.1.12.1. Company Overview
- 12.1.12.2. Products
- 12.1.12.3. Company Financials
- 12.1.12.4. SWOT Analysis
- 12.1.13 Tacki-Mac (US)
- 12.1.13.1. Company Overview
- 12.1.13.2. Products
- 12.1.13.3. Company Financials
- 12.1.13.4. SWOT Analysis
- 12.1.14 The Grip Master (AU)
- 12.1.14.1. Company Overview
- 12.1.14.2. Products
- 12.1.14.3. Company Financials
- 12.1.14.4. SWOT Analysis
- 12.1.15 JumboMax (US)
- 12.1.15.1. Company Overview
- 12.1.15.2. Products
- 12.1.15.3. Company Financials
- 12.1.15.4. SWOT Analysis
- 12.1.16 EGIGO (UK)
- 12.1.16.1. Company Overview
- 12.1.16.2. Products
- 12.1.16.3. Company Financials
- 12.1.16.4. SWOT Analysis
- 12.1.17 Ray Cook (US)
- 12.1.17.1. Company Overview
- 12.1.17.2. Products
- 12.1.17.3. Company Financials
- 12.1.17.4. SWOT Analysis
- 12.1.18 Rife (US)
- 12.1.18.1. Company Overview
- 12.1.18.2. Products
- 12.1.18.3. Company Financials
- 12.1.18.4. SWOT Analysis
- 12.1.1 Golf Pride (US)
- 12.2. Market Entropy
- 12.2.1 Company's Key Areas Served
- 12.2.2 Recent Developments
- 12.3. Company Market Share Analysis 2025
- 12.3.1 Top 5 Companies Market Share Analysis
- 12.3.2 Top 3 Companies Market Share Analysis
- 12.4. List of Potential Customers
- 13. Research Methodology
List of Figures
- Figure 1: Global Golf Grip Revenue Breakdown (undefined, %) by Region 2025 & 2033
- Figure 2: Global Golf Grip Volume Breakdown (K, %) by Region 2025 & 2033
- Figure 3: North America Golf Grip Revenue (undefined), by Application 2025 & 2033
- Figure 4: North America Golf Grip Volume (K), by Application 2025 & 2033
- Figure 5: North America Golf Grip Revenue Share (%), by Application 2025 & 2033
- Figure 6: North America Golf Grip Volume Share (%), by Application 2025 & 2033
- Figure 7: North America Golf Grip Revenue (undefined), by Types 2025 & 2033
- Figure 8: North America Golf Grip Volume (K), by Types 2025 & 2033
- Figure 9: North America Golf Grip Revenue Share (%), by Types 2025 & 2033
- Figure 10: North America Golf Grip Volume Share (%), by Types 2025 & 2033
- Figure 11: North America Golf Grip Revenue (undefined), by Country 2025 & 2033
- Figure 12: North America Golf Grip Volume (K), by Country 2025 & 2033
- Figure 13: North America Golf Grip Revenue Share (%), by Country 2025 & 2033
- Figure 14: North America Golf Grip Volume Share (%), by Country 2025 & 2033
- Figure 15: South America Golf Grip Revenue (undefined), by Application 2025 & 2033
- Figure 16: South America Golf Grip Volume (K), by Application 2025 & 2033
- Figure 17: South America Golf Grip Revenue Share (%), by Application 2025 & 2033
- Figure 18: South America Golf Grip Volume Share (%), by Application 2025 & 2033
- Figure 19: South America Golf Grip Revenue (undefined), by Types 2025 & 2033
- Figure 20: South America Golf Grip Volume (K), by Types 2025 & 2033
- Figure 21: South America Golf Grip Revenue Share (%), by Types 2025 & 2033
- Figure 22: South America Golf Grip Volume Share (%), by Types 2025 & 2033
- Figure 23: South America Golf Grip Revenue (undefined), by Country 2025 & 2033
- Figure 24: South America Golf Grip Volume (K), by Country 2025 & 2033
- Figure 25: South America Golf Grip Revenue Share (%), by Country 2025 & 2033
- Figure 26: South America Golf Grip Volume Share (%), by Country 2025 & 2033
- Figure 27: Europe Golf Grip Revenue (undefined), by Application 2025 & 2033
- Figure 28: Europe Golf Grip Volume (K), by Application 2025 & 2033
- Figure 29: Europe Golf Grip Revenue Share (%), by Application 2025 & 2033
- Figure 30: Europe Golf Grip Volume Share (%), by Application 2025 & 2033
- Figure 31: Europe Golf Grip Revenue (undefined), by Types 2025 & 2033
- Figure 32: Europe Golf Grip Volume (K), by Types 2025 & 2033
- Figure 33: Europe Golf Grip Revenue Share (%), by Types 2025 & 2033
- Figure 34: Europe Golf Grip Volume Share (%), by Types 2025 & 2033
- Figure 35: Europe Golf Grip Revenue (undefined), by Country 2025 & 2033
- Figure 36: Europe Golf Grip Volume (K), by Country 2025 & 2033
- Figure 37: Europe Golf Grip Revenue Share (%), by Country 2025 & 2033
- Figure 38: Europe Golf Grip Volume Share (%), by Country 2025 & 2033
- Figure 39: Middle East & Africa Golf Grip Revenue (undefined), by Application 2025 & 2033
- Figure 40: Middle East & Africa Golf Grip Volume (K), by Application 2025 & 2033
- Figure 41: Middle East & Africa Golf Grip Revenue Share (%), by Application 2025 & 2033
- Figure 42: Middle East & Africa Golf Grip Volume Share (%), by Application 2025 & 2033
- Figure 43: Middle East & Africa Golf Grip Revenue (undefined), by Types 2025 & 2033
- Figure 44: Middle East & Africa Golf Grip Volume (K), by Types 2025 & 2033
- Figure 45: Middle East & Africa Golf Grip Revenue Share (%), by Types 2025 & 2033
- Figure 46: Middle East & Africa Golf Grip Volume Share (%), by Types 2025 & 2033
- Figure 47: Middle East & Africa Golf Grip Revenue (undefined), by Country 2025 & 2033
- Figure 48: Middle East & Africa Golf Grip Volume (K), by Country 2025 & 2033
- Figure 49: Middle East & Africa Golf Grip Revenue Share (%), by Country 2025 & 2033
- Figure 50: Middle East & Africa Golf Grip Volume Share (%), by Country 2025 & 2033
- Figure 51: Asia Pacific Golf Grip Revenue (undefined), by Application 2025 & 2033
- Figure 52: Asia Pacific Golf Grip Volume (K), by Application 2025 & 2033
- Figure 53: Asia Pacific Golf Grip Revenue Share (%), by Application 2025 & 2033
- Figure 54: Asia Pacific Golf Grip Volume Share (%), by Application 2025 & 2033
- Figure 55: Asia Pacific Golf Grip Revenue (undefined), by Types 2025 & 2033
- Figure 56: Asia Pacific Golf Grip Volume (K), by Types 2025 & 2033
- Figure 57: Asia Pacific Golf Grip Revenue Share (%), by Types 2025 & 2033
- Figure 58: Asia Pacific Golf Grip Volume Share (%), by Types 2025 & 2033
- Figure 59: Asia Pacific Golf Grip Revenue (undefined), by Country 2025 & 2033
- Figure 60: Asia Pacific Golf Grip Volume (K), by Country 2025 & 2033
- Figure 61: Asia Pacific Golf Grip Revenue Share (%), by Country 2025 & 2033
- Figure 62: Asia Pacific Golf Grip Volume Share (%), by Country 2025 & 2033
List of Tables
- Table 1: Global Golf Grip Revenue undefined Forecast, by Application 2020 & 2033
- Table 2: Global Golf Grip Volume K Forecast, by Application 2020 & 2033
- Table 3: Global Golf Grip Revenue undefined Forecast, by Types 2020 & 2033
- Table 4: Global Golf Grip Volume K Forecast, by Types 2020 & 2033
- Table 5: Global Golf Grip Revenue undefined Forecast, by Region 2020 & 2033
- Table 6: Global Golf Grip Volume K Forecast, by Region 2020 & 2033
- Table 7: Global Golf Grip Revenue undefined Forecast, by Application 2020 & 2033
- Table 8: Global Golf Grip Volume K Forecast, by Application 2020 & 2033
- Table 9: Global Golf Grip Revenue undefined Forecast, by Types 2020 & 2033
- Table 10: Global Golf Grip Volume K Forecast, by Types 2020 & 2033
- Table 11: Global Golf Grip Revenue undefined Forecast, by Country 2020 & 2033
- Table 12: Global Golf Grip Volume K Forecast, by Country 2020 & 2033
- Table 13: United States Golf Grip Revenue (undefined) Forecast, by Application 2020 & 2033
- Table 14: United States Golf Grip Volume (K) Forecast, by Application 2020 & 2033
- Table 15: Canada Golf Grip Revenue (undefined) Forecast, by Application 2020 & 2033
- Table 16: Canada Golf Grip Volume (K) Forecast, by Application 2020 & 2033
- Table 17: Mexico Golf Grip Revenue (undefined) Forecast, by Application 2020 & 2033
- Table 18: Mexico Golf Grip Volume (K) Forecast, by Application 2020 & 2033
- Table 19: Global Golf Grip Revenue undefined Forecast, by Application 2020 & 2033
- Table 20: Global Golf Grip Volume K Forecast, by Application 2020 & 2033
- Table 21: Global Golf Grip Revenue undefined Forecast, by Types 2020 & 2033
- Table 22: Global Golf Grip Volume K Forecast, by Types 2020 & 2033
- Table 23: Global Golf Grip Revenue undefined Forecast, by Country 2020 & 2033
- Table 24: Global Golf Grip Volume K Forecast, by Country 2020 & 2033
- Table 25: Brazil Golf Grip Revenue (undefined) Forecast, by Application 2020 & 2033
- Table 26: Brazil Golf Grip Volume (K) Forecast, by Application 2020 & 2033
- Table 27: Argentina Golf Grip Revenue (undefined) Forecast, by Application 2020 & 2033
- Table 28: Argentina Golf Grip Volume (K) Forecast, by Application 2020 & 2033
- Table 29: Rest of South America Golf Grip Revenue (undefined) Forecast, by Application 2020 & 2033
- Table 30: Rest of South America Golf Grip Volume (K) Forecast, by Application 2020 & 2033
- Table 31: Global Golf Grip Revenue undefined Forecast, by Application 2020 & 2033
- Table 32: Global Golf Grip Volume K Forecast, by Application 2020 & 2033
- Table 33: Global Golf Grip Revenue undefined Forecast, by Types 2020 & 2033
- Table 34: Global Golf Grip Volume K Forecast, by Types 2020 & 2033
- Table 35: Global Golf Grip Revenue undefined Forecast, by Country 2020 & 2033
- Table 36: Global Golf Grip Volume K Forecast, by Country 2020 & 2033
- Table 37: United Kingdom Golf Grip Revenue (undefined) Forecast, by Application 2020 & 2033
- Table 38: United Kingdom Golf Grip Volume (K) Forecast, by Application 2020 & 2033
- Table 39: Germany Golf Grip Revenue (undefined) Forecast, by Application 2020 & 2033
- Table 40: Germany Golf Grip Volume (K) Forecast, by Application 2020 & 2033
- Table 41: France Golf Grip Revenue (undefined) Forecast, by Application 2020 & 2033
- Table 42: France Golf Grip Volume (K) Forecast, by Application 2020 & 2033
- Table 43: Italy Golf Grip Revenue (undefined) Forecast, by Application 2020 & 2033
- Table 44: Italy Golf Grip Volume (K) Forecast, by Application 2020 & 2033
- Table 45: Spain Golf Grip Revenue (undefined) Forecast, by Application 2020 & 2033
- Table 46: Spain Golf Grip Volume (K) Forecast, by Application 2020 & 2033
- Table 47: Russia Golf Grip Revenue (undefined) Forecast, by Application 2020 & 2033
- Table 48: Russia Golf Grip Volume (K) Forecast, by Application 2020 & 2033
- Table 49: Benelux Golf Grip Revenue (undefined) Forecast, by Application 2020 & 2033
- Table 50: Benelux Golf Grip Volume (K) Forecast, by Application 2020 & 2033
- Table 51: Nordics Golf Grip Revenue (undefined) Forecast, by Application 2020 & 2033
- Table 52: Nordics Golf Grip Volume (K) Forecast, by Application 2020 & 2033
- Table 53: Rest of Europe Golf Grip Revenue (undefined) Forecast, by Application 2020 & 2033
- Table 54: Rest of Europe Golf Grip Volume (K) Forecast, by Application 2020 & 2033
- Table 55: Global Golf Grip Revenue undefined Forecast, by Application 2020 & 2033
- Table 56: Global Golf Grip Volume K Forecast, by Application 2020 & 2033
- Table 57: Global Golf Grip Revenue undefined Forecast, by Types 2020 & 2033
- Table 58: Global Golf Grip Volume K Forecast, by Types 2020 & 2033
- Table 59: Global Golf Grip Revenue undefined Forecast, by Country 2020 & 2033
- Table 60: Global Golf Grip Volume K Forecast, by Country 2020 & 2033
- Table 61: Turkey Golf Grip Revenue (undefined) Forecast, by Application 2020 & 2033
- Table 62: Turkey Golf Grip Volume (K) Forecast, by Application 2020 & 2033
- Table 63: Israel Golf Grip Revenue (undefined) Forecast, by Application 2020 & 2033
- Table 64: Israel Golf Grip Volume (K) Forecast, by Application 2020 & 2033
- Table 65: GCC Golf Grip Revenue (undefined) Forecast, by Application 2020 & 2033
- Table 66: GCC Golf Grip Volume (K) Forecast, by Application 2020 & 2033
- Table 67: North Africa Golf Grip Revenue (undefined) Forecast, by Application 2020 & 2033
- Table 68: North Africa Golf Grip Volume (K) Forecast, by Application 2020 & 2033
- Table 69: South Africa Golf Grip Revenue (undefined) Forecast, by Application 2020 & 2033
- Table 70: South Africa Golf Grip Volume (K) Forecast, by Application 2020 & 2033
- Table 71: Rest of Middle East & Africa Golf Grip Revenue (undefined) Forecast, by Application 2020 & 2033
- Table 72: Rest of Middle East & Africa Golf Grip Volume (K) Forecast, by Application 2020 & 2033
- Table 73: Global Golf Grip Revenue undefined Forecast, by Application 2020 & 2033
- Table 74: Global Golf Grip Volume K Forecast, by Application 2020 & 2033
- Table 75: Global Golf Grip Revenue undefined Forecast, by Types 2020 & 2033
- Table 76: Global Golf Grip Volume K Forecast, by Types 2020 & 2033
- Table 77: Global Golf Grip Revenue undefined Forecast, by Country 2020 & 2033
- Table 78: Global Golf Grip Volume K Forecast, by Country 2020 & 2033
- Table 79: China Golf Grip Revenue (undefined) Forecast, by Application 2020 & 2033
- Table 80: China Golf Grip Volume (K) Forecast, by Application 2020 & 2033
- Table 81: India Golf Grip Revenue (undefined) Forecast, by Application 2020 & 2033
- Table 82: India Golf Grip Volume (K) Forecast, by Application 2020 & 2033
- Table 83: Japan Golf Grip Revenue (undefined) Forecast, by Application 2020 & 2033
- Table 84: Japan Golf Grip Volume (K) Forecast, by Application 2020 & 2033
- Table 85: South Korea Golf Grip Revenue (undefined) Forecast, by Application 2020 & 2033
- Table 86: South Korea Golf Grip Volume (K) Forecast, by Application 2020 & 2033
- Table 87: ASEAN Golf Grip Revenue (undefined) Forecast, by Application 2020 & 2033
- Table 88: ASEAN Golf Grip Volume (K) Forecast, by Application 2020 & 2033
- Table 89: Oceania Golf Grip Revenue (undefined) Forecast, by Application 2020 & 2033
- Table 90: Oceania Golf Grip Volume (K) Forecast, by Application 2020 & 2033
- Table 91: Rest of Asia Pacific Golf Grip Revenue (undefined) Forecast, by Application 2020 & 2033
- Table 92: Rest of Asia Pacific Golf Grip Volume (K) Forecast, by Application 2020 & 2033
Frequently Asked Questions
1. What is the projected Compound Annual Growth Rate (CAGR) of the Golf Grip?
The projected CAGR is approximately 2.09%.
2. Which companies are prominent players in the Golf Grip?
Key companies in the market include Golf Pride (US), Lamkin (US), SuperStroke (US), Winn (US), TaylorMade (US), Iomic (JP), Boccieri (US), Avon Grips (US), Integra (US), Loudmouth Golf (US), Cobra (US), Scotty Cameron (US), Tacki-Mac (US), The Grip Master (AU), JumboMax (US), EGIGO (UK), Ray Cook (US), Rife (US).
3. What are the main segments of the Golf Grip?
The market segments include Application, Types.
4. Can you provide details about the market size?
The market size is estimated to be USD XXX N/A as of 2022.
5. What are some drivers contributing to market growth?
N/A
6. What are the notable trends driving market growth?
N/A
7. Are there any restraints impacting market growth?
N/A
8. Can you provide examples of recent developments in the market?
N/A
9. What pricing options are available for accessing the report?
Pricing options include single-user, multi-user, and enterprise licenses priced at USD 3350.00, USD 5025.00, and USD 6700.00 respectively.
10. Is the market size provided in terms of value or volume?
The market size is provided in terms of value, measured in N/A and volume, measured in K.
11. Are there any specific market keywords associated with the report?
Yes, the market keyword associated with the report is "Golf Grip," which aids in identifying and referencing the specific market segment covered.
12. How do I determine which pricing option suits my needs best?
The pricing options vary based on user requirements and access needs. Individual users may opt for single-user licenses, while businesses requiring broader access may choose multi-user or enterprise licenses for cost-effective access to the report.
13. Are there any additional resources or data provided in the Golf Grip report?
While the report offers comprehensive insights, it's advisable to review the specific contents or supplementary materials provided to ascertain if additional resources or data are available.
14. How can I stay updated on further developments or reports in the Golf Grip?
To stay informed about further developments, trends, and reports in the Golf Grip, consider subscribing to industry newsletters, following relevant companies and organizations, or regularly checking reputable industry news sources and publications.
Methodology
Step 1 - Identification of Relevant Samples Size from Population Database


Step 2 - Approaches for Defining Global Market Size (Value, Volume* & Price*)

Note*: In applicable scenarios
Step 3 - Data Sources
Primary Research
- Web Analytics
- Survey Reports
- Research Institute
- Latest Research Reports
- Opinion Leaders
Secondary Research
- Annual Reports
- White Paper
- Latest Press Release
- Industry Association
- Paid Database
- Investor Presentations

Step 4 - Data Triangulation
Involves using different sources of information in order to increase the validity of a study
These sources are likely to be stakeholders in a program - participants, other researchers, program staff, other community members, and so on.
Then we put all data in single framework & apply various statistical tools to find out the dynamic on the market.
During the analysis stage, feedback from the stakeholder groups would be compared to determine areas of agreement as well as areas of divergence