

Key Insights
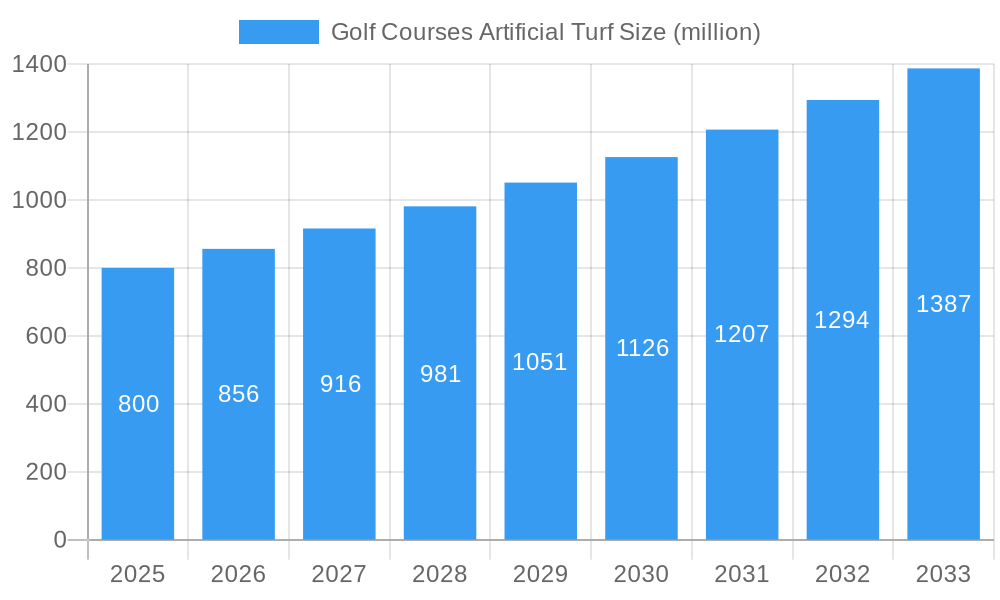
The global golf courses artificial turf market is experiencing robust growth, driven by increasing demand for low-maintenance, aesthetically pleasing, and consistently playable golf courses. Factors such as water conservation concerns, rising labor costs associated with natural grass maintenance, and the desire for year-round playability are significantly contributing to market expansion. Technological advancements in artificial turf manufacturing, leading to products with enhanced durability, realistic appearance, and improved drainage, are further fueling market growth. We estimate the market size in 2025 to be around $800 million, based on industry reports showing strong growth in related sectors like sports turf. A Compound Annual Growth Rate (CAGR) of 7% is projected for the forecast period (2025-2033), indicating a substantial increase in market value over the next decade. Key market segments include different turf types (e.g., monofilament, fibrillated), installation services, and geographic regions. Leading companies like Italgreen, SYNLawn, and Southwest Greens are actively shaping the market through innovation and expansion. While initial installation costs represent a barrier to entry for some golf courses, the long-term cost savings and operational benefits are increasingly outweighing this consideration.
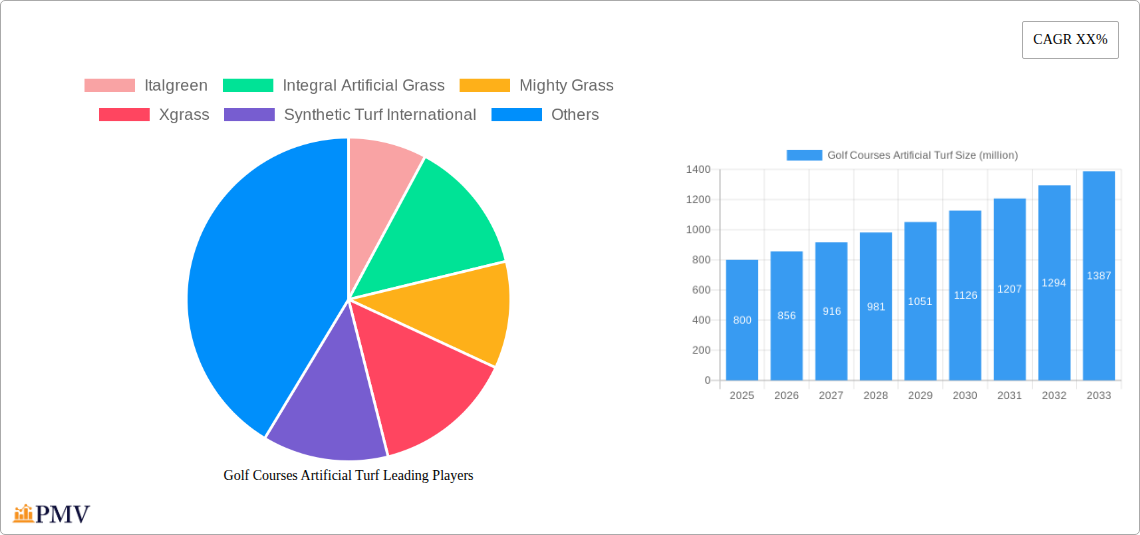
Golf Courses Artificial Turf Market Size (In Million)
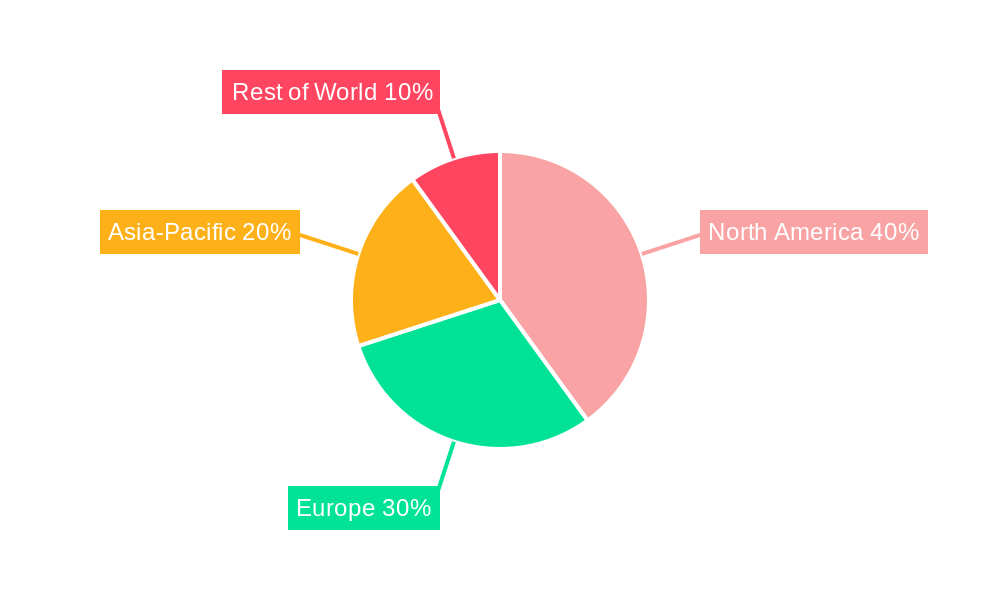
The market's regional distribution shows a strong presence in North America and Europe, driven by high adoption rates and established infrastructure. However, Asia-Pacific and other emerging economies are presenting significant growth opportunities due to increasing disposable incomes and the burgeoning golf industry in these regions. Market restraints include concerns about the environmental impact of artificial turf production and disposal, and the potential for negative perceptions regarding the playing experience compared to natural grass. However, ongoing innovations in sustainable manufacturing processes and the development of more environmentally friendly products are mitigating these concerns. The future of the golf courses artificial turf market is bright, with continued growth expected as technological advancements address existing challenges and the benefits of artificial turf become increasingly apparent.
Golf Courses Artificial Turf Company Market Share
Golf Courses Artificial Turf Market Report: 2019-2033
This comprehensive report provides a detailed analysis of the global Golf Courses Artificial Turf market, offering invaluable insights for stakeholders, investors, and industry professionals. The study period covers 2019-2033, with 2025 as the base and estimated year. The forecast period spans 2025-2033, and the historical period encompasses 2019-2024. This report projects a market valued at $xx million in 2025, poised for significant growth in the coming years.
Golf Courses Artificial Turf Market Structure & Competitive Dynamics
The global golf courses artificial turf market exhibits a moderately concentrated structure, with several key players holding significant market share. The leading companies, including Italgreen, Integral Artificial Grass, Mighty Grass, Xgrass, Synthetic Turf International, SYNLawn Golf, ILKESPORT, SYNLawn, Southwest Greens, Relyir, Ccgrass, and Vivaturf, compete based on product quality, innovation, pricing, and distribution networks. Market concentration is estimated at xx%, with the top five players accounting for approximately xx% of the total revenue in 2025.
Innovation is a key competitive driver, with companies continuously investing in R&D to develop new turf technologies that offer improved performance, durability, and aesthetics. Regulatory frameworks concerning environmental impact and material safety also influence market dynamics. The presence of natural grass as a substitute impacts market growth; however, the increasing popularity of artificial turf due to its lower maintenance costs and year-round playability is offsetting this factor. End-user preferences are increasingly shifting towards sustainable and high-performance products. M&A activities have been moderate in the recent past, with a total deal value of approximately $xx million recorded between 2019 and 2024. Significant mergers and acquisitions are anticipated in the forecast period driven by the increasing need for economies of scale and expansion into new markets.
- Market Share: Italgreen (xx%), Integral Artificial Grass (xx%), Mighty Grass (xx%), Xgrass (xx%), Synthetic Turf International (xx%), others (xx%).
- M&A Deal Value (2019-2024): $xx million
- Key Competitive Factors: Product innovation, pricing strategies, distribution networks, brand reputation, sustainability certifications.
Golf Courses Artificial Turf Industry Trends & Insights
The golf courses artificial turf market is experiencing robust growth, driven by factors such as increasing urbanization, rising disposable incomes in key markets, growing popularity of golf, and the desire for low-maintenance, high-performance playing surfaces. Technological advancements in artificial turf manufacturing, including the development of more realistic and durable products, are further fueling market expansion. Consumer preferences are shifting towards eco-friendly and sustainable options. The market is expected to register a Compound Annual Growth Rate (CAGR) of xx% during the forecast period (2025-2033). Market penetration is currently at xx% in developed countries and is expected to increase significantly in developing regions. Competitive dynamics are characterized by continuous product innovation, strategic partnerships, and expansion into new geographical markets. The increasing adoption of advanced technologies, such as improved drainage systems and UV-resistant fibers, is also contributing significantly to market growth.
Dominant Markets & Segments in Golf Courses Artificial Turf
The North American region currently holds the dominant position in the global golf courses artificial turf market. This is primarily attributed to high golf participation rates, robust infrastructure, favorable economic conditions, and early adoption of artificial turf technology.
- Key Drivers of Dominance in North America:
- High golf participation rates and a well-established golf industry.
- Strong economic conditions and high disposable incomes.
- Favorable government policies and infrastructure development.
- Early adoption of artificial turf technology.
- Extensive presence of key market players with strong distribution networks.
Other regions, such as Europe and Asia-Pacific, are also showing considerable growth potential due to rising golf popularity and increasing investments in golf course infrastructure. However, the penetration rates are comparatively lower in these markets. The high-end segment, which includes premium artificial turf products with enhanced performance characteristics, is experiencing faster growth compared to the standard segment.
Golf Courses Artificial Turf Product Innovations
Recent innovations in golf courses artificial turf focus on enhanced realism, improved durability, and sustainability. Companies are investing in the development of turf with improved drainage systems, UV resistance, and natural-looking aesthetics. New infill materials and fiber technologies are being incorporated to enhance playability and longevity. This focus on innovation directly translates into a competitive advantage, enabling companies to offer superior products that meet evolving customer demands.
Report Segmentation & Scope
This report segments the golf courses artificial turf market based on product type (monofilament, fibrillated, etc.), application (golf course fairways, greens, tees, etc.), and geography (North America, Europe, Asia-Pacific, etc.). Each segment's market size, growth projections, and competitive landscape are analyzed in detail. Market size for each segment is projected to reach xx million dollars within the forecast period. Competitive dynamics vary across segments, with some experiencing higher levels of competition than others.
Key Drivers of Golf Courses Artificial Turf Growth
Several factors are driving the growth of the golf courses artificial turf market. These include technological advancements leading to superior product performance and durability, increasing disposable incomes in developing countries fueling demand, favorable government policies promoting the use of sustainable materials, and rising awareness of the environmental benefits of artificial turf compared to natural grass, especially in water-scarce regions. The growing popularity of golf globally is also a major driver.
Challenges in the Golf Courses Artificial Turf Sector
The golf courses artificial turf sector faces certain challenges, including high initial investment costs, concerns about the environmental impact of artificial turf, potential regulatory hurdles related to material composition and disposal, and supply chain disruptions affecting raw material availability and pricing. These challenges impact the overall growth trajectory of the market, however, ongoing innovation is steadily mitigating these concerns. The estimated impact of these challenges on market growth is approximately xx%.
Leading Players in the Golf Courses Artificial Turf Market
- Italgreen
- Integral Artificial Grass
- Mighty Grass
- Xgrass
- Synthetic Turf International
- SYNLawn Golf
- ILKESPORT
- SYNLawn
- Southwest Greens
- Relyir
- Ccgrass
- Vivaturf
Key Developments in Golf Courses Artificial Turf Sector
- 2022 (Q3): Xgrass launches a new line of sustainable artificial turf.
- 2023 (Q1): Synthetic Turf International announces a strategic partnership with a major distributor in Asia.
- 2024 (Q4): Italgreen acquires a smaller competitor, expanding its market share. (Further details on specific developments with impact on market dynamics will be included in the full report)
Strategic Golf Courses Artificial Turf Market Outlook
The future of the golf courses artificial turf market looks bright, with continued growth driven by technological innovation, increasing demand from both developed and developing countries, and growing awareness of the environmental and economic benefits of artificial turf. Strategic opportunities exist for companies that can develop sustainable products, expand their global reach, and offer comprehensive solutions to meet the evolving needs of golf course operators. This includes leveraging technological advancements and fostering strategic alliances to maintain a competitive edge in the market.
Golf Courses Artificial Turf Segmentation
-
1. Application
- 1.1. Private Golf Course
- 1.2. Commercial Golf Course
-
2. Types
- 2.1. Polypropylene Artificial Turf
- 2.2. Nylon Artificial Turf
- 2.3. Others
Golf Courses Artificial Turf Segmentation By Geography
-
1. North America
- 1.1. United States
- 1.2. Canada
- 1.3. Mexico
-
2. South America
- 2.1. Brazil
- 2.2. Argentina
- 2.3. Rest of South America
-
3. Europe
- 3.1. United Kingdom
- 3.2. Germany
- 3.3. France
- 3.4. Italy
- 3.5. Spain
- 3.6. Russia
- 3.7. Benelux
- 3.8. Nordics
- 3.9. Rest of Europe
-
4. Middle East & Africa
- 4.1. Turkey
- 4.2. Israel
- 4.3. GCC
- 4.4. North Africa
- 4.5. South Africa
- 4.6. Rest of Middle East & Africa
-
5. Asia Pacific
- 5.1. China
- 5.2. India
- 5.3. Japan
- 5.4. South Korea
- 5.5. ASEAN
- 5.6. Oceania
- 5.7. Rest of Asia Pacific
Golf Courses Artificial Turf Regional Market Share
Geographic Coverage of Golf Courses Artificial Turf
Golf Courses Artificial Turf REPORT HIGHLIGHTS
| Aspects | Details |
|---|---|
| Study Period | 2020-2034 |
| Base Year | 2025 |
| Estimated Year | 2026 |
| Forecast Period | 2026-2034 |
| Historical Period | 2020-2025 |
| Growth Rate | CAGR of 8.3% from 2020-2034 |
| Segmentation |
|
Table of Contents
- 1. Introduction
- 1.1. Research Scope
- 1.2. Market Segmentation
- 1.3. Research Methodology
- 1.4. Definitions and Assumptions
- 2. Executive Summary
- 2.1. Introduction
- 3. Market Dynamics
- 3.1. Introduction
- 3.2. Market Drivers
- 3.3. Market Restrains
- 3.4. Market Trends
- 4. Market Factor Analysis
- 4.1. Porters Five Forces
- 4.2. Supply/Value Chain
- 4.3. PESTEL analysis
- 4.4. Market Entropy
- 4.5. Patent/Trademark Analysis
- 5. Global Golf Courses Artificial Turf Analysis, Insights and Forecast, 2020-2032
- 5.1. Market Analysis, Insights and Forecast - by Application
- 5.1.1. Private Golf Course
- 5.1.2. Commercial Golf Course
- 5.2. Market Analysis, Insights and Forecast - by Types
- 5.2.1. Polypropylene Artificial Turf
- 5.2.2. Nylon Artificial Turf
- 5.2.3. Others
- 5.3. Market Analysis, Insights and Forecast - by Region
- 5.3.1. North America
- 5.3.2. South America
- 5.3.3. Europe
- 5.3.4. Middle East & Africa
- 5.3.5. Asia Pacific
- 5.1. Market Analysis, Insights and Forecast - by Application
- 6. North America Golf Courses Artificial Turf Analysis, Insights and Forecast, 2020-2032
- 6.1. Market Analysis, Insights and Forecast - by Application
- 6.1.1. Private Golf Course
- 6.1.2. Commercial Golf Course
- 6.2. Market Analysis, Insights and Forecast - by Types
- 6.2.1. Polypropylene Artificial Turf
- 6.2.2. Nylon Artificial Turf
- 6.2.3. Others
- 6.1. Market Analysis, Insights and Forecast - by Application
- 7. South America Golf Courses Artificial Turf Analysis, Insights and Forecast, 2020-2032
- 7.1. Market Analysis, Insights and Forecast - by Application
- 7.1.1. Private Golf Course
- 7.1.2. Commercial Golf Course
- 7.2. Market Analysis, Insights and Forecast - by Types
- 7.2.1. Polypropylene Artificial Turf
- 7.2.2. Nylon Artificial Turf
- 7.2.3. Others
- 7.1. Market Analysis, Insights and Forecast - by Application
- 8. Europe Golf Courses Artificial Turf Analysis, Insights and Forecast, 2020-2032
- 8.1. Market Analysis, Insights and Forecast - by Application
- 8.1.1. Private Golf Course
- 8.1.2. Commercial Golf Course
- 8.2. Market Analysis, Insights and Forecast - by Types
- 8.2.1. Polypropylene Artificial Turf
- 8.2.2. Nylon Artificial Turf
- 8.2.3. Others
- 8.1. Market Analysis, Insights and Forecast - by Application
- 9. Middle East & Africa Golf Courses Artificial Turf Analysis, Insights and Forecast, 2020-2032
- 9.1. Market Analysis, Insights and Forecast - by Application
- 9.1.1. Private Golf Course
- 9.1.2. Commercial Golf Course
- 9.2. Market Analysis, Insights and Forecast - by Types
- 9.2.1. Polypropylene Artificial Turf
- 9.2.2. Nylon Artificial Turf
- 9.2.3. Others
- 9.1. Market Analysis, Insights and Forecast - by Application
- 10. Asia Pacific Golf Courses Artificial Turf Analysis, Insights and Forecast, 2020-2032
- 10.1. Market Analysis, Insights and Forecast - by Application
- 10.1.1. Private Golf Course
- 10.1.2. Commercial Golf Course
- 10.2. Market Analysis, Insights and Forecast - by Types
- 10.2.1. Polypropylene Artificial Turf
- 10.2.2. Nylon Artificial Turf
- 10.2.3. Others
- 10.1. Market Analysis, Insights and Forecast - by Application
- 11. Competitive Analysis
- 11.1. Global Market Share Analysis 2025
- 11.2. Company Profiles
- 11.2.1 Italgreen
- 11.2.1.1. Overview
- 11.2.1.2. Products
- 11.2.1.3. SWOT Analysis
- 11.2.1.4. Recent Developments
- 11.2.1.5. Financials (Based on Availability)
- 11.2.2 Integral Artificial Grass
- 11.2.2.1. Overview
- 11.2.2.2. Products
- 11.2.2.3. SWOT Analysis
- 11.2.2.4. Recent Developments
- 11.2.2.5. Financials (Based on Availability)
- 11.2.3 Mighty Grass
- 11.2.3.1. Overview
- 11.2.3.2. Products
- 11.2.3.3. SWOT Analysis
- 11.2.3.4. Recent Developments
- 11.2.3.5. Financials (Based on Availability)
- 11.2.4 Xgrass
- 11.2.4.1. Overview
- 11.2.4.2. Products
- 11.2.4.3. SWOT Analysis
- 11.2.4.4. Recent Developments
- 11.2.4.5. Financials (Based on Availability)
- 11.2.5 Synthetic Turf International
- 11.2.5.1. Overview
- 11.2.5.2. Products
- 11.2.5.3. SWOT Analysis
- 11.2.5.4. Recent Developments
- 11.2.5.5. Financials (Based on Availability)
- 11.2.6 SYNLawn Golf
- 11.2.6.1. Overview
- 11.2.6.2. Products
- 11.2.6.3. SWOT Analysis
- 11.2.6.4. Recent Developments
- 11.2.6.5. Financials (Based on Availability)
- 11.2.7 ILKESPORT
- 11.2.7.1. Overview
- 11.2.7.2. Products
- 11.2.7.3. SWOT Analysis
- 11.2.7.4. Recent Developments
- 11.2.7.5. Financials (Based on Availability)
- 11.2.8 SYNLawn
- 11.2.8.1. Overview
- 11.2.8.2. Products
- 11.2.8.3. SWOT Analysis
- 11.2.8.4. Recent Developments
- 11.2.8.5. Financials (Based on Availability)
- 11.2.9 Southwest Greens
- 11.2.9.1. Overview
- 11.2.9.2. Products
- 11.2.9.3. SWOT Analysis
- 11.2.9.4. Recent Developments
- 11.2.9.5. Financials (Based on Availability)
- 11.2.10 Relyir
- 11.2.10.1. Overview
- 11.2.10.2. Products
- 11.2.10.3. SWOT Analysis
- 11.2.10.4. Recent Developments
- 11.2.10.5. Financials (Based on Availability)
- 11.2.11 Ccgrass
- 11.2.11.1. Overview
- 11.2.11.2. Products
- 11.2.11.3. SWOT Analysis
- 11.2.11.4. Recent Developments
- 11.2.11.5. Financials (Based on Availability)
- 11.2.12 Vivaturf
- 11.2.12.1. Overview
- 11.2.12.2. Products
- 11.2.12.3. SWOT Analysis
- 11.2.12.4. Recent Developments
- 11.2.12.5. Financials (Based on Availability)
- 11.2.1 Italgreen
List of Figures
- Figure 1: Global Golf Courses Artificial Turf Revenue Breakdown (undefined, %) by Region 2025 & 2033
- Figure 2: Global Golf Courses Artificial Turf Volume Breakdown (K, %) by Region 2025 & 2033
- Figure 3: North America Golf Courses Artificial Turf Revenue (undefined), by Application 2025 & 2033
- Figure 4: North America Golf Courses Artificial Turf Volume (K), by Application 2025 & 2033
- Figure 5: North America Golf Courses Artificial Turf Revenue Share (%), by Application 2025 & 2033
- Figure 6: North America Golf Courses Artificial Turf Volume Share (%), by Application 2025 & 2033
- Figure 7: North America Golf Courses Artificial Turf Revenue (undefined), by Types 2025 & 2033
- Figure 8: North America Golf Courses Artificial Turf Volume (K), by Types 2025 & 2033
- Figure 9: North America Golf Courses Artificial Turf Revenue Share (%), by Types 2025 & 2033
- Figure 10: North America Golf Courses Artificial Turf Volume Share (%), by Types 2025 & 2033
- Figure 11: North America Golf Courses Artificial Turf Revenue (undefined), by Country 2025 & 2033
- Figure 12: North America Golf Courses Artificial Turf Volume (K), by Country 2025 & 2033
- Figure 13: North America Golf Courses Artificial Turf Revenue Share (%), by Country 2025 & 2033
- Figure 14: North America Golf Courses Artificial Turf Volume Share (%), by Country 2025 & 2033
- Figure 15: South America Golf Courses Artificial Turf Revenue (undefined), by Application 2025 & 2033
- Figure 16: South America Golf Courses Artificial Turf Volume (K), by Application 2025 & 2033
- Figure 17: South America Golf Courses Artificial Turf Revenue Share (%), by Application 2025 & 2033
- Figure 18: South America Golf Courses Artificial Turf Volume Share (%), by Application 2025 & 2033
- Figure 19: South America Golf Courses Artificial Turf Revenue (undefined), by Types 2025 & 2033
- Figure 20: South America Golf Courses Artificial Turf Volume (K), by Types 2025 & 2033
- Figure 21: South America Golf Courses Artificial Turf Revenue Share (%), by Types 2025 & 2033
- Figure 22: South America Golf Courses Artificial Turf Volume Share (%), by Types 2025 & 2033
- Figure 23: South America Golf Courses Artificial Turf Revenue (undefined), by Country 2025 & 2033
- Figure 24: South America Golf Courses Artificial Turf Volume (K), by Country 2025 & 2033
- Figure 25: South America Golf Courses Artificial Turf Revenue Share (%), by Country 2025 & 2033
- Figure 26: South America Golf Courses Artificial Turf Volume Share (%), by Country 2025 & 2033
- Figure 27: Europe Golf Courses Artificial Turf Revenue (undefined), by Application 2025 & 2033
- Figure 28: Europe Golf Courses Artificial Turf Volume (K), by Application 2025 & 2033
- Figure 29: Europe Golf Courses Artificial Turf Revenue Share (%), by Application 2025 & 2033
- Figure 30: Europe Golf Courses Artificial Turf Volume Share (%), by Application 2025 & 2033
- Figure 31: Europe Golf Courses Artificial Turf Revenue (undefined), by Types 2025 & 2033
- Figure 32: Europe Golf Courses Artificial Turf Volume (K), by Types 2025 & 2033
- Figure 33: Europe Golf Courses Artificial Turf Revenue Share (%), by Types 2025 & 2033
- Figure 34: Europe Golf Courses Artificial Turf Volume Share (%), by Types 2025 & 2033
- Figure 35: Europe Golf Courses Artificial Turf Revenue (undefined), by Country 2025 & 2033
- Figure 36: Europe Golf Courses Artificial Turf Volume (K), by Country 2025 & 2033
- Figure 37: Europe Golf Courses Artificial Turf Revenue Share (%), by Country 2025 & 2033
- Figure 38: Europe Golf Courses Artificial Turf Volume Share (%), by Country 2025 & 2033
- Figure 39: Middle East & Africa Golf Courses Artificial Turf Revenue (undefined), by Application 2025 & 2033
- Figure 40: Middle East & Africa Golf Courses Artificial Turf Volume (K), by Application 2025 & 2033
- Figure 41: Middle East & Africa Golf Courses Artificial Turf Revenue Share (%), by Application 2025 & 2033
- Figure 42: Middle East & Africa Golf Courses Artificial Turf Volume Share (%), by Application 2025 & 2033
- Figure 43: Middle East & Africa Golf Courses Artificial Turf Revenue (undefined), by Types 2025 & 2033
- Figure 44: Middle East & Africa Golf Courses Artificial Turf Volume (K), by Types 2025 & 2033
- Figure 45: Middle East & Africa Golf Courses Artificial Turf Revenue Share (%), by Types 2025 & 2033
- Figure 46: Middle East & Africa Golf Courses Artificial Turf Volume Share (%), by Types 2025 & 2033
- Figure 47: Middle East & Africa Golf Courses Artificial Turf Revenue (undefined), by Country 2025 & 2033
- Figure 48: Middle East & Africa Golf Courses Artificial Turf Volume (K), by Country 2025 & 2033
- Figure 49: Middle East & Africa Golf Courses Artificial Turf Revenue Share (%), by Country 2025 & 2033
- Figure 50: Middle East & Africa Golf Courses Artificial Turf Volume Share (%), by Country 2025 & 2033
- Figure 51: Asia Pacific Golf Courses Artificial Turf Revenue (undefined), by Application 2025 & 2033
- Figure 52: Asia Pacific Golf Courses Artificial Turf Volume (K), by Application 2025 & 2033
- Figure 53: Asia Pacific Golf Courses Artificial Turf Revenue Share (%), by Application 2025 & 2033
- Figure 54: Asia Pacific Golf Courses Artificial Turf Volume Share (%), by Application 2025 & 2033
- Figure 55: Asia Pacific Golf Courses Artificial Turf Revenue (undefined), by Types 2025 & 2033
- Figure 56: Asia Pacific Golf Courses Artificial Turf Volume (K), by Types 2025 & 2033
- Figure 57: Asia Pacific Golf Courses Artificial Turf Revenue Share (%), by Types 2025 & 2033
- Figure 58: Asia Pacific Golf Courses Artificial Turf Volume Share (%), by Types 2025 & 2033
- Figure 59: Asia Pacific Golf Courses Artificial Turf Revenue (undefined), by Country 2025 & 2033
- Figure 60: Asia Pacific Golf Courses Artificial Turf Volume (K), by Country 2025 & 2033
- Figure 61: Asia Pacific Golf Courses Artificial Turf Revenue Share (%), by Country 2025 & 2033
- Figure 62: Asia Pacific Golf Courses Artificial Turf Volume Share (%), by Country 2025 & 2033
List of Tables
- Table 1: Global Golf Courses Artificial Turf Revenue undefined Forecast, by Application 2020 & 2033
- Table 2: Global Golf Courses Artificial Turf Volume K Forecast, by Application 2020 & 2033
- Table 3: Global Golf Courses Artificial Turf Revenue undefined Forecast, by Types 2020 & 2033
- Table 4: Global Golf Courses Artificial Turf Volume K Forecast, by Types 2020 & 2033
- Table 5: Global Golf Courses Artificial Turf Revenue undefined Forecast, by Region 2020 & 2033
- Table 6: Global Golf Courses Artificial Turf Volume K Forecast, by Region 2020 & 2033
- Table 7: Global Golf Courses Artificial Turf Revenue undefined Forecast, by Application 2020 & 2033
- Table 8: Global Golf Courses Artificial Turf Volume K Forecast, by Application 2020 & 2033
- Table 9: Global Golf Courses Artificial Turf Revenue undefined Forecast, by Types 2020 & 2033
- Table 10: Global Golf Courses Artificial Turf Volume K Forecast, by Types 2020 & 2033
- Table 11: Global Golf Courses Artificial Turf Revenue undefined Forecast, by Country 2020 & 2033
- Table 12: Global Golf Courses Artificial Turf Volume K Forecast, by Country 2020 & 2033
- Table 13: United States Golf Courses Artificial Turf Revenue (undefined) Forecast, by Application 2020 & 2033
- Table 14: United States Golf Courses Artificial Turf Volume (K) Forecast, by Application 2020 & 2033
- Table 15: Canada Golf Courses Artificial Turf Revenue (undefined) Forecast, by Application 2020 & 2033
- Table 16: Canada Golf Courses Artificial Turf Volume (K) Forecast, by Application 2020 & 2033
- Table 17: Mexico Golf Courses Artificial Turf Revenue (undefined) Forecast, by Application 2020 & 2033
- Table 18: Mexico Golf Courses Artificial Turf Volume (K) Forecast, by Application 2020 & 2033
- Table 19: Global Golf Courses Artificial Turf Revenue undefined Forecast, by Application 2020 & 2033
- Table 20: Global Golf Courses Artificial Turf Volume K Forecast, by Application 2020 & 2033
- Table 21: Global Golf Courses Artificial Turf Revenue undefined Forecast, by Types 2020 & 2033
- Table 22: Global Golf Courses Artificial Turf Volume K Forecast, by Types 2020 & 2033
- Table 23: Global Golf Courses Artificial Turf Revenue undefined Forecast, by Country 2020 & 2033
- Table 24: Global Golf Courses Artificial Turf Volume K Forecast, by Country 2020 & 2033
- Table 25: Brazil Golf Courses Artificial Turf Revenue (undefined) Forecast, by Application 2020 & 2033
- Table 26: Brazil Golf Courses Artificial Turf Volume (K) Forecast, by Application 2020 & 2033
- Table 27: Argentina Golf Courses Artificial Turf Revenue (undefined) Forecast, by Application 2020 & 2033
- Table 28: Argentina Golf Courses Artificial Turf Volume (K) Forecast, by Application 2020 & 2033
- Table 29: Rest of South America Golf Courses Artificial Turf Revenue (undefined) Forecast, by Application 2020 & 2033
- Table 30: Rest of South America Golf Courses Artificial Turf Volume (K) Forecast, by Application 2020 & 2033
- Table 31: Global Golf Courses Artificial Turf Revenue undefined Forecast, by Application 2020 & 2033
- Table 32: Global Golf Courses Artificial Turf Volume K Forecast, by Application 2020 & 2033
- Table 33: Global Golf Courses Artificial Turf Revenue undefined Forecast, by Types 2020 & 2033
- Table 34: Global Golf Courses Artificial Turf Volume K Forecast, by Types 2020 & 2033
- Table 35: Global Golf Courses Artificial Turf Revenue undefined Forecast, by Country 2020 & 2033
- Table 36: Global Golf Courses Artificial Turf Volume K Forecast, by Country 2020 & 2033
- Table 37: United Kingdom Golf Courses Artificial Turf Revenue (undefined) Forecast, by Application 2020 & 2033
- Table 38: United Kingdom Golf Courses Artificial Turf Volume (K) Forecast, by Application 2020 & 2033
- Table 39: Germany Golf Courses Artificial Turf Revenue (undefined) Forecast, by Application 2020 & 2033
- Table 40: Germany Golf Courses Artificial Turf Volume (K) Forecast, by Application 2020 & 2033
- Table 41: France Golf Courses Artificial Turf Revenue (undefined) Forecast, by Application 2020 & 2033
- Table 42: France Golf Courses Artificial Turf Volume (K) Forecast, by Application 2020 & 2033
- Table 43: Italy Golf Courses Artificial Turf Revenue (undefined) Forecast, by Application 2020 & 2033
- Table 44: Italy Golf Courses Artificial Turf Volume (K) Forecast, by Application 2020 & 2033
- Table 45: Spain Golf Courses Artificial Turf Revenue (undefined) Forecast, by Application 2020 & 2033
- Table 46: Spain Golf Courses Artificial Turf Volume (K) Forecast, by Application 2020 & 2033
- Table 47: Russia Golf Courses Artificial Turf Revenue (undefined) Forecast, by Application 2020 & 2033
- Table 48: Russia Golf Courses Artificial Turf Volume (K) Forecast, by Application 2020 & 2033
- Table 49: Benelux Golf Courses Artificial Turf Revenue (undefined) Forecast, by Application 2020 & 2033
- Table 50: Benelux Golf Courses Artificial Turf Volume (K) Forecast, by Application 2020 & 2033
- Table 51: Nordics Golf Courses Artificial Turf Revenue (undefined) Forecast, by Application 2020 & 2033
- Table 52: Nordics Golf Courses Artificial Turf Volume (K) Forecast, by Application 2020 & 2033
- Table 53: Rest of Europe Golf Courses Artificial Turf Revenue (undefined) Forecast, by Application 2020 & 2033
- Table 54: Rest of Europe Golf Courses Artificial Turf Volume (K) Forecast, by Application 2020 & 2033
- Table 55: Global Golf Courses Artificial Turf Revenue undefined Forecast, by Application 2020 & 2033
- Table 56: Global Golf Courses Artificial Turf Volume K Forecast, by Application 2020 & 2033
- Table 57: Global Golf Courses Artificial Turf Revenue undefined Forecast, by Types 2020 & 2033
- Table 58: Global Golf Courses Artificial Turf Volume K Forecast, by Types 2020 & 2033
- Table 59: Global Golf Courses Artificial Turf Revenue undefined Forecast, by Country 2020 & 2033
- Table 60: Global Golf Courses Artificial Turf Volume K Forecast, by Country 2020 & 2033
- Table 61: Turkey Golf Courses Artificial Turf Revenue (undefined) Forecast, by Application 2020 & 2033
- Table 62: Turkey Golf Courses Artificial Turf Volume (K) Forecast, by Application 2020 & 2033
- Table 63: Israel Golf Courses Artificial Turf Revenue (undefined) Forecast, by Application 2020 & 2033
- Table 64: Israel Golf Courses Artificial Turf Volume (K) Forecast, by Application 2020 & 2033
- Table 65: GCC Golf Courses Artificial Turf Revenue (undefined) Forecast, by Application 2020 & 2033
- Table 66: GCC Golf Courses Artificial Turf Volume (K) Forecast, by Application 2020 & 2033
- Table 67: North Africa Golf Courses Artificial Turf Revenue (undefined) Forecast, by Application 2020 & 2033
- Table 68: North Africa Golf Courses Artificial Turf Volume (K) Forecast, by Application 2020 & 2033
- Table 69: South Africa Golf Courses Artificial Turf Revenue (undefined) Forecast, by Application 2020 & 2033
- Table 70: South Africa Golf Courses Artificial Turf Volume (K) Forecast, by Application 2020 & 2033
- Table 71: Rest of Middle East & Africa Golf Courses Artificial Turf Revenue (undefined) Forecast, by Application 2020 & 2033
- Table 72: Rest of Middle East & Africa Golf Courses Artificial Turf Volume (K) Forecast, by Application 2020 & 2033
- Table 73: Global Golf Courses Artificial Turf Revenue undefined Forecast, by Application 2020 & 2033
- Table 74: Global Golf Courses Artificial Turf Volume K Forecast, by Application 2020 & 2033
- Table 75: Global Golf Courses Artificial Turf Revenue undefined Forecast, by Types 2020 & 2033
- Table 76: Global Golf Courses Artificial Turf Volume K Forecast, by Types 2020 & 2033
- Table 77: Global Golf Courses Artificial Turf Revenue undefined Forecast, by Country 2020 & 2033
- Table 78: Global Golf Courses Artificial Turf Volume K Forecast, by Country 2020 & 2033
- Table 79: China Golf Courses Artificial Turf Revenue (undefined) Forecast, by Application 2020 & 2033
- Table 80: China Golf Courses Artificial Turf Volume (K) Forecast, by Application 2020 & 2033
- Table 81: India Golf Courses Artificial Turf Revenue (undefined) Forecast, by Application 2020 & 2033
- Table 82: India Golf Courses Artificial Turf Volume (K) Forecast, by Application 2020 & 2033
- Table 83: Japan Golf Courses Artificial Turf Revenue (undefined) Forecast, by Application 2020 & 2033
- Table 84: Japan Golf Courses Artificial Turf Volume (K) Forecast, by Application 2020 & 2033
- Table 85: South Korea Golf Courses Artificial Turf Revenue (undefined) Forecast, by Application 2020 & 2033
- Table 86: South Korea Golf Courses Artificial Turf Volume (K) Forecast, by Application 2020 & 2033
- Table 87: ASEAN Golf Courses Artificial Turf Revenue (undefined) Forecast, by Application 2020 & 2033
- Table 88: ASEAN Golf Courses Artificial Turf Volume (K) Forecast, by Application 2020 & 2033
- Table 89: Oceania Golf Courses Artificial Turf Revenue (undefined) Forecast, by Application 2020 & 2033
- Table 90: Oceania Golf Courses Artificial Turf Volume (K) Forecast, by Application 2020 & 2033
- Table 91: Rest of Asia Pacific Golf Courses Artificial Turf Revenue (undefined) Forecast, by Application 2020 & 2033
- Table 92: Rest of Asia Pacific Golf Courses Artificial Turf Volume (K) Forecast, by Application 2020 & 2033
Frequently Asked Questions
1. What is the projected Compound Annual Growth Rate (CAGR) of the Golf Courses Artificial Turf?
The projected CAGR is approximately 8.3%.
2. Which companies are prominent players in the Golf Courses Artificial Turf?
Key companies in the market include Italgreen, Integral Artificial Grass, Mighty Grass, Xgrass, Synthetic Turf International, SYNLawn Golf, ILKESPORT, SYNLawn, Southwest Greens, Relyir, Ccgrass, Vivaturf.
3. What are the main segments of the Golf Courses Artificial Turf?
The market segments include Application, Types.
4. Can you provide details about the market size?
The market size is estimated to be USD XXX N/A as of 2022.
5. What are some drivers contributing to market growth?
N/A
6. What are the notable trends driving market growth?
N/A
7. Are there any restraints impacting market growth?
N/A
8. Can you provide examples of recent developments in the market?
N/A
9. What pricing options are available for accessing the report?
Pricing options include single-user, multi-user, and enterprise licenses priced at USD 4350.00, USD 6525.00, and USD 8700.00 respectively.
10. Is the market size provided in terms of value or volume?
The market size is provided in terms of value, measured in N/A and volume, measured in K.
11. Are there any specific market keywords associated with the report?
Yes, the market keyword associated with the report is "Golf Courses Artificial Turf," which aids in identifying and referencing the specific market segment covered.
12. How do I determine which pricing option suits my needs best?
The pricing options vary based on user requirements and access needs. Individual users may opt for single-user licenses, while businesses requiring broader access may choose multi-user or enterprise licenses for cost-effective access to the report.
13. Are there any additional resources or data provided in the Golf Courses Artificial Turf report?
While the report offers comprehensive insights, it's advisable to review the specific contents or supplementary materials provided to ascertain if additional resources or data are available.
14. How can I stay updated on further developments or reports in the Golf Courses Artificial Turf?
To stay informed about further developments, trends, and reports in the Golf Courses Artificial Turf, consider subscribing to industry newsletters, following relevant companies and organizations, or regularly checking reputable industry news sources and publications.
Methodology
Step 1 - Identification of Relevant Samples Size from Population Database


Step 2 - Approaches for Defining Global Market Size (Value, Volume* & Price*)

Note*: In applicable scenarios
Step 3 - Data Sources
Primary Research
- Web Analytics
- Survey Reports
- Research Institute
- Latest Research Reports
- Opinion Leaders
Secondary Research
- Annual Reports
- White Paper
- Latest Press Release
- Industry Association
- Paid Database
- Investor Presentations

Step 4 - Data Triangulation
Involves using different sources of information in order to increase the validity of a study
These sources are likely to be stakeholders in a program - participants, other researchers, program staff, other community members, and so on.
Then we put all data in single framework & apply various statistical tools to find out the dynamic on the market.
During the analysis stage, feedback from the stakeholder groups would be compared to determine areas of agreement as well as areas of divergence