Key Insights
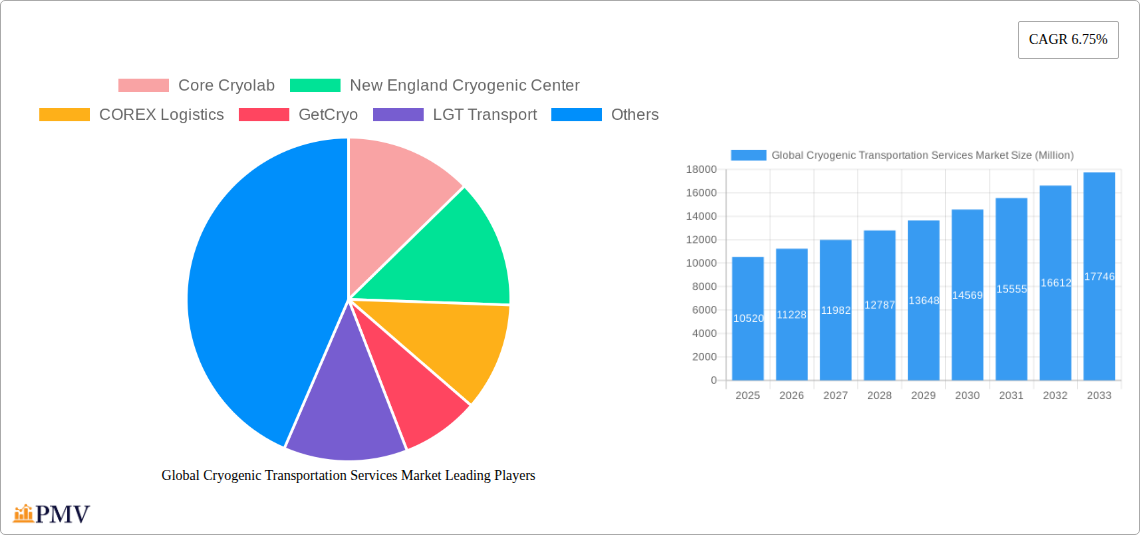
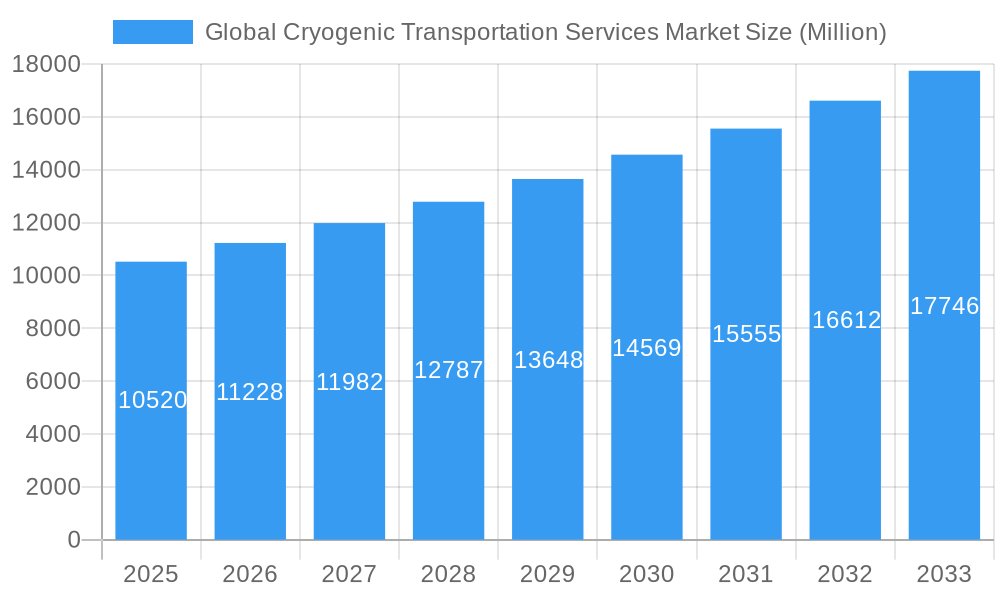
The global cryogenic transportation services market is experiencing robust growth, projected to reach a market size exceeding $10.52 billion in 2025 and exhibiting a Compound Annual Growth Rate (CAGR) of 6.75% from 2025 to 2033. This expansion is driven primarily by the increasing demand for cryogenically transported goods across diverse sectors. The burgeoning pharmaceutical and biotechnology industries, with their reliance on temperature-sensitive products like vaccines, biologics, and pharmaceuticals, are major contributors to this growth. Furthermore, the rising demand for industrial gases in manufacturing and energy sectors fuels the need for efficient and reliable cryogenic transportation solutions. Technological advancements in cryogenic tank design and transportation systems, leading to enhanced safety and reduced logistical challenges, further bolster market expansion. Segment-wise, truck transportation currently holds a larger market share than trailer transportation, though both are experiencing considerable growth. Geographically, North America and Europe are currently leading the market, driven by robust infrastructure and high demand. However, the Asia-Pacific region is anticipated to witness significant growth in the coming years due to its expanding industrial base and growing pharmaceutical sector. While challenges exist in terms of regulatory compliance and the high initial investment costs associated with specialized equipment, the overall market outlook remains positive, indicating substantial growth potential over the forecast period.
Global Cryogenic Transportation Services Market Market Size (In Billion)
The market's segmentation reveals crucial insights into its dynamics. The Chemical and Pharmaceutical sectors are the primary application drivers, indicating a strong dependence on cryogenic transportation for the safe and efficient delivery of sensitive materials. While "Other Applications" represent a significant portion, it is likely this segment includes diverse industries like food processing and aerospace, highlighting the broad applicability of cryogenic transportation. The presence of numerous established players, including Core Cryolab, New England Cryogenic Center, and others, signifies a competitive landscape. However, opportunities exist for innovative companies to leverage technological advancements and expand into underserved regions, particularly within the rapidly developing economies of the Asia-Pacific region. Strategic partnerships between transportation providers and manufacturers of temperature-sensitive goods are anticipated to further enhance the efficiency and reliability of cryogenic logistics, contributing significantly to market growth.
Global Cryogenic Transportation Services Market Company Market Share
Global Cryogenic Transportation Services Market: A Comprehensive Report (2019-2033)
This comprehensive report provides an in-depth analysis of the global cryogenic transportation services market, offering valuable insights for stakeholders across the industry. Covering the period from 2019 to 2033, with a focus on 2025, this study unveils market dynamics, competitive landscapes, and future growth prospects. The report is meticulously structured to provide actionable intelligence, including market sizing, segmentation, key players analysis, and future growth forecasts. The global cryogenic transportation services market is expected to reach xx Million by 2033, exhibiting a CAGR of xx% during the forecast period (2025-2033).
Global Cryogenic Transportation Services Market Market Structure & Competitive Dynamics
The global cryogenic transportation services market exhibits a moderately concentrated structure with several key players vying for market share. The market concentration ratio (CR5) is estimated at xx%, indicating the presence of both large multinational corporations and specialized regional players. Innovation within the ecosystem primarily revolves around enhancing transportation efficiency, improving temperature control precision, and developing sustainable solutions to minimize environmental impact. Regulatory frameworks, particularly concerning safety and environmental compliance, vary across regions, influencing operational costs and market entry barriers. Product substitutes are limited, with cryogenic transportation predominantly being the only viable option for temperature-sensitive goods. End-user trends, driven by growing demand for pharmaceuticals, biological specimens, and industrial gases, are fueling market growth. M&A activities have been relatively modest in recent years, with deal values typically ranging from xx Million to xx Million. Key players have focused on organic growth through service expansion and technological upgrades.
- Market Share: Top 5 players hold approximately xx% of the market share.
- M&A Activity: The average M&A deal value in the last 5 years was approximately xx Million.
- Regulatory Landscape: Stringent regulations regarding the transportation of hazardous materials influence operational costs and market entry barriers.
- Innovation Focus: Improvements in insulation technologies, real-time monitoring systems, and route optimization software are key innovation drivers.
Global Cryogenic Transportation Services Market Industry Trends & Insights
The cryogenic transportation services market is experiencing robust growth, driven by several key factors. The rising demand for temperature-sensitive goods across various sectors, such as pharmaceuticals, healthcare, and industrial gases, significantly contributes to market expansion. Technological advancements, including the development of advanced cryogenic containers and real-time monitoring systems, further enhance efficiency and safety. Consumer preferences are shifting toward reliable, secure, and environmentally friendly transportation solutions, impacting market offerings. Intense competition among market participants drives innovation and fosters price optimization. The market is projected to experience significant growth in the coming years, with a CAGR of xx% from 2025 to 2033. Market penetration is particularly high in developed regions with established healthcare and industrial sectors. Technological disruptions are creating new opportunities for specialized services, such as the use of drones for rapid delivery of cryogenic materials. The increasing focus on sustainability is also influencing the adoption of eco-friendly transportation methods and cryogenic container designs. The market share of specialized logistics providers continues to increase due to their capacity to provide tailored and secure solutions.
Dominant Markets & Segments in Global Cryogenic Transportation Services Market
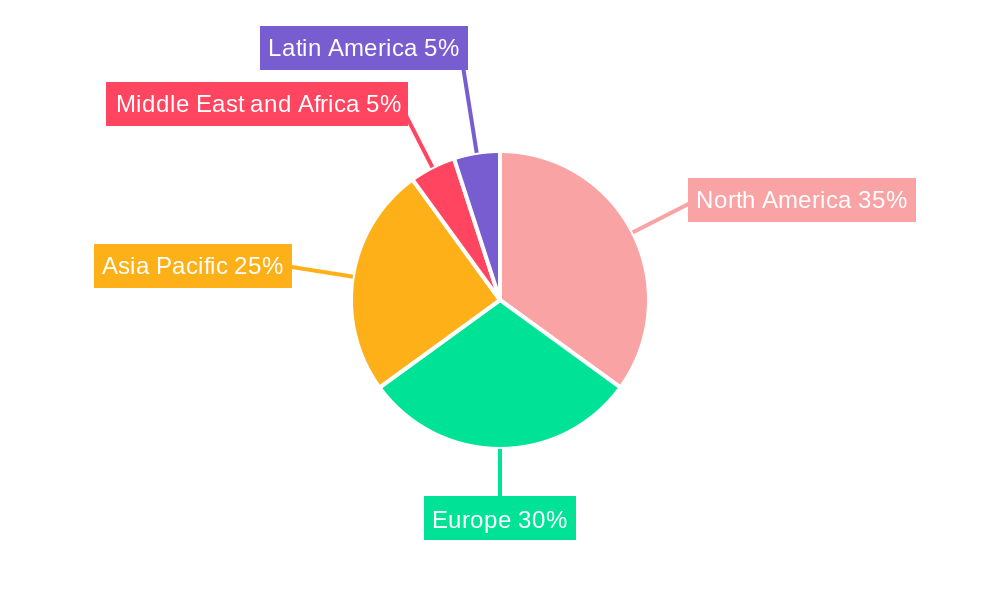
The North American region currently dominates the global cryogenic transportation services market, driven by a robust healthcare sector and substantial demand for industrial gases. Europe follows closely, with significant growth prospects in emerging economies like China and India.
By Type:
- Trailer Transportation: This segment holds the largest market share, benefiting from its high capacity and suitability for long-distance transportation. Key drivers include efficient logistics networks and cost-effectiveness for large shipments.
- Truck Transportation: This segment is experiencing steady growth, favored for its flexibility and suitability for shorter distances and specialized deliveries. Drivers include ease of access to various locations and responsiveness to urgent transportation needs.
By Application:
- Pharmaceuticals & Drugs: This application segment shows significant growth, driven by the increasing demand for temperature-sensitive drugs and vaccines, stringent quality control, and specialized handling requirements. Key drivers include rising healthcare expenditure and the increasing prevalence of chronic diseases.
- Biological Specimens: The biological specimens segment demonstrates steady growth fuelled by the expansion of research and development activities in the life sciences industry, demanding secure and temperature-controlled transportation. Key drivers include advancements in medical research and the rising demand for personalized medicine.
- Industrial Gases: This application segment constitutes a major portion of the market. The expansion of industrial manufacturing processes and increased demand for specialized gases continue to drive substantial growth. Key drivers include growth in manufacturing industries and growing demand for cryogenic fluids.
Global Cryogenic Transportation Services Market Product Innovations
Recent innovations in cryogenic transportation focus on enhancing temperature control precision, real-time monitoring capabilities, and sustainable packaging solutions. The development of advanced insulation materials, improved refrigeration systems, and GPS tracking technologies are key examples. These innovations enhance safety, efficiency, and reduce environmental impact. Furthermore, the integration of IoT sensors and data analytics allows for proactive monitoring and timely interventions, minimizing risks associated with temperature fluctuations.
Report Segmentation & Scope
This report segments the global cryogenic transportation services market by type (Trailer Transportation, Truck Transportation) and by application (Chemicals, Drug, Biological Specimens, Industrial Gases, Other Applications). Each segment’s market size, growth projections, and competitive dynamics are comprehensively analyzed, offering granular insights into market structure and future trends. The forecast period covers 2025-2033. The detailed analysis within each segment helps to identify specific opportunities and challenges that may exist in the market. For example, the Trailer Transportation segment shows strong growth due to its economic scale for bulk transportation. Conversely, the Truck Transportation segment is gaining traction due to the rising need for localized and faster delivery services.
Key Drivers of Global Cryogenic Transportation Services Market Growth
Several factors drive the growth of the cryogenic transportation services market. These include the increasing demand for temperature-sensitive pharmaceuticals and biological products, advancements in cryogenic container technology (improving efficiency and reliability), the expansion of the industrial gas sector, and supportive government regulations promoting safe and efficient transportation of hazardous materials. Moreover, the growing focus on improving the cold chain infrastructure in developing nations is contributing to the market's expansion.
Challenges in the Global Cryogenic Transportation Services Market Sector
The cryogenic transportation services market faces challenges such as stringent regulations and safety standards, requiring significant investments in compliance. Supply chain disruptions and the volatility of fuel prices directly impact operational costs. Furthermore, intense competition among providers puts pressure on pricing and profitability. The need for specialized equipment and skilled personnel adds to operational complexity and increases costs. These challenges present hurdles to market expansion and profitable operations.
Leading Players in the Global Cryogenic Transportation Services Market Market
- Core Cryolab
- New England Cryogenic Center
- COREX Logistics
- GetCryo
- LGT Transport
- Applied Cryo Technologies
- US Cryo Carriers
- McCollister's
- Legacy Cryogenic
- KAG
- Texas Gas Transport
- 7 3 Other Companies
- Hingham Moving
- Champion Moving
Key Developments in Global Cryogenic Transportation Services Market Sector
- October 2023: COREX Logistics joined the Irish Pharmaceutical Health Association, strengthening its presence in the pharmaceutical industry. This strategic move enhances its market position and access to industry insights.
- September 2023: Core Cryolab opened a second state-of-the-art facility, significantly expanding its capacity and enhancing sample safety protocols. This expansion reflects the growing demand for reliable cryogenic storage and transportation services.
Strategic Global Cryogenic Transportation Services Market Market Outlook
The future of the cryogenic transportation services market is bright, with significant growth potential driven by ongoing technological advancements, increasing demand for temperature-sensitive products across various sectors, and the expansion of global trade. Strategic opportunities exist in developing specialized services, expanding into emerging markets, and adopting sustainable and eco-friendly transportation solutions. Companies focusing on innovation, operational efficiency, and regulatory compliance are poised to capture significant market share in the coming years.
Global Cryogenic Transportation Services Market Segmentation
-
1. Type
- 1.1. Trailer Transportation
- 1.2. Truck Transportation
-
2. Application
- 2.1. Chemicals
- 2.2. Drug
- 2.3. Biological Specimens
- 2.4. Industrial Gases
- 2.5. Other Applications
Global Cryogenic Transportation Services Market Segmentation By Geography
-
1. North America
- 1.1. United States
- 1.2. Canada
- 1.3. Mexico
-
2. Europe
- 2.1. Germany
- 2.2. France
- 2.3. Italy
- 2.4. United Kingdom
- 2.5. Spain
- 2.6. Rest of Europe
-
3. Asia Pacific
- 3.1. China
- 3.2. India
- 3.3. Japan
- 3.4. Australia
- 3.5. Singapore
- 3.6. Indonesia
- 3.7. South Korea
- 3.8. Malaysia
- 3.9. Rest of Asia Pacific
-
4. Middle East and Africa
- 4.1. Saudi Arabia
- 4.2. Qatar
- 4.3. Oman
- 4.4. Rest of Middle East and Africa
-
5. Latin America
- 5.1. Brazil
- 5.2. Argentina
- 5.3. Chile
- 5.4. Rest of Latin America
Global Cryogenic Transportation Services Market Regional Market Share
Geographic Coverage of Global Cryogenic Transportation Services Market
Global Cryogenic Transportation Services Market REPORT HIGHLIGHTS
| Aspects | Details |
|---|---|
| Study Period | 2020-2034 |
| Base Year | 2025 |
| Estimated Year | 2026 |
| Forecast Period | 2026-2034 |
| Historical Period | 2020-2025 |
| Growth Rate | CAGR of 6.75% from 2020-2034 |
| Segmentation |
|
Table of Contents
- 1. Introduction
- 1.1. Research Scope
- 1.2. Market Segmentation
- 1.3. Research Objective
- 1.4. Definitions and Assumptions
- 2. Executive Summary
- 2.1. Market Snapshot
- 3. Market Dynamics
- 3.1. Market Drivers
- 3.2. Market Restrains
- 3.3. Market Trends
- 3.4. Market Opportunities
- 4. Market Factor Analysis
- 4.1. Porters Five Forces
- 4.1.1. Bargaining Power of Suppliers
- 4.1.2. Bargaining Power of Buyers
- 4.1.3. Threat of New Entrants
- 4.1.4. Threat of Substitutes
- 4.1.5. Competitive Rivalry
- 4.2. PESTEL analysis
- 4.3. BCG Analysis
- 4.3.1. Stars (High Growth, High Market Share)
- 4.3.2. Cash Cows (Low Growth, High Market Share)
- 4.3.3. Question Mark (High Growth, Low Market Share)
- 4.3.4. Dogs (Low Growth, Low Market Share)
- 4.4. Ansoff Matrix Analysis
- 4.5. Supply Chain Analysis
- 4.6. Regulatory Landscape
- 4.7. Current Market Potential and Opportunity Assessment (TAM–SAM–SOM Framework)
- 4.8. PMV Analyst Note
- 4.1. Porters Five Forces
- 5. Market Analysis, Insights and Forecast 2021-2033
- 5.1. Market Analysis, Insights and Forecast - by Type
- 5.1.1. Trailer Transportation
- 5.1.2. Truck Transportation
- 5.2. Market Analysis, Insights and Forecast - by Application
- 5.2.1. Chemicals
- 5.2.2. Drug
- 5.2.3. Biological Specimens
- 5.2.4. Industrial Gases
- 5.2.5. Other Applications
- 5.3. Market Analysis, Insights and Forecast - by Region
- 5.3.1. North America
- 5.3.2. Europe
- 5.3.3. Asia Pacific
- 5.3.4. Middle East and Africa
- 5.3.5. Latin America
- 5.1. Market Analysis, Insights and Forecast - by Type
- 6. Global Cryogenic Transportation Services Market Analysis, Insights and Forecast, 2021-2033
- 6.1. Market Analysis, Insights and Forecast - by Type
- 6.1.1. Trailer Transportation
- 6.1.2. Truck Transportation
- 6.2. Market Analysis, Insights and Forecast - by Application
- 6.2.1. Chemicals
- 6.2.2. Drug
- 6.2.3. Biological Specimens
- 6.2.4. Industrial Gases
- 6.2.5. Other Applications
- 6.1. Market Analysis, Insights and Forecast - by Type
- 7. North America Global Cryogenic Transportation Services Market Analysis, Insights and Forecast, 2020-2032
- 7.1. Market Analysis, Insights and Forecast - by Type
- 7.1.1. Trailer Transportation
- 7.1.2. Truck Transportation
- 7.2. Market Analysis, Insights and Forecast - by Application
- 7.2.1. Chemicals
- 7.2.2. Drug
- 7.2.3. Biological Specimens
- 7.2.4. Industrial Gases
- 7.2.5. Other Applications
- 7.1. Market Analysis, Insights and Forecast - by Type
- 8. Europe Global Cryogenic Transportation Services Market Analysis, Insights and Forecast, 2020-2032
- 8.1. Market Analysis, Insights and Forecast - by Type
- 8.1.1. Trailer Transportation
- 8.1.2. Truck Transportation
- 8.2. Market Analysis, Insights and Forecast - by Application
- 8.2.1. Chemicals
- 8.2.2. Drug
- 8.2.3. Biological Specimens
- 8.2.4. Industrial Gases
- 8.2.5. Other Applications
- 8.1. Market Analysis, Insights and Forecast - by Type
- 9. Asia Pacific Global Cryogenic Transportation Services Market Analysis, Insights and Forecast, 2020-2032
- 9.1. Market Analysis, Insights and Forecast - by Type
- 9.1.1. Trailer Transportation
- 9.1.2. Truck Transportation
- 9.2. Market Analysis, Insights and Forecast - by Application
- 9.2.1. Chemicals
- 9.2.2. Drug
- 9.2.3. Biological Specimens
- 9.2.4. Industrial Gases
- 9.2.5. Other Applications
- 9.1. Market Analysis, Insights and Forecast - by Type
- 10. Middle East and Africa Global Cryogenic Transportation Services Market Analysis, Insights and Forecast, 2020-2032
- 10.1. Market Analysis, Insights and Forecast - by Type
- 10.1.1. Trailer Transportation
- 10.1.2. Truck Transportation
- 10.2. Market Analysis, Insights and Forecast - by Application
- 10.2.1. Chemicals
- 10.2.2. Drug
- 10.2.3. Biological Specimens
- 10.2.4. Industrial Gases
- 10.2.5. Other Applications
- 10.1. Market Analysis, Insights and Forecast - by Type
- 11. Latin America Global Cryogenic Transportation Services Market Analysis, Insights and Forecast, 2020-2032
- 11.1. Market Analysis, Insights and Forecast - by Type
- 11.1.1. Trailer Transportation
- 11.1.2. Truck Transportation
- 11.2. Market Analysis, Insights and Forecast - by Application
- 11.2.1. Chemicals
- 11.2.2. Drug
- 11.2.3. Biological Specimens
- 11.2.4. Industrial Gases
- 11.2.5. Other Applications
- 11.1. Market Analysis, Insights and Forecast - by Type
- 12. Competitive Analysis
- 12.1. Company Profiles
- 12.1.1 Core Cryolab
- 12.1.1.1. Company Overview
- 12.1.1.2. Products
- 12.1.1.3. Company Financials
- 12.1.1.4. SWOT Analysis
- 12.1.2 New England Cryogenic Center
- 12.1.2.1. Company Overview
- 12.1.2.2. Products
- 12.1.2.3. Company Financials
- 12.1.2.4. SWOT Analysis
- 12.1.3 COREX Logistics
- 12.1.3.1. Company Overview
- 12.1.3.2. Products
- 12.1.3.3. Company Financials
- 12.1.3.4. SWOT Analysis
- 12.1.4 GetCryo
- 12.1.4.1. Company Overview
- 12.1.4.2. Products
- 12.1.4.3. Company Financials
- 12.1.4.4. SWOT Analysis
- 12.1.5 LGT Transport
- 12.1.5.1. Company Overview
- 12.1.5.2. Products
- 12.1.5.3. Company Financials
- 12.1.5.4. SWOT Analysis
- 12.1.6 Applied Cryo Technologies
- 12.1.6.1. Company Overview
- 12.1.6.2. Products
- 12.1.6.3. Company Financials
- 12.1.6.4. SWOT Analysis
- 12.1.7 US Cryo Carriers
- 12.1.7.1. Company Overview
- 12.1.7.2. Products
- 12.1.7.3. Company Financials
- 12.1.7.4. SWOT Analysis
- 12.1.8 McCollister's
- 12.1.8.1. Company Overview
- 12.1.8.2. Products
- 12.1.8.3. Company Financials
- 12.1.8.4. SWOT Analysis
- 12.1.9 Legacy Cryogenic
- 12.1.9.1. Company Overview
- 12.1.9.2. Products
- 12.1.9.3. Company Financials
- 12.1.9.4. SWOT Analysis
- 12.1.10 KAG
- 12.1.10.1. Company Overview
- 12.1.10.2. Products
- 12.1.10.3. Company Financials
- 12.1.10.4. SWOT Analysis
- 12.1.11 Texas Gas Transport*7 3 Other Companie
- 12.1.11.1. Company Overview
- 12.1.11.2. Products
- 12.1.11.3. Company Financials
- 12.1.11.4. SWOT Analysis
- 12.1.12 Hingham Moving
- 12.1.12.1. Company Overview
- 12.1.12.2. Products
- 12.1.12.3. Company Financials
- 12.1.12.4. SWOT Analysis
- 12.1.13 Champion Moving
- 12.1.13.1. Company Overview
- 12.1.13.2. Products
- 12.1.13.3. Company Financials
- 12.1.13.4. SWOT Analysis
- 12.1.1 Core Cryolab
- 12.2. Market Entropy
- 12.2.1 Company's Key Areas Served
- 12.2.2 Recent Developments
- 12.3. Company Market Share Analysis 2025
- 12.3.1 Top 5 Companies Market Share Analysis
- 12.3.2 Top 3 Companies Market Share Analysis
- 12.4. List of Potential Customers
- 13. Research Methodology
List of Figures
- Figure 1: Global Global Cryogenic Transportation Services Market Revenue Breakdown (Million, %) by Region 2025 & 2033
- Figure 2: North America Global Cryogenic Transportation Services Market Revenue (Million), by Type 2025 & 2033
- Figure 3: North America Global Cryogenic Transportation Services Market Revenue Share (%), by Type 2025 & 2033
- Figure 4: North America Global Cryogenic Transportation Services Market Revenue (Million), by Application 2025 & 2033
- Figure 5: North America Global Cryogenic Transportation Services Market Revenue Share (%), by Application 2025 & 2033
- Figure 6: North America Global Cryogenic Transportation Services Market Revenue (Million), by Country 2025 & 2033
- Figure 7: North America Global Cryogenic Transportation Services Market Revenue Share (%), by Country 2025 & 2033
- Figure 8: Europe Global Cryogenic Transportation Services Market Revenue (Million), by Type 2025 & 2033
- Figure 9: Europe Global Cryogenic Transportation Services Market Revenue Share (%), by Type 2025 & 2033
- Figure 10: Europe Global Cryogenic Transportation Services Market Revenue (Million), by Application 2025 & 2033
- Figure 11: Europe Global Cryogenic Transportation Services Market Revenue Share (%), by Application 2025 & 2033
- Figure 12: Europe Global Cryogenic Transportation Services Market Revenue (Million), by Country 2025 & 2033
- Figure 13: Europe Global Cryogenic Transportation Services Market Revenue Share (%), by Country 2025 & 2033
- Figure 14: Asia Pacific Global Cryogenic Transportation Services Market Revenue (Million), by Type 2025 & 2033
- Figure 15: Asia Pacific Global Cryogenic Transportation Services Market Revenue Share (%), by Type 2025 & 2033
- Figure 16: Asia Pacific Global Cryogenic Transportation Services Market Revenue (Million), by Application 2025 & 2033
- Figure 17: Asia Pacific Global Cryogenic Transportation Services Market Revenue Share (%), by Application 2025 & 2033
- Figure 18: Asia Pacific Global Cryogenic Transportation Services Market Revenue (Million), by Country 2025 & 2033
- Figure 19: Asia Pacific Global Cryogenic Transportation Services Market Revenue Share (%), by Country 2025 & 2033
- Figure 20: Middle East and Africa Global Cryogenic Transportation Services Market Revenue (Million), by Type 2025 & 2033
- Figure 21: Middle East and Africa Global Cryogenic Transportation Services Market Revenue Share (%), by Type 2025 & 2033
- Figure 22: Middle East and Africa Global Cryogenic Transportation Services Market Revenue (Million), by Application 2025 & 2033
- Figure 23: Middle East and Africa Global Cryogenic Transportation Services Market Revenue Share (%), by Application 2025 & 2033
- Figure 24: Middle East and Africa Global Cryogenic Transportation Services Market Revenue (Million), by Country 2025 & 2033
- Figure 25: Middle East and Africa Global Cryogenic Transportation Services Market Revenue Share (%), by Country 2025 & 2033
- Figure 26: Latin America Global Cryogenic Transportation Services Market Revenue (Million), by Type 2025 & 2033
- Figure 27: Latin America Global Cryogenic Transportation Services Market Revenue Share (%), by Type 2025 & 2033
- Figure 28: Latin America Global Cryogenic Transportation Services Market Revenue (Million), by Application 2025 & 2033
- Figure 29: Latin America Global Cryogenic Transportation Services Market Revenue Share (%), by Application 2025 & 2033
- Figure 30: Latin America Global Cryogenic Transportation Services Market Revenue (Million), by Country 2025 & 2033
- Figure 31: Latin America Global Cryogenic Transportation Services Market Revenue Share (%), by Country 2025 & 2033
List of Tables
- Table 1: Global Cryogenic Transportation Services Market Revenue Million Forecast, by Type 2020 & 2033
- Table 2: Global Cryogenic Transportation Services Market Revenue Million Forecast, by Application 2020 & 2033
- Table 3: Global Cryogenic Transportation Services Market Revenue Million Forecast, by Region 2020 & 2033
- Table 4: Global Cryogenic Transportation Services Market Revenue Million Forecast, by Type 2020 & 2033
- Table 5: Global Cryogenic Transportation Services Market Revenue Million Forecast, by Application 2020 & 2033
- Table 6: Global Cryogenic Transportation Services Market Revenue Million Forecast, by Country 2020 & 2033
- Table 7: United States Global Cryogenic Transportation Services Market Revenue (Million) Forecast, by Application 2020 & 2033
- Table 8: Canada Global Cryogenic Transportation Services Market Revenue (Million) Forecast, by Application 2020 & 2033
- Table 9: Mexico Global Cryogenic Transportation Services Market Revenue (Million) Forecast, by Application 2020 & 2033
- Table 10: Global Cryogenic Transportation Services Market Revenue Million Forecast, by Type 2020 & 2033
- Table 11: Global Cryogenic Transportation Services Market Revenue Million Forecast, by Application 2020 & 2033
- Table 12: Global Cryogenic Transportation Services Market Revenue Million Forecast, by Country 2020 & 2033
- Table 13: Germany Global Cryogenic Transportation Services Market Revenue (Million) Forecast, by Application 2020 & 2033
- Table 14: France Global Cryogenic Transportation Services Market Revenue (Million) Forecast, by Application 2020 & 2033
- Table 15: Italy Global Cryogenic Transportation Services Market Revenue (Million) Forecast, by Application 2020 & 2033
- Table 16: United Kingdom Global Cryogenic Transportation Services Market Revenue (Million) Forecast, by Application 2020 & 2033
- Table 17: Spain Global Cryogenic Transportation Services Market Revenue (Million) Forecast, by Application 2020 & 2033
- Table 18: Rest of Europe Global Cryogenic Transportation Services Market Revenue (Million) Forecast, by Application 2020 & 2033
- Table 19: Global Cryogenic Transportation Services Market Revenue Million Forecast, by Type 2020 & 2033
- Table 20: Global Cryogenic Transportation Services Market Revenue Million Forecast, by Application 2020 & 2033
- Table 21: Global Cryogenic Transportation Services Market Revenue Million Forecast, by Country 2020 & 2033
- Table 22: China Global Cryogenic Transportation Services Market Revenue (Million) Forecast, by Application 2020 & 2033
- Table 23: India Global Cryogenic Transportation Services Market Revenue (Million) Forecast, by Application 2020 & 2033
- Table 24: Japan Global Cryogenic Transportation Services Market Revenue (Million) Forecast, by Application 2020 & 2033
- Table 25: Australia Global Cryogenic Transportation Services Market Revenue (Million) Forecast, by Application 2020 & 2033
- Table 26: Singapore Global Cryogenic Transportation Services Market Revenue (Million) Forecast, by Application 2020 & 2033
- Table 27: Indonesia Global Cryogenic Transportation Services Market Revenue (Million) Forecast, by Application 2020 & 2033
- Table 28: South Korea Global Cryogenic Transportation Services Market Revenue (Million) Forecast, by Application 2020 & 2033
- Table 29: Malaysia Global Cryogenic Transportation Services Market Revenue (Million) Forecast, by Application 2020 & 2033
- Table 30: Rest of Asia Pacific Global Cryogenic Transportation Services Market Revenue (Million) Forecast, by Application 2020 & 2033
- Table 31: Global Cryogenic Transportation Services Market Revenue Million Forecast, by Type 2020 & 2033
- Table 32: Global Cryogenic Transportation Services Market Revenue Million Forecast, by Application 2020 & 2033
- Table 33: Global Cryogenic Transportation Services Market Revenue Million Forecast, by Country 2020 & 2033
- Table 34: Saudi Arabia Global Cryogenic Transportation Services Market Revenue (Million) Forecast, by Application 2020 & 2033
- Table 35: Qatar Global Cryogenic Transportation Services Market Revenue (Million) Forecast, by Application 2020 & 2033
- Table 36: Oman Global Cryogenic Transportation Services Market Revenue (Million) Forecast, by Application 2020 & 2033
- Table 37: Rest of Middle East and Africa Global Cryogenic Transportation Services Market Revenue (Million) Forecast, by Application 2020 & 2033
- Table 38: Global Cryogenic Transportation Services Market Revenue Million Forecast, by Type 2020 & 2033
- Table 39: Global Cryogenic Transportation Services Market Revenue Million Forecast, by Application 2020 & 2033
- Table 40: Global Cryogenic Transportation Services Market Revenue Million Forecast, by Country 2020 & 2033
- Table 41: Brazil Global Cryogenic Transportation Services Market Revenue (Million) Forecast, by Application 2020 & 2033
- Table 42: Argentina Global Cryogenic Transportation Services Market Revenue (Million) Forecast, by Application 2020 & 2033
- Table 43: Chile Global Cryogenic Transportation Services Market Revenue (Million) Forecast, by Application 2020 & 2033
- Table 44: Rest of Latin America Global Cryogenic Transportation Services Market Revenue (Million) Forecast, by Application 2020 & 2033
Frequently Asked Questions
1. What is the projected Compound Annual Growth Rate (CAGR) of the Global Cryogenic Transportation Services Market?
The projected CAGR is approximately 6.75%.
2. Which companies are prominent players in the Global Cryogenic Transportation Services Market?
Key companies in the market include Core Cryolab, New England Cryogenic Center, COREX Logistics, GetCryo, LGT Transport, Applied Cryo Technologies, US Cryo Carriers, McCollister's, Legacy Cryogenic, KAG, Texas Gas Transport*7 3 Other Companie, Hingham Moving, Champion Moving.
3. What are the main segments of the Global Cryogenic Transportation Services Market?
The market segments include Type, Application.
4. Can you provide details about the market size?
The market size is estimated to be USD 10.52 Million as of 2022.
5. What are some drivers contributing to market growth?
Growth of Life Sciences and Healthcare; Expanding Food and Beverage Industry; Growing Focus on Renewable Energy.
6. What are the notable trends driving market growth?
North America Dominates the Global Market Share in the Coming Years.
7. Are there any restraints impacting market growth?
High Initial Investment Costs; Skilled Workforce Shortage; Infrastructure.
8. Can you provide examples of recent developments in the market?
October 2023: COREX Logistics has officially become a member of the Irish Pharmaceutical Health Association, joining industry giants such as Bayer, GlaxoSmithKline, and Eli Lilly in representing the international research-based pharmaceutical industry in Ireland. The members take an active part in strategy development and implementation, helping to shape policy and public debate across areas such as regulation, access, pricing, and health promotion.
9. What pricing options are available for accessing the report?
Pricing options include single-user, multi-user, and enterprise licenses priced at USD 4750, USD 5250, and USD 8750 respectively.
10. Is the market size provided in terms of value or volume?
The market size is provided in terms of value, measured in Million.
11. Are there any specific market keywords associated with the report?
Yes, the market keyword associated with the report is "Global Cryogenic Transportation Services Market," which aids in identifying and referencing the specific market segment covered.
12. How do I determine which pricing option suits my needs best?
The pricing options vary based on user requirements and access needs. Individual users may opt for single-user licenses, while businesses requiring broader access may choose multi-user or enterprise licenses for cost-effective access to the report.
13. Are there any additional resources or data provided in the Global Cryogenic Transportation Services Market report?
While the report offers comprehensive insights, it's advisable to review the specific contents or supplementary materials provided to ascertain if additional resources or data are available.
14. How can I stay updated on further developments or reports in the Global Cryogenic Transportation Services Market?
To stay informed about further developments, trends, and reports in the Global Cryogenic Transportation Services Market, consider subscribing to industry newsletters, following relevant companies and organizations, or regularly checking reputable industry news sources and publications.
Methodology
Step 1 - Identification of Relevant Samples Size from Population Database


Step 2 - Approaches for Defining Global Market Size (Value, Volume* & Price*)

Note*: In applicable scenarios
Step 3 - Data Sources
Primary Research
- Web Analytics
- Survey Reports
- Research Institute
- Latest Research Reports
- Opinion Leaders
Secondary Research
- Annual Reports
- White Paper
- Latest Press Release
- Industry Association
- Paid Database
- Investor Presentations

Step 4 - Data Triangulation
Involves using different sources of information in order to increase the validity of a study
These sources are likely to be stakeholders in a program - participants, other researchers, program staff, other community members, and so on.
Then we put all data in single framework & apply various statistical tools to find out the dynamic on the market.
During the analysis stage, feedback from the stakeholder groups would be compared to determine areas of agreement as well as areas of divergence

