

Key Insights
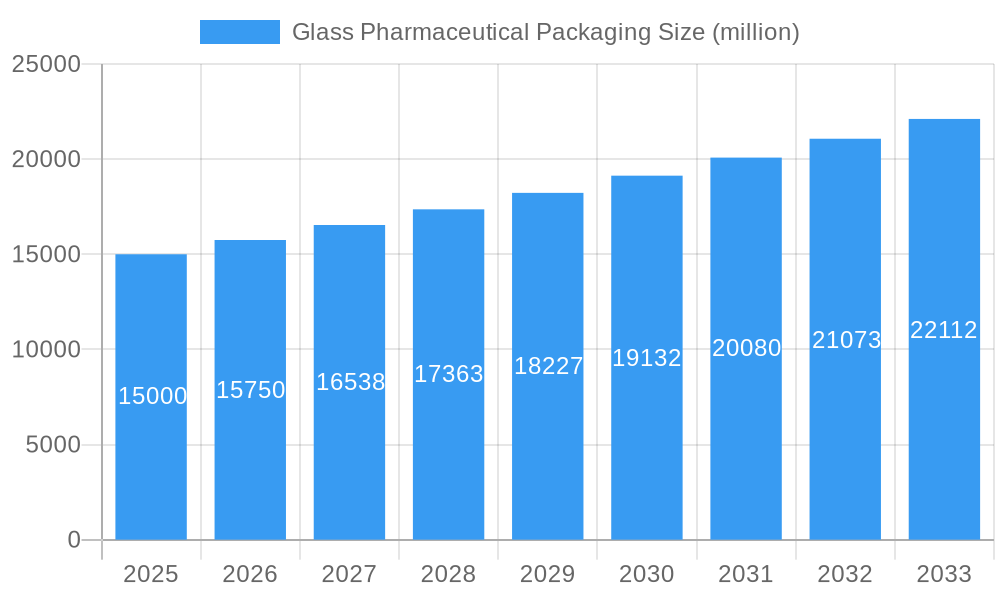
The global glass pharmaceutical packaging market is experiencing robust growth, driven by the increasing demand for injectable drugs and the inherent advantages of glass in preserving drug integrity and sterility. The market's value, estimated at $15 billion in 2025, is projected to exhibit a Compound Annual Growth Rate (CAGR) of 5% from 2025 to 2033, reaching approximately $23 billion by 2033. This growth is fueled by several key factors: the rising prevalence of chronic diseases necessitating increased medication use, the growing preference for parenteral drug administration (injections), and stringent regulatory requirements emphasizing product safety and efficacy. Furthermore, advancements in glass manufacturing technologies, leading to lighter, stronger, and more cost-effective packaging solutions, contribute significantly to market expansion. Key players such as Amcor, Ball Corp., and Gerresheimer are investing heavily in R&D and strategic partnerships to maintain their competitive edge.
Glass Pharmaceutical Packaging Market Size (In Billion)
However, the market also faces certain challenges. Fluctuating raw material prices, particularly for silica sand, can impact profitability. Additionally, the emergence of alternative packaging materials like plastics (though with inherent limitations regarding chemical inertness and barrier properties), presents ongoing competition. Nevertheless, the inherent advantages of glass—its inertness, recyclability, and suitability for high-value pharmaceuticals—are expected to sustain its dominance in the pharmaceutical packaging sector. The market is segmented by product type (vials, ampoules, bottles, cartridges), application (injectable drugs, oral liquids), and region. North America and Europe currently hold significant market shares, but emerging economies in Asia-Pacific are anticipated to show considerable growth potential in the coming years due to rising healthcare spending and pharmaceutical production.
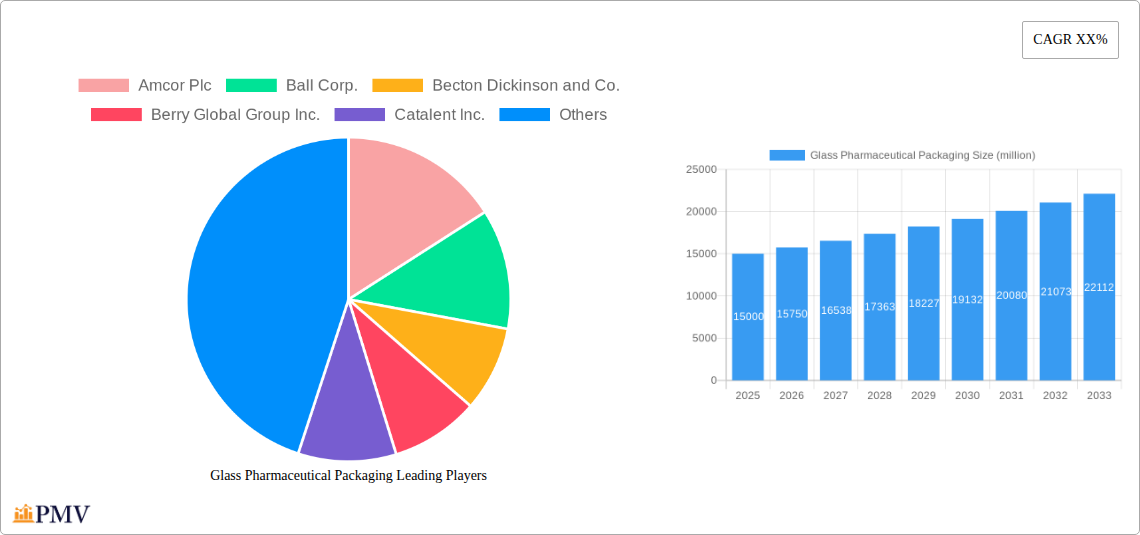
Glass Pharmaceutical Packaging Company Market Share
Glass Pharmaceutical Packaging Market Report: 2019-2033
This comprehensive report provides a detailed analysis of the global glass pharmaceutical packaging market, offering invaluable insights for industry stakeholders, investors, and researchers. Covering the period 2019-2033, with a base year of 2025 and forecast period of 2025-2033, this report analyzes market trends, competitive dynamics, and future growth potential. The market is expected to reach USD xx million by 2033, exhibiting a CAGR of xx% during the forecast period.
Glass Pharmaceutical Packaging Market Structure & Competitive Dynamics
The global glass pharmaceutical packaging market is moderately concentrated, with key players such as Amcor Plc, Ball Corp., Becton Dickinson and Co., Berry Global Group Inc., Catalent Inc., Gerresheimer AG, O-I Glass Inc., SCHOTT AG, West Pharmaceutical Services Inc., and WestRock Co. holding significant market share. Market concentration is assessed through metrics like the Herfindahl-Hirschman Index (HHI), revealing the level of competition and potential for consolidation. Innovation ecosystems are analyzed, highlighting collaborations between packaging manufacturers, pharmaceutical companies, and research institutions. Regulatory frameworks impacting the industry, including safety standards and environmental regulations, are comprehensively reviewed. The report also examines the impact of substitute packaging materials (e.g., plastic) and evolving end-user preferences on market dynamics. Analysis of recent mergers and acquisitions (M&A) activities, including deal values (e.g., USD xx million transactions) and their strategic implications for market share, is included.
- Market Share: Amcor Plc holds an estimated xx% market share in 2025, followed by Ball Corp. at xx% and Becton Dickinson and Co. at xx%.
- M&A Activity: The report details xx major M&A transactions during the historical period, totaling approximately USD xx million in value, impacting market consolidation and competitive landscapes.
- Regulatory Landscape: Stringent regulations regarding material safety and environmental impact drive innovation and influence market strategies.
- Substitute Packaging: The increasing use of alternative packaging materials like plastic presents a challenge to glass packaging dominance, requiring continuous innovation.
Glass Pharmaceutical Packaging Industry Trends & Insights
The glass pharmaceutical packaging market is experiencing robust growth, driven by factors such as increasing pharmaceutical production, rising demand for injectable drugs, and growing preference for environmentally sustainable packaging solutions. Technological advancements, including improved barrier properties and enhanced functionalities in glass vials and ampoules, are transforming the industry. Consumer preference for tamper-evident and child-resistant packaging is also impacting the market. Competitive dynamics are shaped by pricing strategies, product differentiation, and capacity expansion among leading players. The report analyzes the market’s CAGR (Compound Annual Growth Rate) during the historical and forecast periods and provides detailed insights into market penetration across various regions and segments.
- Market Growth Drivers: Rising pharmaceutical production, particularly biologics and injectables, contributes significantly to market expansion. The growing demand for sterile and tamper-proof packaging further fuels this trend.
- Technological Disruptions: Advancements in glass manufacturing techniques and the incorporation of smart packaging technologies are changing market dynamics and improving efficiency.
- Consumer Preferences: Growing awareness of environmental sustainability pushes manufacturers to adopt eco-friendly glass production and packaging designs. The increasing demand for tamper-evident closures enhances market growth.
- Competitive Dynamics: Pricing strategies, product innovation, and capacity expansion play significant roles in shaping the competitive landscape.
Dominant Markets & Segments in Glass Pharmaceutical Packaging
The North American region is identified as the dominant market for glass pharmaceutical packaging, driven by the robust pharmaceutical industry and high healthcare expenditure. Key drivers in this region include favorable economic conditions, well-established healthcare infrastructure, and stringent regulatory frameworks promoting pharmaceutical innovation and quality. The report also analyzes the performance of key countries like the United States and Canada within this region. European markets also play a significant role, propelled by high demand for pharmaceutical products and government regulations.
- Key Drivers of North American Dominance:
- Strong pharmaceutical industry and high healthcare expenditure.
- Advanced healthcare infrastructure and regulatory support for quality.
- High disposable income levels and consumer preference for premium products.
- European Market Dynamics:
- High demand for pharmaceutical products and stringent regulatory environments.
- Focus on sustainable packaging solutions and eco-friendly manufacturing practices.
Glass Pharmaceutical Packaging Product Innovations
Recent innovations focus on enhancing the barrier properties of glass packaging to prevent degradation of sensitive pharmaceutical products and improve drug efficacy. New designs incorporate features like integrated sensors and smart labels for enhanced product traceability and security. These developments aim to meet the increasing demand for high-quality, safe, and efficient pharmaceutical packaging solutions. The incorporation of advanced materials and manufacturing techniques enables manufacturers to produce lighter, stronger, and more sustainable glass packaging.
Report Segmentation & Scope
The report segments the glass pharmaceutical packaging market based on product type (vials, ampoules, bottles, cartridges, and others), material type (Type I, Type II, and Type III borosilicate glass), application (injectables, injectables, lyophilized drugs, and others), and end-user (pharmaceutical manufacturers, hospitals, and clinics). Growth projections, market size estimations (in USD million), and competitive dynamics are analyzed for each segment. Market sizes are provided for each segment for the historical, base, and forecast periods.
Key Drivers of Glass Pharmaceutical Packaging Growth
The growth of the glass pharmaceutical packaging market is primarily fueled by increasing demand for injectable drugs, rising awareness regarding drug stability, and stringent regulatory requirements for packaging safety and sterility. Technological advancements in glass manufacturing techniques and the growing adoption of smart packaging solutions further drive market expansion. Economic growth in emerging markets is increasing the demand for pharmaceutical products, thereby stimulating the growth of the glass packaging market.
Challenges in the Glass Pharmaceutical Packaging Sector
The glass pharmaceutical packaging sector faces challenges including rising raw material costs, stringent regulations impacting manufacturing processes, and the increasing adoption of substitute packaging materials like plastic. Supply chain disruptions and fluctuations in global energy prices can also impact production costs and profitability. Competition from alternative packaging solutions and environmental concerns related to glass manufacturing remain significant hurdles.
Leading Players in the Glass Pharmaceutical Packaging Market
Key Developments in Glass Pharmaceutical Packaging Sector
- January 2023: Amcor Plc launched a new range of sustainable glass vials.
- March 2022: Ball Corp. invested USD xx million in expanding its glass manufacturing facility.
- June 2021: Gerresheimer AG acquired a smaller glass packaging company for USD xx million. (Further details on acquisitions and investments throughout the historical period are included in the full report.)
Strategic Glass Pharmaceutical Packaging Market Outlook
The glass pharmaceutical packaging market is poised for significant growth in the coming years, driven by several factors, including the continuous rise in the demand for pharmaceuticals, particularly injectables and biologics. The increasing adoption of advanced packaging technologies, combined with ongoing innovation in glass manufacturing processes, will further contribute to the market's expansion. Strategic opportunities exist in developing sustainable and eco-friendly packaging solutions that meet the growing demand for environmentally responsible products. Companies focused on innovation and sustainability are best positioned to capture significant market share in the long term.
Glass Pharmaceutical Packaging Segmentation
-
1. Application
- 1.1. Medicine
- 1.2. Nutraceuticals
- 1.3. Others
-
2. Types
- 2.1. Bottles
- 2.2. Ampoules
- 2.3. Others
Glass Pharmaceutical Packaging Segmentation By Geography
-
1. North America
- 1.1. United States
- 1.2. Canada
- 1.3. Mexico
-
2. South America
- 2.1. Brazil
- 2.2. Argentina
- 2.3. Rest of South America
-
3. Europe
- 3.1. United Kingdom
- 3.2. Germany
- 3.3. France
- 3.4. Italy
- 3.5. Spain
- 3.6. Russia
- 3.7. Benelux
- 3.8. Nordics
- 3.9. Rest of Europe
-
4. Middle East & Africa
- 4.1. Turkey
- 4.2. Israel
- 4.3. GCC
- 4.4. North Africa
- 4.5. South Africa
- 4.6. Rest of Middle East & Africa
-
5. Asia Pacific
- 5.1. China
- 5.2. India
- 5.3. Japan
- 5.4. South Korea
- 5.5. ASEAN
- 5.6. Oceania
- 5.7. Rest of Asia Pacific

Glass Pharmaceutical Packaging Regional Market Share
Geographic Coverage of Glass Pharmaceutical Packaging
Glass Pharmaceutical Packaging REPORT HIGHLIGHTS
| Aspects | Details |
|---|---|
| Study Period | 2020-2034 |
| Base Year | 2025 |
| Estimated Year | 2026 |
| Forecast Period | 2026-2034 |
| Historical Period | 2020-2025 |
| Growth Rate | CAGR of 8.8% from 2020-2034 |
| Segmentation |
|
Table of Contents
- 1. Introduction
- 1.1. Research Scope
- 1.2. Market Segmentation
- 1.3. Research Methodology
- 1.4. Definitions and Assumptions
- 2. Executive Summary
- 2.1. Introduction
- 3. Market Dynamics
- 3.1. Introduction
- 3.2. Market Drivers
- 3.3. Market Restrains
- 3.4. Market Trends
- 4. Market Factor Analysis
- 4.1. Porters Five Forces
- 4.2. Supply/Value Chain
- 4.3. PESTEL analysis
- 4.4. Market Entropy
- 4.5. Patent/Trademark Analysis
- 5. Global Glass Pharmaceutical Packaging Analysis, Insights and Forecast, 2020-2032
- 5.1. Market Analysis, Insights and Forecast - by Application
- 5.1.1. Medicine
- 5.1.2. Nutraceuticals
- 5.1.3. Others
- 5.2. Market Analysis, Insights and Forecast - by Types
- 5.2.1. Bottles
- 5.2.2. Ampoules
- 5.2.3. Others
- 5.3. Market Analysis, Insights and Forecast - by Region
- 5.3.1. North America
- 5.3.2. South America
- 5.3.3. Europe
- 5.3.4. Middle East & Africa
- 5.3.5. Asia Pacific
- 5.1. Market Analysis, Insights and Forecast - by Application
- 6. North America Glass Pharmaceutical Packaging Analysis, Insights and Forecast, 2020-2032
- 6.1. Market Analysis, Insights and Forecast - by Application
- 6.1.1. Medicine
- 6.1.2. Nutraceuticals
- 6.1.3. Others
- 6.2. Market Analysis, Insights and Forecast - by Types
- 6.2.1. Bottles
- 6.2.2. Ampoules
- 6.2.3. Others
- 6.1. Market Analysis, Insights and Forecast - by Application
- 7. South America Glass Pharmaceutical Packaging Analysis, Insights and Forecast, 2020-2032
- 7.1. Market Analysis, Insights and Forecast - by Application
- 7.1.1. Medicine
- 7.1.2. Nutraceuticals
- 7.1.3. Others
- 7.2. Market Analysis, Insights and Forecast - by Types
- 7.2.1. Bottles
- 7.2.2. Ampoules
- 7.2.3. Others
- 7.1. Market Analysis, Insights and Forecast - by Application
- 8. Europe Glass Pharmaceutical Packaging Analysis, Insights and Forecast, 2020-2032
- 8.1. Market Analysis, Insights and Forecast - by Application
- 8.1.1. Medicine
- 8.1.2. Nutraceuticals
- 8.1.3. Others
- 8.2. Market Analysis, Insights and Forecast - by Types
- 8.2.1. Bottles
- 8.2.2. Ampoules
- 8.2.3. Others
- 8.1. Market Analysis, Insights and Forecast - by Application
- 9. Middle East & Africa Glass Pharmaceutical Packaging Analysis, Insights and Forecast, 2020-2032
- 9.1. Market Analysis, Insights and Forecast - by Application
- 9.1.1. Medicine
- 9.1.2. Nutraceuticals
- 9.1.3. Others
- 9.2. Market Analysis, Insights and Forecast - by Types
- 9.2.1. Bottles
- 9.2.2. Ampoules
- 9.2.3. Others
- 9.1. Market Analysis, Insights and Forecast - by Application
- 10. Asia Pacific Glass Pharmaceutical Packaging Analysis, Insights and Forecast, 2020-2032
- 10.1. Market Analysis, Insights and Forecast - by Application
- 10.1.1. Medicine
- 10.1.2. Nutraceuticals
- 10.1.3. Others
- 10.2. Market Analysis, Insights and Forecast - by Types
- 10.2.1. Bottles
- 10.2.2. Ampoules
- 10.2.3. Others
- 10.1. Market Analysis, Insights and Forecast - by Application
- 11. Competitive Analysis
- 11.1. Global Market Share Analysis 2025
- 11.2. Company Profiles
- 11.2.1 Amcor PIc
- 11.2.1.1. Overview
- 11.2.1.2. Products
- 11.2.1.3. SWOT Analysis
- 11.2.1.4. Recent Developments
- 11.2.1.5. Financials (Based on Availability)
- 11.2.2 Ball Corp.
- 11.2.2.1. Overview
- 11.2.2.2. Products
- 11.2.2.3. SWOT Analysis
- 11.2.2.4. Recent Developments
- 11.2.2.5. Financials (Based on Availability)
- 11.2.3 Becton Dickinson and Co.
- 11.2.3.1. Overview
- 11.2.3.2. Products
- 11.2.3.3. SWOT Analysis
- 11.2.3.4. Recent Developments
- 11.2.3.5. Financials (Based on Availability)
- 11.2.4 Berry Global Group Inc.
- 11.2.4.1. Overview
- 11.2.4.2. Products
- 11.2.4.3. SWOT Analysis
- 11.2.4.4. Recent Developments
- 11.2.4.5. Financials (Based on Availability)
- 11.2.5 Catalent Inc.
- 11.2.5.1. Overview
- 11.2.5.2. Products
- 11.2.5.3. SWOT Analysis
- 11.2.5.4. Recent Developments
- 11.2.5.5. Financials (Based on Availability)
- 11.2.6 Gerresheimer AG
- 11.2.6.1. Overview
- 11.2.6.2. Products
- 11.2.6.3. SWOT Analysis
- 11.2.6.4. Recent Developments
- 11.2.6.5. Financials (Based on Availability)
- 11.2.7 O-I Glass Inc.SCHOTTAG
- 11.2.7.1. Overview
- 11.2.7.2. Products
- 11.2.7.3. SWOT Analysis
- 11.2.7.4. Recent Developments
- 11.2.7.5. Financials (Based on Availability)
- 11.2.8 West Pharmaceutical Services Inc.
- 11.2.8.1. Overview
- 11.2.8.2. Products
- 11.2.8.3. SWOT Analysis
- 11.2.8.4. Recent Developments
- 11.2.8.5. Financials (Based on Availability)
- 11.2.9 WestRock Co.
- 11.2.9.1. Overview
- 11.2.9.2. Products
- 11.2.9.3. SWOT Analysis
- 11.2.9.4. Recent Developments
- 11.2.9.5. Financials (Based on Availability)
- 11.2.1 Amcor PIc
List of Figures
- Figure 1: Global Glass Pharmaceutical Packaging Revenue Breakdown (undefined, %) by Region 2025 & 2033
- Figure 2: Global Glass Pharmaceutical Packaging Volume Breakdown (K, %) by Region 2025 & 2033
- Figure 3: North America Glass Pharmaceutical Packaging Revenue (undefined), by Application 2025 & 2033
- Figure 4: North America Glass Pharmaceutical Packaging Volume (K), by Application 2025 & 2033
- Figure 5: North America Glass Pharmaceutical Packaging Revenue Share (%), by Application 2025 & 2033
- Figure 6: North America Glass Pharmaceutical Packaging Volume Share (%), by Application 2025 & 2033
- Figure 7: North America Glass Pharmaceutical Packaging Revenue (undefined), by Types 2025 & 2033
- Figure 8: North America Glass Pharmaceutical Packaging Volume (K), by Types 2025 & 2033
- Figure 9: North America Glass Pharmaceutical Packaging Revenue Share (%), by Types 2025 & 2033
- Figure 10: North America Glass Pharmaceutical Packaging Volume Share (%), by Types 2025 & 2033
- Figure 11: North America Glass Pharmaceutical Packaging Revenue (undefined), by Country 2025 & 2033
- Figure 12: North America Glass Pharmaceutical Packaging Volume (K), by Country 2025 & 2033
- Figure 13: North America Glass Pharmaceutical Packaging Revenue Share (%), by Country 2025 & 2033
- Figure 14: North America Glass Pharmaceutical Packaging Volume Share (%), by Country 2025 & 2033
- Figure 15: South America Glass Pharmaceutical Packaging Revenue (undefined), by Application 2025 & 2033
- Figure 16: South America Glass Pharmaceutical Packaging Volume (K), by Application 2025 & 2033
- Figure 17: South America Glass Pharmaceutical Packaging Revenue Share (%), by Application 2025 & 2033
- Figure 18: South America Glass Pharmaceutical Packaging Volume Share (%), by Application 2025 & 2033
- Figure 19: South America Glass Pharmaceutical Packaging Revenue (undefined), by Types 2025 & 2033
- Figure 20: South America Glass Pharmaceutical Packaging Volume (K), by Types 2025 & 2033
- Figure 21: South America Glass Pharmaceutical Packaging Revenue Share (%), by Types 2025 & 2033
- Figure 22: South America Glass Pharmaceutical Packaging Volume Share (%), by Types 2025 & 2033
- Figure 23: South America Glass Pharmaceutical Packaging Revenue (undefined), by Country 2025 & 2033
- Figure 24: South America Glass Pharmaceutical Packaging Volume (K), by Country 2025 & 2033
- Figure 25: South America Glass Pharmaceutical Packaging Revenue Share (%), by Country 2025 & 2033
- Figure 26: South America Glass Pharmaceutical Packaging Volume Share (%), by Country 2025 & 2033
- Figure 27: Europe Glass Pharmaceutical Packaging Revenue (undefined), by Application 2025 & 2033
- Figure 28: Europe Glass Pharmaceutical Packaging Volume (K), by Application 2025 & 2033
- Figure 29: Europe Glass Pharmaceutical Packaging Revenue Share (%), by Application 2025 & 2033
- Figure 30: Europe Glass Pharmaceutical Packaging Volume Share (%), by Application 2025 & 2033
- Figure 31: Europe Glass Pharmaceutical Packaging Revenue (undefined), by Types 2025 & 2033
- Figure 32: Europe Glass Pharmaceutical Packaging Volume (K), by Types 2025 & 2033
- Figure 33: Europe Glass Pharmaceutical Packaging Revenue Share (%), by Types 2025 & 2033
- Figure 34: Europe Glass Pharmaceutical Packaging Volume Share (%), by Types 2025 & 2033
- Figure 35: Europe Glass Pharmaceutical Packaging Revenue (undefined), by Country 2025 & 2033
- Figure 36: Europe Glass Pharmaceutical Packaging Volume (K), by Country 2025 & 2033
- Figure 37: Europe Glass Pharmaceutical Packaging Revenue Share (%), by Country 2025 & 2033
- Figure 38: Europe Glass Pharmaceutical Packaging Volume Share (%), by Country 2025 & 2033
- Figure 39: Middle East & Africa Glass Pharmaceutical Packaging Revenue (undefined), by Application 2025 & 2033
- Figure 40: Middle East & Africa Glass Pharmaceutical Packaging Volume (K), by Application 2025 & 2033
- Figure 41: Middle East & Africa Glass Pharmaceutical Packaging Revenue Share (%), by Application 2025 & 2033
- Figure 42: Middle East & Africa Glass Pharmaceutical Packaging Volume Share (%), by Application 2025 & 2033
- Figure 43: Middle East & Africa Glass Pharmaceutical Packaging Revenue (undefined), by Types 2025 & 2033
- Figure 44: Middle East & Africa Glass Pharmaceutical Packaging Volume (K), by Types 2025 & 2033
- Figure 45: Middle East & Africa Glass Pharmaceutical Packaging Revenue Share (%), by Types 2025 & 2033
- Figure 46: Middle East & Africa Glass Pharmaceutical Packaging Volume Share (%), by Types 2025 & 2033
- Figure 47: Middle East & Africa Glass Pharmaceutical Packaging Revenue (undefined), by Country 2025 & 2033
- Figure 48: Middle East & Africa Glass Pharmaceutical Packaging Volume (K), by Country 2025 & 2033
- Figure 49: Middle East & Africa Glass Pharmaceutical Packaging Revenue Share (%), by Country 2025 & 2033
- Figure 50: Middle East & Africa Glass Pharmaceutical Packaging Volume Share (%), by Country 2025 & 2033
- Figure 51: Asia Pacific Glass Pharmaceutical Packaging Revenue (undefined), by Application 2025 & 2033
- Figure 52: Asia Pacific Glass Pharmaceutical Packaging Volume (K), by Application 2025 & 2033
- Figure 53: Asia Pacific Glass Pharmaceutical Packaging Revenue Share (%), by Application 2025 & 2033
- Figure 54: Asia Pacific Glass Pharmaceutical Packaging Volume Share (%), by Application 2025 & 2033
- Figure 55: Asia Pacific Glass Pharmaceutical Packaging Revenue (undefined), by Types 2025 & 2033
- Figure 56: Asia Pacific Glass Pharmaceutical Packaging Volume (K), by Types 2025 & 2033
- Figure 57: Asia Pacific Glass Pharmaceutical Packaging Revenue Share (%), by Types 2025 & 2033
- Figure 58: Asia Pacific Glass Pharmaceutical Packaging Volume Share (%), by Types 2025 & 2033
- Figure 59: Asia Pacific Glass Pharmaceutical Packaging Revenue (undefined), by Country 2025 & 2033
- Figure 60: Asia Pacific Glass Pharmaceutical Packaging Volume (K), by Country 2025 & 2033
- Figure 61: Asia Pacific Glass Pharmaceutical Packaging Revenue Share (%), by Country 2025 & 2033
- Figure 62: Asia Pacific Glass Pharmaceutical Packaging Volume Share (%), by Country 2025 & 2033
List of Tables
- Table 1: Global Glass Pharmaceutical Packaging Revenue undefined Forecast, by Application 2020 & 2033
- Table 2: Global Glass Pharmaceutical Packaging Volume K Forecast, by Application 2020 & 2033
- Table 3: Global Glass Pharmaceutical Packaging Revenue undefined Forecast, by Types 2020 & 2033
- Table 4: Global Glass Pharmaceutical Packaging Volume K Forecast, by Types 2020 & 2033
- Table 5: Global Glass Pharmaceutical Packaging Revenue undefined Forecast, by Region 2020 & 2033
- Table 6: Global Glass Pharmaceutical Packaging Volume K Forecast, by Region 2020 & 2033
- Table 7: Global Glass Pharmaceutical Packaging Revenue undefined Forecast, by Application 2020 & 2033
- Table 8: Global Glass Pharmaceutical Packaging Volume K Forecast, by Application 2020 & 2033
- Table 9: Global Glass Pharmaceutical Packaging Revenue undefined Forecast, by Types 2020 & 2033
- Table 10: Global Glass Pharmaceutical Packaging Volume K Forecast, by Types 2020 & 2033
- Table 11: Global Glass Pharmaceutical Packaging Revenue undefined Forecast, by Country 2020 & 2033
- Table 12: Global Glass Pharmaceutical Packaging Volume K Forecast, by Country 2020 & 2033
- Table 13: United States Glass Pharmaceutical Packaging Revenue (undefined) Forecast, by Application 2020 & 2033
- Table 14: United States Glass Pharmaceutical Packaging Volume (K) Forecast, by Application 2020 & 2033
- Table 15: Canada Glass Pharmaceutical Packaging Revenue (undefined) Forecast, by Application 2020 & 2033
- Table 16: Canada Glass Pharmaceutical Packaging Volume (K) Forecast, by Application 2020 & 2033
- Table 17: Mexico Glass Pharmaceutical Packaging Revenue (undefined) Forecast, by Application 2020 & 2033
- Table 18: Mexico Glass Pharmaceutical Packaging Volume (K) Forecast, by Application 2020 & 2033
- Table 19: Global Glass Pharmaceutical Packaging Revenue undefined Forecast, by Application 2020 & 2033
- Table 20: Global Glass Pharmaceutical Packaging Volume K Forecast, by Application 2020 & 2033
- Table 21: Global Glass Pharmaceutical Packaging Revenue undefined Forecast, by Types 2020 & 2033
- Table 22: Global Glass Pharmaceutical Packaging Volume K Forecast, by Types 2020 & 2033
- Table 23: Global Glass Pharmaceutical Packaging Revenue undefined Forecast, by Country 2020 & 2033
- Table 24: Global Glass Pharmaceutical Packaging Volume K Forecast, by Country 2020 & 2033
- Table 25: Brazil Glass Pharmaceutical Packaging Revenue (undefined) Forecast, by Application 2020 & 2033
- Table 26: Brazil Glass Pharmaceutical Packaging Volume (K) Forecast, by Application 2020 & 2033
- Table 27: Argentina Glass Pharmaceutical Packaging Revenue (undefined) Forecast, by Application 2020 & 2033
- Table 28: Argentina Glass Pharmaceutical Packaging Volume (K) Forecast, by Application 2020 & 2033
- Table 29: Rest of South America Glass Pharmaceutical Packaging Revenue (undefined) Forecast, by Application 2020 & 2033
- Table 30: Rest of South America Glass Pharmaceutical Packaging Volume (K) Forecast, by Application 2020 & 2033
- Table 31: Global Glass Pharmaceutical Packaging Revenue undefined Forecast, by Application 2020 & 2033
- Table 32: Global Glass Pharmaceutical Packaging Volume K Forecast, by Application 2020 & 2033
- Table 33: Global Glass Pharmaceutical Packaging Revenue undefined Forecast, by Types 2020 & 2033
- Table 34: Global Glass Pharmaceutical Packaging Volume K Forecast, by Types 2020 & 2033
- Table 35: Global Glass Pharmaceutical Packaging Revenue undefined Forecast, by Country 2020 & 2033
- Table 36: Global Glass Pharmaceutical Packaging Volume K Forecast, by Country 2020 & 2033
- Table 37: United Kingdom Glass Pharmaceutical Packaging Revenue (undefined) Forecast, by Application 2020 & 2033
- Table 38: United Kingdom Glass Pharmaceutical Packaging Volume (K) Forecast, by Application 2020 & 2033
- Table 39: Germany Glass Pharmaceutical Packaging Revenue (undefined) Forecast, by Application 2020 & 2033
- Table 40: Germany Glass Pharmaceutical Packaging Volume (K) Forecast, by Application 2020 & 2033
- Table 41: France Glass Pharmaceutical Packaging Revenue (undefined) Forecast, by Application 2020 & 2033
- Table 42: France Glass Pharmaceutical Packaging Volume (K) Forecast, by Application 2020 & 2033
- Table 43: Italy Glass Pharmaceutical Packaging Revenue (undefined) Forecast, by Application 2020 & 2033
- Table 44: Italy Glass Pharmaceutical Packaging Volume (K) Forecast, by Application 2020 & 2033
- Table 45: Spain Glass Pharmaceutical Packaging Revenue (undefined) Forecast, by Application 2020 & 2033
- Table 46: Spain Glass Pharmaceutical Packaging Volume (K) Forecast, by Application 2020 & 2033
- Table 47: Russia Glass Pharmaceutical Packaging Revenue (undefined) Forecast, by Application 2020 & 2033
- Table 48: Russia Glass Pharmaceutical Packaging Volume (K) Forecast, by Application 2020 & 2033
- Table 49: Benelux Glass Pharmaceutical Packaging Revenue (undefined) Forecast, by Application 2020 & 2033
- Table 50: Benelux Glass Pharmaceutical Packaging Volume (K) Forecast, by Application 2020 & 2033
- Table 51: Nordics Glass Pharmaceutical Packaging Revenue (undefined) Forecast, by Application 2020 & 2033
- Table 52: Nordics Glass Pharmaceutical Packaging Volume (K) Forecast, by Application 2020 & 2033
- Table 53: Rest of Europe Glass Pharmaceutical Packaging Revenue (undefined) Forecast, by Application 2020 & 2033
- Table 54: Rest of Europe Glass Pharmaceutical Packaging Volume (K) Forecast, by Application 2020 & 2033
- Table 55: Global Glass Pharmaceutical Packaging Revenue undefined Forecast, by Application 2020 & 2033
- Table 56: Global Glass Pharmaceutical Packaging Volume K Forecast, by Application 2020 & 2033
- Table 57: Global Glass Pharmaceutical Packaging Revenue undefined Forecast, by Types 2020 & 2033
- Table 58: Global Glass Pharmaceutical Packaging Volume K Forecast, by Types 2020 & 2033
- Table 59: Global Glass Pharmaceutical Packaging Revenue undefined Forecast, by Country 2020 & 2033
- Table 60: Global Glass Pharmaceutical Packaging Volume K Forecast, by Country 2020 & 2033
- Table 61: Turkey Glass Pharmaceutical Packaging Revenue (undefined) Forecast, by Application 2020 & 2033
- Table 62: Turkey Glass Pharmaceutical Packaging Volume (K) Forecast, by Application 2020 & 2033
- Table 63: Israel Glass Pharmaceutical Packaging Revenue (undefined) Forecast, by Application 2020 & 2033
- Table 64: Israel Glass Pharmaceutical Packaging Volume (K) Forecast, by Application 2020 & 2033
- Table 65: GCC Glass Pharmaceutical Packaging Revenue (undefined) Forecast, by Application 2020 & 2033
- Table 66: GCC Glass Pharmaceutical Packaging Volume (K) Forecast, by Application 2020 & 2033
- Table 67: North Africa Glass Pharmaceutical Packaging Revenue (undefined) Forecast, by Application 2020 & 2033
- Table 68: North Africa Glass Pharmaceutical Packaging Volume (K) Forecast, by Application 2020 & 2033
- Table 69: South Africa Glass Pharmaceutical Packaging Revenue (undefined) Forecast, by Application 2020 & 2033
- Table 70: South Africa Glass Pharmaceutical Packaging Volume (K) Forecast, by Application 2020 & 2033
- Table 71: Rest of Middle East & Africa Glass Pharmaceutical Packaging Revenue (undefined) Forecast, by Application 2020 & 2033
- Table 72: Rest of Middle East & Africa Glass Pharmaceutical Packaging Volume (K) Forecast, by Application 2020 & 2033
- Table 73: Global Glass Pharmaceutical Packaging Revenue undefined Forecast, by Application 2020 & 2033
- Table 74: Global Glass Pharmaceutical Packaging Volume K Forecast, by Application 2020 & 2033
- Table 75: Global Glass Pharmaceutical Packaging Revenue undefined Forecast, by Types 2020 & 2033
- Table 76: Global Glass Pharmaceutical Packaging Volume K Forecast, by Types 2020 & 2033
- Table 77: Global Glass Pharmaceutical Packaging Revenue undefined Forecast, by Country 2020 & 2033
- Table 78: Global Glass Pharmaceutical Packaging Volume K Forecast, by Country 2020 & 2033
- Table 79: China Glass Pharmaceutical Packaging Revenue (undefined) Forecast, by Application 2020 & 2033
- Table 80: China Glass Pharmaceutical Packaging Volume (K) Forecast, by Application 2020 & 2033
- Table 81: India Glass Pharmaceutical Packaging Revenue (undefined) Forecast, by Application 2020 & 2033
- Table 82: India Glass Pharmaceutical Packaging Volume (K) Forecast, by Application 2020 & 2033
- Table 83: Japan Glass Pharmaceutical Packaging Revenue (undefined) Forecast, by Application 2020 & 2033
- Table 84: Japan Glass Pharmaceutical Packaging Volume (K) Forecast, by Application 2020 & 2033
- Table 85: South Korea Glass Pharmaceutical Packaging Revenue (undefined) Forecast, by Application 2020 & 2033
- Table 86: South Korea Glass Pharmaceutical Packaging Volume (K) Forecast, by Application 2020 & 2033
- Table 87: ASEAN Glass Pharmaceutical Packaging Revenue (undefined) Forecast, by Application 2020 & 2033
- Table 88: ASEAN Glass Pharmaceutical Packaging Volume (K) Forecast, by Application 2020 & 2033
- Table 89: Oceania Glass Pharmaceutical Packaging Revenue (undefined) Forecast, by Application 2020 & 2033
- Table 90: Oceania Glass Pharmaceutical Packaging Volume (K) Forecast, by Application 2020 & 2033
- Table 91: Rest of Asia Pacific Glass Pharmaceutical Packaging Revenue (undefined) Forecast, by Application 2020 & 2033
- Table 92: Rest of Asia Pacific Glass Pharmaceutical Packaging Volume (K) Forecast, by Application 2020 & 2033
Frequently Asked Questions
1. What is the projected Compound Annual Growth Rate (CAGR) of the Glass Pharmaceutical Packaging?
The projected CAGR is approximately 8.8%.
2. Which companies are prominent players in the Glass Pharmaceutical Packaging?
Key companies in the market include Amcor PIc, Ball Corp., Becton Dickinson and Co., Berry Global Group Inc., Catalent Inc., Gerresheimer AG, O-I Glass Inc.SCHOTTAG, West Pharmaceutical Services Inc., WestRock Co..
3. What are the main segments of the Glass Pharmaceutical Packaging?
The market segments include Application, Types.
4. Can you provide details about the market size?
The market size is estimated to be USD XXX N/A as of 2022.
5. What are some drivers contributing to market growth?
N/A
6. What are the notable trends driving market growth?
N/A
7. Are there any restraints impacting market growth?
N/A
8. Can you provide examples of recent developments in the market?
N/A
9. What pricing options are available for accessing the report?
Pricing options include single-user, multi-user, and enterprise licenses priced at USD 3950.00, USD 5925.00, and USD 7900.00 respectively.
10. Is the market size provided in terms of value or volume?
The market size is provided in terms of value, measured in N/A and volume, measured in K.
11. Are there any specific market keywords associated with the report?
Yes, the market keyword associated with the report is "Glass Pharmaceutical Packaging," which aids in identifying and referencing the specific market segment covered.
12. How do I determine which pricing option suits my needs best?
The pricing options vary based on user requirements and access needs. Individual users may opt for single-user licenses, while businesses requiring broader access may choose multi-user or enterprise licenses for cost-effective access to the report.
13. Are there any additional resources or data provided in the Glass Pharmaceutical Packaging report?
While the report offers comprehensive insights, it's advisable to review the specific contents or supplementary materials provided to ascertain if additional resources or data are available.
14. How can I stay updated on further developments or reports in the Glass Pharmaceutical Packaging?
To stay informed about further developments, trends, and reports in the Glass Pharmaceutical Packaging, consider subscribing to industry newsletters, following relevant companies and organizations, or regularly checking reputable industry news sources and publications.
Methodology
Step 1 - Identification of Relevant Samples Size from Population Database


Step 2 - Approaches for Defining Global Market Size (Value, Volume* & Price*)

Note*: In applicable scenarios
Step 3 - Data Sources
Primary Research
- Web Analytics
- Survey Reports
- Research Institute
- Latest Research Reports
- Opinion Leaders
Secondary Research
- Annual Reports
- White Paper
- Latest Press Release
- Industry Association
- Paid Database
- Investor Presentations

Step 4 - Data Triangulation
Involves using different sources of information in order to increase the validity of a study
These sources are likely to be stakeholders in a program - participants, other researchers, program staff, other community members, and so on.
Then we put all data in single framework & apply various statistical tools to find out the dynamic on the market.
During the analysis stage, feedback from the stakeholder groups would be compared to determine areas of agreement as well as areas of divergence