
Key Insights
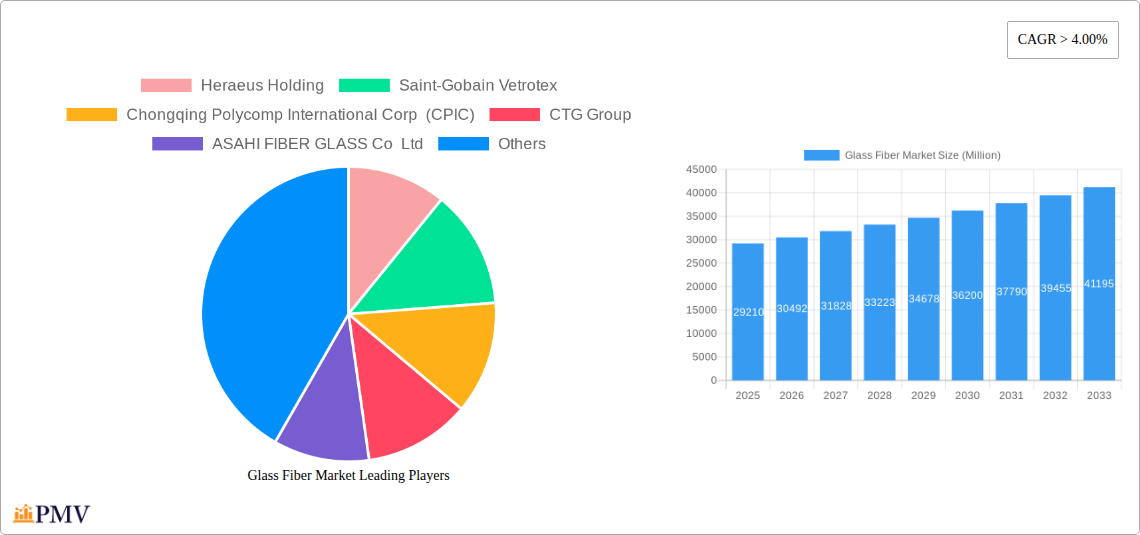
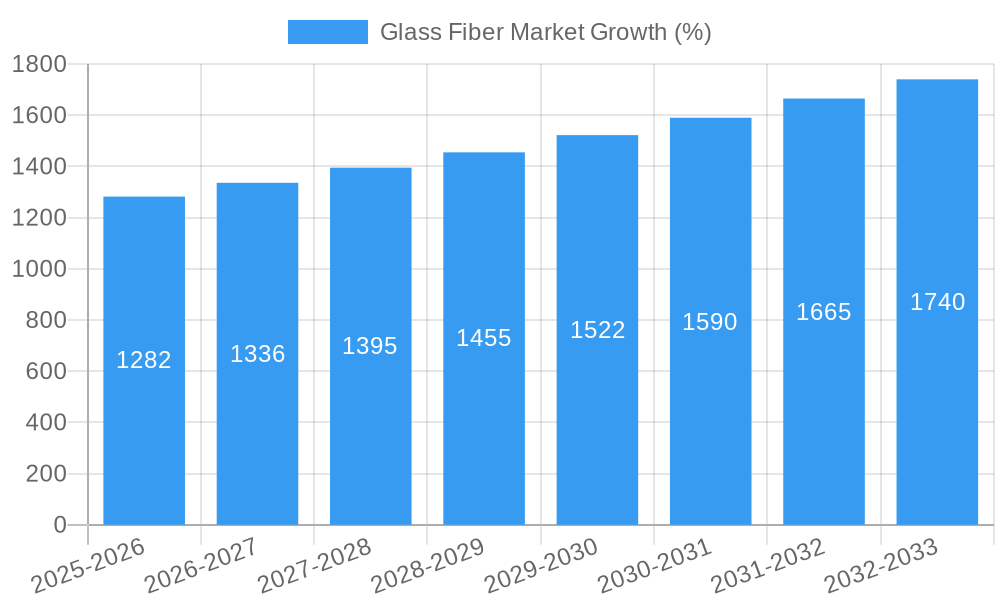
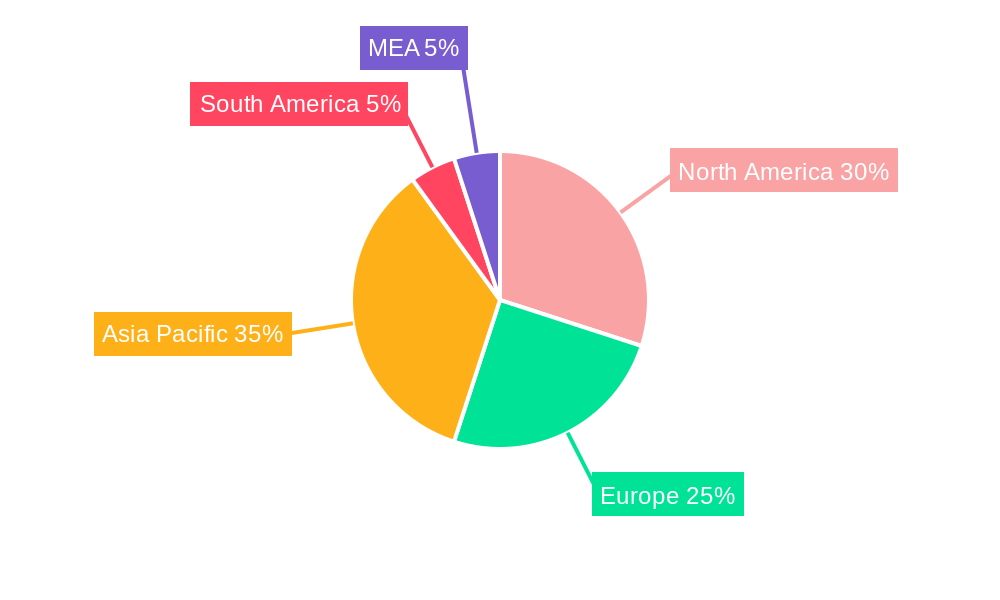
The global glass fiber market, valued at $29.21 billion in 2025, is projected to experience robust growth, exhibiting a Compound Annual Growth Rate (CAGR) exceeding 4.00% from 2025 to 2033. This expansion is driven by the increasing demand for lightweight and high-strength materials in various industries, particularly automotive, construction, and wind energy. The automotive sector's push for fuel-efficient vehicles fuels significant demand for glass fiber reinforced polymers (GFRP) in body panels and components. Simultaneously, the construction industry's adoption of glass fiber-reinforced concrete and insulation materials contributes substantially to market growth. Furthermore, the burgeoning renewable energy sector, specifically wind turbine blade manufacturing, relies heavily on glass fiber's unique properties, creating another powerful driver. Growth is segmented across resin types (chopped strands, glass wool, roving, yarn) and applications (composites, insulation), reflecting diverse end-user needs. While challenges such as fluctuating raw material prices and environmental concerns related to manufacturing processes exist, technological advancements in fiber production and improved recycling methods are mitigating these restraints. Key players like Saint-Gobain Vetrotex, Owens Corning, and Jushi Group are strategically investing in capacity expansion and innovative product development to capitalize on this expanding market. Regional analysis indicates strong growth in Asia-Pacific, driven by rapid industrialization and infrastructure development in countries like China and India, while North America and Europe maintain significant market share due to established manufacturing bases and strong demand from mature industries.
The market's future trajectory hinges on several factors. Continued innovation in material science could lead to lighter, stronger, and more cost-effective glass fibers, further expanding applications. Government regulations promoting sustainable building materials and renewable energy infrastructure will also positively impact market growth. Conversely, economic downturns and potential supply chain disruptions could temporarily curb expansion. However, the long-term outlook remains positive, given the inherent advantages of glass fiber in numerous applications and its growing importance in addressing global sustainability goals. Competitive landscape analysis reveals a mix of large multinational corporations and regional players, leading to both intense competition and opportunities for collaboration and technological advancements.
Glass Fiber Market: A Comprehensive Report (2019-2033)
This comprehensive report provides a detailed analysis of the global glass fiber market, encompassing historical data (2019-2024), current estimations (2025), and future projections (2025-2033). It delves into market structure, competitive dynamics, industry trends, dominant segments, product innovations, and key players, offering invaluable insights for stakeholders across the value chain. With a focus on crucial market segments like chopped strands, glass wool, roving, and yarn, and key end-user industries such as building & construction, automotive, and aerospace & defense, this report is an essential resource for strategic decision-making. The report's analysis is supported by data, market sizing, and growth projections in Million, offering a clear and actionable understanding of this dynamic market.
Glass Fiber Market Market Structure & Competitive Dynamics
The global glass fiber market exhibits a moderately concentrated structure, with several key players holding significant market share. However, the presence of numerous smaller, regional players contributes to a competitive landscape characterized by both consolidation and fragmentation. Innovation ecosystems are active, driven by ongoing R&D efforts focused on improving fiber properties, expanding applications, and enhancing sustainability. Regulatory frameworks vary across regions, impacting production costs and market access. Substitute materials, such as carbon fiber and basalt fiber, present challenges, but glass fiber's cost-effectiveness and versatility maintain its dominance in numerous applications. End-user trends toward lightweighting in automotive and aerospace, and sustainable building materials in construction, significantly influence market demand. M&A activities have been observed, with deal values ranging from xx Million to xx Million in recent years, primarily focused on expanding production capacity, gaining access to new technologies, and achieving geographical diversification. Key players such as Owens Corning and China Jushi have played prominent roles in such activities. Market share analysis reveals that the top 5 players hold approximately xx% of the global market, with Owens Corning and Saint-Gobain Vetrotex holding a relatively larger portion.
Glass Fiber Market Industry Trends & Insights
The glass fiber market is witnessing robust growth, driven by several key factors. The construction industry's expansion, particularly in developing economies, fuels demand for insulation and reinforcement materials. Technological advancements are leading to lighter, stronger, and more versatile glass fibers, enabling penetration into new applications. Consumer preferences are shifting toward sustainable and energy-efficient products, aligning with the growing adoption of glass fiber in green building initiatives and renewable energy infrastructure. However, fluctuations in raw material prices (like silica sand and soda ash) and energy costs pose challenges to profitability. The increasing use of glass fiber in the automotive and aerospace industries for lightweighting and improved performance is a major driver. The Compound Annual Growth Rate (CAGR) for the glass fiber market is projected to be xx% during the forecast period (2025-2033), with market penetration expected to reach xx% in key segments by 2033. Competitive dynamics remain intense, with established players focusing on innovation and capacity expansion while new entrants seek to carve out market niches through specialized product offerings and regional focus.
Dominant Markets & Segments in Glass Fiber Market
The building and construction sector is the dominant end-user industry for glass fiber, accounting for approximately xx% of global consumption. Within resin types, chopped strands hold the largest market share, followed by glass wool. Geographically, Asia-Pacific, particularly China, represents the largest regional market, fueled by robust infrastructure development and industrialization.
- Key Drivers for Building & Construction: Government initiatives promoting sustainable building practices, rising disposable incomes, and urbanization.
- Key Drivers for Automotive: Lightweighting demands for improved fuel efficiency, increasing adoption of hybrid and electric vehicles.
- Key Drivers for Asia-Pacific: Rapid economic growth, substantial infrastructure investment, and increasing industrial output.
Dominance analysis reveals that China's strong economic growth and large-scale construction projects significantly contribute to its leading position. However, other regions, such as North America and Europe, are also witnessing substantial growth, driven by renewable energy projects and advancements in automotive and aerospace applications. The dominance of chopped strands is attributed to their cost-effectiveness and suitability for a wide range of applications.
Glass Fiber Market Product Innovations
Recent innovations focus on developing glass fibers with enhanced properties, such as higher tensile strength, improved durability, and enhanced thermal resistance. New applications are continuously being explored, including advanced composites for aerospace and defense, high-performance insulation for buildings, and lightweight components for automotive. Companies are investing in new production technologies to improve efficiency, reduce costs, and enhance sustainability. These innovations contribute to glass fiber’s competitive advantage over substitute materials by offering superior performance and cost-effectiveness.
Report Segmentation & Scope
This report segments the glass fiber market across several parameters:
- Resin Type: Chopped strands, glass wool, roving, yarn (Growth projections and market sizes are provided for each segment)
- Application: Composites, insulation (Growth projections and market sizes are provided for each segment)
- End-user Industry: Buildings and construction, automotive, aerospace and defense, alternative energy, consumer goods, industrial, other end-user industries (electronics) (Growth projections and market sizes are provided for each segment)
Each segment's competitive landscape is analyzed, providing insights into market share, key players, and growth strategies.
Key Drivers of Glass Fiber Market Growth
Several factors fuel the growth of the glass fiber market:
- Construction Boom: Global infrastructure development and urbanization drive demand for insulation and reinforcement materials.
- Automotive Lightweighting: Demand for fuel-efficient vehicles necessitates the use of lightweight materials.
- Renewable Energy: Growing adoption of wind energy and solar power creates demand for glass fiber in turbine blades and solar panels.
- Technological Advancements: Continuous improvements in fiber properties and manufacturing processes expand application possibilities.
Challenges in the Glass Fiber Market Sector
The glass fiber market faces challenges, including:
- Raw Material Price Volatility: Fluctuations in silica sand and soda ash prices impact production costs and profitability.
- Energy Costs: High energy consumption in manufacturing contributes to operational expenses.
- Environmental Regulations: Stringent environmental regulations necessitate investments in emission control technologies.
- Competition from Substitutes: Materials like carbon fiber and basalt fiber present competition in specific high-performance applications. These challenges impact market growth by limiting expansion and profitability.
Leading Players in the Glass Fiber Market Market
- Heraeus Holding
- Saint-Gobain Vetrotex
- Chongqing Polycomp International Corp (CPIC)
- CTG Group
- ASAHI FIBER GLASS Co Ltd
- TAIWAN GLASS IND CORP
- Owens Corning
- China Jushi Co Ltd
- PFG FIBER GLASS CORPORATION
- Binani Industries Ltd
- Johns Manville
- Nippon Electric Glass Co Ltd
Key Developments in Glass Fiber Market Sector
- October 2023: Ahlstrom launched a new glass fiber tissue line for high-performance building materials, reflecting the market's shift toward sustainable solutions.
- August 2022: Owens Corning and Pultron Composites collaborated to produce fiberglass rebar, expanding applications in construction.
- February 2022: China Jushi Co. Ltd. expanded its manufacturing capacity in Egypt, demonstrating growth in the region.
Strategic Glass Fiber Market Market Outlook
The glass fiber market holds significant future potential, driven by continuous innovation, expanding applications, and the growing demand for sustainable materials. Strategic opportunities lie in developing high-performance fibers for niche applications, optimizing production processes for cost reduction and enhanced sustainability, and exploring new markets in developing economies. Focusing on collaborative ventures and strategic partnerships will be crucial for navigating the competitive landscape and capitalizing on emerging growth opportunities. The market's positive outlook is supported by the sustained growth across key end-user sectors and the ongoing technological advancements that enhance the versatility and performance of glass fiber.
Glass Fiber Market Segmentation
-
1. Resin Type
- 1.1. Chopped Strands
- 1.2. Glass Wool
- 1.3. Roving
- 1.4. Yarn
-
2. Application
- 2.1. Composites
- 2.2. Insulation
-
3. End-user Industry
- 3.1. Buildings and Construction
- 3.2. Automotive
- 3.3. Aerospace and Defense
- 3.4. Alternative Energy
- 3.5. Consumer Goods
- 3.6. Industrial
- 3.7. Other End-user Industries (Electronics)
Glass Fiber Market Segmentation By Geography
-
1. Asia Pacific
- 1.1. China
- 1.2. India
- 1.3. Japan
- 1.4. South Korea
- 1.5. Malaysia
- 1.6. Thailand
- 1.7. Indonesia
- 1.8. Vietnam
- 1.9. Rest of Asia Pacific
-
2. North America
- 2.1. United States
- 2.2. Canada
- 2.3. Mexico
-
3. Europe
- 3.1. Germany
- 3.2. France
- 3.3. United Kingdom
- 3.4. Italy
- 3.5. Spain
- 3.6. Turkey
- 3.7. Russia
- 3.8. NORDIC
- 3.9. Rest of Europe
-
4. South America
- 4.1. Brazil
- 4.2. Argentina
- 4.3. Colombia
- 4.4. Rest of South America
-
5. Middle East and Africa
- 5.1. Saudi Arabia
- 5.2. South Africa
- 5.3. Nigeria
- 5.4. Qatar
- 5.5. Egypt
- 5.6. UAE
- 5.7. Rest of Middle East and Africa
Glass Fiber Market REPORT HIGHLIGHTS
| Aspects | Details |
|---|---|
| Study Period | 2019-2033 |
| Base Year | 2024 |
| Estimated Year | 2025 |
| Forecast Period | 2025-2033 |
| Historical Period | 2019-2024 |
| Growth Rate | CAGR of > 4.00% from 2019-2033 |
| Segmentation |
|
Table of Contents
- 1. Introduction
- 1.1. Research Scope
- 1.2. Market Segmentation
- 1.3. Research Methodology
- 1.4. Definitions and Assumptions
- 2. Executive Summary
- 2.1. Introduction
- 3. Market Dynamics
- 3.1. Introduction
- 3.2. Market Drivers
- 3.2.1. Increasing Demand from the Construction Industry; Increasing Demand for Fiberglass Composites from the Automotive Industry
- 3.3. Market Restrains
- 3.3.1. Competition from Carbon Fiber and Rockwool; Low Profit Margin on Sales
- 3.4. Market Trends
- 3.4.1. Rising Demand from the Building and Construction Sector
- 4. Market Factor Analysis
- 4.1. Porters Five Forces
- 4.2. Supply/Value Chain
- 4.3. PESTEL analysis
- 4.4. Market Entropy
- 4.5. Patent/Trademark Analysis
- 5. Global Glass Fiber Market Analysis, Insights and Forecast, 2019-2031
- 5.1. Market Analysis, Insights and Forecast - by Resin Type
- 5.1.1. Chopped Strands
- 5.1.2. Glass Wool
- 5.1.3. Roving
- 5.1.4. Yarn
- 5.2. Market Analysis, Insights and Forecast - by Application
- 5.2.1. Composites
- 5.2.2. Insulation
- 5.3. Market Analysis, Insights and Forecast - by End-user Industry
- 5.3.1. Buildings and Construction
- 5.3.2. Automotive
- 5.3.3. Aerospace and Defense
- 5.3.4. Alternative Energy
- 5.3.5. Consumer Goods
- 5.3.6. Industrial
- 5.3.7. Other End-user Industries (Electronics)
- 5.4. Market Analysis, Insights and Forecast - by Region
- 5.4.1. Asia Pacific
- 5.4.2. North America
- 5.4.3. Europe
- 5.4.4. South America
- 5.4.5. Middle East and Africa
- 5.1. Market Analysis, Insights and Forecast - by Resin Type
- 6. Asia Pacific Glass Fiber Market Analysis, Insights and Forecast, 2019-2031
- 6.1. Market Analysis, Insights and Forecast - by Resin Type
- 6.1.1. Chopped Strands
- 6.1.2. Glass Wool
- 6.1.3. Roving
- 6.1.4. Yarn
- 6.2. Market Analysis, Insights and Forecast - by Application
- 6.2.1. Composites
- 6.2.2. Insulation
- 6.3. Market Analysis, Insights and Forecast - by End-user Industry
- 6.3.1. Buildings and Construction
- 6.3.2. Automotive
- 6.3.3. Aerospace and Defense
- 6.3.4. Alternative Energy
- 6.3.5. Consumer Goods
- 6.3.6. Industrial
- 6.3.7. Other End-user Industries (Electronics)
- 6.1. Market Analysis, Insights and Forecast - by Resin Type
- 7. North America Glass Fiber Market Analysis, Insights and Forecast, 2019-2031
- 7.1. Market Analysis, Insights and Forecast - by Resin Type
- 7.1.1. Chopped Strands
- 7.1.2. Glass Wool
- 7.1.3. Roving
- 7.1.4. Yarn
- 7.2. Market Analysis, Insights and Forecast - by Application
- 7.2.1. Composites
- 7.2.2. Insulation
- 7.3. Market Analysis, Insights and Forecast - by End-user Industry
- 7.3.1. Buildings and Construction
- 7.3.2. Automotive
- 7.3.3. Aerospace and Defense
- 7.3.4. Alternative Energy
- 7.3.5. Consumer Goods
- 7.3.6. Industrial
- 7.3.7. Other End-user Industries (Electronics)
- 7.1. Market Analysis, Insights and Forecast - by Resin Type
- 8. Europe Glass Fiber Market Analysis, Insights and Forecast, 2019-2031
- 8.1. Market Analysis, Insights and Forecast - by Resin Type
- 8.1.1. Chopped Strands
- 8.1.2. Glass Wool
- 8.1.3. Roving
- 8.1.4. Yarn
- 8.2. Market Analysis, Insights and Forecast - by Application
- 8.2.1. Composites
- 8.2.2. Insulation
- 8.3. Market Analysis, Insights and Forecast - by End-user Industry
- 8.3.1. Buildings and Construction
- 8.3.2. Automotive
- 8.3.3. Aerospace and Defense
- 8.3.4. Alternative Energy
- 8.3.5. Consumer Goods
- 8.3.6. Industrial
- 8.3.7. Other End-user Industries (Electronics)
- 8.1. Market Analysis, Insights and Forecast - by Resin Type
- 9. South America Glass Fiber Market Analysis, Insights and Forecast, 2019-2031
- 9.1. Market Analysis, Insights and Forecast - by Resin Type
- 9.1.1. Chopped Strands
- 9.1.2. Glass Wool
- 9.1.3. Roving
- 9.1.4. Yarn
- 9.2. Market Analysis, Insights and Forecast - by Application
- 9.2.1. Composites
- 9.2.2. Insulation
- 9.3. Market Analysis, Insights and Forecast - by End-user Industry
- 9.3.1. Buildings and Construction
- 9.3.2. Automotive
- 9.3.3. Aerospace and Defense
- 9.3.4. Alternative Energy
- 9.3.5. Consumer Goods
- 9.3.6. Industrial
- 9.3.7. Other End-user Industries (Electronics)
- 9.1. Market Analysis, Insights and Forecast - by Resin Type
- 10. Middle East and Africa Glass Fiber Market Analysis, Insights and Forecast, 2019-2031
- 10.1. Market Analysis, Insights and Forecast - by Resin Type
- 10.1.1. Chopped Strands
- 10.1.2. Glass Wool
- 10.1.3. Roving
- 10.1.4. Yarn
- 10.2. Market Analysis, Insights and Forecast - by Application
- 10.2.1. Composites
- 10.2.2. Insulation
- 10.3. Market Analysis, Insights and Forecast - by End-user Industry
- 10.3.1. Buildings and Construction
- 10.3.2. Automotive
- 10.3.3. Aerospace and Defense
- 10.3.4. Alternative Energy
- 10.3.5. Consumer Goods
- 10.3.6. Industrial
- 10.3.7. Other End-user Industries (Electronics)
- 10.1. Market Analysis, Insights and Forecast - by Resin Type
- 11. North America Glass Fiber Market Analysis, Insights and Forecast, 2019-2031
- 11.1. Market Analysis, Insights and Forecast - By Country/Sub-region
- 11.1.1 United States
- 11.1.2 Canada
- 11.1.3 Mexico
- 12. Europe Glass Fiber Market Analysis, Insights and Forecast, 2019-2031
- 12.1. Market Analysis, Insights and Forecast - By Country/Sub-region
- 12.1.1 Germany
- 12.1.2 United Kingdom
- 12.1.3 France
- 12.1.4 Spain
- 12.1.5 Italy
- 12.1.6 Spain
- 12.1.7 Belgium
- 12.1.8 Netherland
- 12.1.9 Nordics
- 12.1.10 Rest of Europe
- 13. Asia Pacific Glass Fiber Market Analysis, Insights and Forecast, 2019-2031
- 13.1. Market Analysis, Insights and Forecast - By Country/Sub-region
- 13.1.1 China
- 13.1.2 Japan
- 13.1.3 India
- 13.1.4 South Korea
- 13.1.5 Southeast Asia
- 13.1.6 Australia
- 13.1.7 Indonesia
- 13.1.8 Phillipes
- 13.1.9 Singapore
- 13.1.10 Thailandc
- 13.1.11 Rest of Asia Pacific
- 14. South America Glass Fiber Market Analysis, Insights and Forecast, 2019-2031
- 14.1. Market Analysis, Insights and Forecast - By Country/Sub-region
- 14.1.1 Brazil
- 14.1.2 Argentina
- 14.1.3 Peru
- 14.1.4 Chile
- 14.1.5 Colombia
- 14.1.6 Ecuador
- 14.1.7 Venezuela
- 14.1.8 Rest of South America
- 15. North America Glass Fiber Market Analysis, Insights and Forecast, 2019-2031
- 15.1. Market Analysis, Insights and Forecast - By Country/Sub-region
- 15.1.1 United States
- 15.1.2 Canada
- 15.1.3 Mexico
- 16. MEA Glass Fiber Market Analysis, Insights and Forecast, 2019-2031
- 16.1. Market Analysis, Insights and Forecast - By Country/Sub-region
- 16.1.1 United Arab Emirates
- 16.1.2 Saudi Arabia
- 16.1.3 South Africa
- 16.1.4 Rest of Middle East and Africa
- 17. Competitive Analysis
- 17.1. Global Market Share Analysis 2024
- 17.2. Company Profiles
- 17.2.1 Heraeus Holding
- 17.2.1.1. Overview
- 17.2.1.2. Products
- 17.2.1.3. SWOT Analysis
- 17.2.1.4. Recent Developments
- 17.2.1.5. Financials (Based on Availability)
- 17.2.2 Saint-Gobain Vetrotex
- 17.2.2.1. Overview
- 17.2.2.2. Products
- 17.2.2.3. SWOT Analysis
- 17.2.2.4. Recent Developments
- 17.2.2.5. Financials (Based on Availability)
- 17.2.3 Chongqing Polycomp International Corp (CPIC)
- 17.2.3.1. Overview
- 17.2.3.2. Products
- 17.2.3.3. SWOT Analysis
- 17.2.3.4. Recent Developments
- 17.2.3.5. Financials (Based on Availability)
- 17.2.4 CTG Group
- 17.2.4.1. Overview
- 17.2.4.2. Products
- 17.2.4.3. SWOT Analysis
- 17.2.4.4. Recent Developments
- 17.2.4.5. Financials (Based on Availability)
- 17.2.5 ASAHI FIBER GLASS Co Ltd
- 17.2.5.1. Overview
- 17.2.5.2. Products
- 17.2.5.3. SWOT Analysis
- 17.2.5.4. Recent Developments
- 17.2.5.5. Financials (Based on Availability)
- 17.2.6 TAIWAN GLASS IND CORP *List Not Exhaustive
- 17.2.6.1. Overview
- 17.2.6.2. Products
- 17.2.6.3. SWOT Analysis
- 17.2.6.4. Recent Developments
- 17.2.6.5. Financials (Based on Availability)
- 17.2.7 Owens Corning
- 17.2.7.1. Overview
- 17.2.7.2. Products
- 17.2.7.3. SWOT Analysis
- 17.2.7.4. Recent Developments
- 17.2.7.5. Financials (Based on Availability)
- 17.2.8 China Jushi Co Ltd
- 17.2.8.1. Overview
- 17.2.8.2. Products
- 17.2.8.3. SWOT Analysis
- 17.2.8.4. Recent Developments
- 17.2.8.5. Financials (Based on Availability)
- 17.2.9 PFG FIBER GLASS CORPORATION
- 17.2.9.1. Overview
- 17.2.9.2. Products
- 17.2.9.3. SWOT Analysis
- 17.2.9.4. Recent Developments
- 17.2.9.5. Financials (Based on Availability)
- 17.2.10 Binani Industries Ltd
- 17.2.10.1. Overview
- 17.2.10.2. Products
- 17.2.10.3. SWOT Analysis
- 17.2.10.4. Recent Developments
- 17.2.10.5. Financials (Based on Availability)
- 17.2.11 Johns Manville
- 17.2.11.1. Overview
- 17.2.11.2. Products
- 17.2.11.3. SWOT Analysis
- 17.2.11.4. Recent Developments
- 17.2.11.5. Financials (Based on Availability)
- 17.2.12 Nippon Electric Glass Co Ltd
- 17.2.12.1. Overview
- 17.2.12.2. Products
- 17.2.12.3. SWOT Analysis
- 17.2.12.4. Recent Developments
- 17.2.12.5. Financials (Based on Availability)
- 17.2.1 Heraeus Holding
List of Figures
- Figure 1: Global Glass Fiber Market Revenue Breakdown (Million, %) by Region 2024 & 2032
- Figure 2: North America Glass Fiber Market Revenue (Million), by Country 2024 & 2032
- Figure 3: North America Glass Fiber Market Revenue Share (%), by Country 2024 & 2032
- Figure 4: Europe Glass Fiber Market Revenue (Million), by Country 2024 & 2032
- Figure 5: Europe Glass Fiber Market Revenue Share (%), by Country 2024 & 2032
- Figure 6: Asia Pacific Glass Fiber Market Revenue (Million), by Country 2024 & 2032
- Figure 7: Asia Pacific Glass Fiber Market Revenue Share (%), by Country 2024 & 2032
- Figure 8: South America Glass Fiber Market Revenue (Million), by Country 2024 & 2032
- Figure 9: South America Glass Fiber Market Revenue Share (%), by Country 2024 & 2032
- Figure 10: North America Glass Fiber Market Revenue (Million), by Country 2024 & 2032
- Figure 11: North America Glass Fiber Market Revenue Share (%), by Country 2024 & 2032
- Figure 12: MEA Glass Fiber Market Revenue (Million), by Country 2024 & 2032
- Figure 13: MEA Glass Fiber Market Revenue Share (%), by Country 2024 & 2032
- Figure 14: Asia Pacific Glass Fiber Market Revenue (Million), by Resin Type 2024 & 2032
- Figure 15: Asia Pacific Glass Fiber Market Revenue Share (%), by Resin Type 2024 & 2032
- Figure 16: Asia Pacific Glass Fiber Market Revenue (Million), by Application 2024 & 2032
- Figure 17: Asia Pacific Glass Fiber Market Revenue Share (%), by Application 2024 & 2032
- Figure 18: Asia Pacific Glass Fiber Market Revenue (Million), by End-user Industry 2024 & 2032
- Figure 19: Asia Pacific Glass Fiber Market Revenue Share (%), by End-user Industry 2024 & 2032
- Figure 20: Asia Pacific Glass Fiber Market Revenue (Million), by Country 2024 & 2032
- Figure 21: Asia Pacific Glass Fiber Market Revenue Share (%), by Country 2024 & 2032
- Figure 22: North America Glass Fiber Market Revenue (Million), by Resin Type 2024 & 2032
- Figure 23: North America Glass Fiber Market Revenue Share (%), by Resin Type 2024 & 2032
- Figure 24: North America Glass Fiber Market Revenue (Million), by Application 2024 & 2032
- Figure 25: North America Glass Fiber Market Revenue Share (%), by Application 2024 & 2032
- Figure 26: North America Glass Fiber Market Revenue (Million), by End-user Industry 2024 & 2032
- Figure 27: North America Glass Fiber Market Revenue Share (%), by End-user Industry 2024 & 2032
- Figure 28: North America Glass Fiber Market Revenue (Million), by Country 2024 & 2032
- Figure 29: North America Glass Fiber Market Revenue Share (%), by Country 2024 & 2032
- Figure 30: Europe Glass Fiber Market Revenue (Million), by Resin Type 2024 & 2032
- Figure 31: Europe Glass Fiber Market Revenue Share (%), by Resin Type 2024 & 2032
- Figure 32: Europe Glass Fiber Market Revenue (Million), by Application 2024 & 2032
- Figure 33: Europe Glass Fiber Market Revenue Share (%), by Application 2024 & 2032
- Figure 34: Europe Glass Fiber Market Revenue (Million), by End-user Industry 2024 & 2032
- Figure 35: Europe Glass Fiber Market Revenue Share (%), by End-user Industry 2024 & 2032
- Figure 36: Europe Glass Fiber Market Revenue (Million), by Country 2024 & 2032
- Figure 37: Europe Glass Fiber Market Revenue Share (%), by Country 2024 & 2032
- Figure 38: South America Glass Fiber Market Revenue (Million), by Resin Type 2024 & 2032
- Figure 39: South America Glass Fiber Market Revenue Share (%), by Resin Type 2024 & 2032
- Figure 40: South America Glass Fiber Market Revenue (Million), by Application 2024 & 2032
- Figure 41: South America Glass Fiber Market Revenue Share (%), by Application 2024 & 2032
- Figure 42: South America Glass Fiber Market Revenue (Million), by End-user Industry 2024 & 2032
- Figure 43: South America Glass Fiber Market Revenue Share (%), by End-user Industry 2024 & 2032
- Figure 44: South America Glass Fiber Market Revenue (Million), by Country 2024 & 2032
- Figure 45: South America Glass Fiber Market Revenue Share (%), by Country 2024 & 2032
- Figure 46: Middle East and Africa Glass Fiber Market Revenue (Million), by Resin Type 2024 & 2032
- Figure 47: Middle East and Africa Glass Fiber Market Revenue Share (%), by Resin Type 2024 & 2032
- Figure 48: Middle East and Africa Glass Fiber Market Revenue (Million), by Application 2024 & 2032
- Figure 49: Middle East and Africa Glass Fiber Market Revenue Share (%), by Application 2024 & 2032
- Figure 50: Middle East and Africa Glass Fiber Market Revenue (Million), by End-user Industry 2024 & 2032
- Figure 51: Middle East and Africa Glass Fiber Market Revenue Share (%), by End-user Industry 2024 & 2032
- Figure 52: Middle East and Africa Glass Fiber Market Revenue (Million), by Country 2024 & 2032
- Figure 53: Middle East and Africa Glass Fiber Market Revenue Share (%), by Country 2024 & 2032
List of Tables
- Table 1: Global Glass Fiber Market Revenue Million Forecast, by Region 2019 & 2032
- Table 2: Global Glass Fiber Market Revenue Million Forecast, by Resin Type 2019 & 2032
- Table 3: Global Glass Fiber Market Revenue Million Forecast, by Application 2019 & 2032
- Table 4: Global Glass Fiber Market Revenue Million Forecast, by End-user Industry 2019 & 2032
- Table 5: Global Glass Fiber Market Revenue Million Forecast, by Region 2019 & 2032
- Table 6: Global Glass Fiber Market Revenue Million Forecast, by Country 2019 & 2032
- Table 7: United States Glass Fiber Market Revenue (Million) Forecast, by Application 2019 & 2032
- Table 8: Canada Glass Fiber Market Revenue (Million) Forecast, by Application 2019 & 2032
- Table 9: Mexico Glass Fiber Market Revenue (Million) Forecast, by Application 2019 & 2032
- Table 10: Global Glass Fiber Market Revenue Million Forecast, by Country 2019 & 2032
- Table 11: Germany Glass Fiber Market Revenue (Million) Forecast, by Application 2019 & 2032
- Table 12: United Kingdom Glass Fiber Market Revenue (Million) Forecast, by Application 2019 & 2032
- Table 13: France Glass Fiber Market Revenue (Million) Forecast, by Application 2019 & 2032
- Table 14: Spain Glass Fiber Market Revenue (Million) Forecast, by Application 2019 & 2032
- Table 15: Italy Glass Fiber Market Revenue (Million) Forecast, by Application 2019 & 2032
- Table 16: Spain Glass Fiber Market Revenue (Million) Forecast, by Application 2019 & 2032
- Table 17: Belgium Glass Fiber Market Revenue (Million) Forecast, by Application 2019 & 2032
- Table 18: Netherland Glass Fiber Market Revenue (Million) Forecast, by Application 2019 & 2032
- Table 19: Nordics Glass Fiber Market Revenue (Million) Forecast, by Application 2019 & 2032
- Table 20: Rest of Europe Glass Fiber Market Revenue (Million) Forecast, by Application 2019 & 2032
- Table 21: Global Glass Fiber Market Revenue Million Forecast, by Country 2019 & 2032
- Table 22: China Glass Fiber Market Revenue (Million) Forecast, by Application 2019 & 2032
- Table 23: Japan Glass Fiber Market Revenue (Million) Forecast, by Application 2019 & 2032
- Table 24: India Glass Fiber Market Revenue (Million) Forecast, by Application 2019 & 2032
- Table 25: South Korea Glass Fiber Market Revenue (Million) Forecast, by Application 2019 & 2032
- Table 26: Southeast Asia Glass Fiber Market Revenue (Million) Forecast, by Application 2019 & 2032
- Table 27: Australia Glass Fiber Market Revenue (Million) Forecast, by Application 2019 & 2032
- Table 28: Indonesia Glass Fiber Market Revenue (Million) Forecast, by Application 2019 & 2032
- Table 29: Phillipes Glass Fiber Market Revenue (Million) Forecast, by Application 2019 & 2032
- Table 30: Singapore Glass Fiber Market Revenue (Million) Forecast, by Application 2019 & 2032
- Table 31: Thailandc Glass Fiber Market Revenue (Million) Forecast, by Application 2019 & 2032
- Table 32: Rest of Asia Pacific Glass Fiber Market Revenue (Million) Forecast, by Application 2019 & 2032
- Table 33: Global Glass Fiber Market Revenue Million Forecast, by Country 2019 & 2032
- Table 34: Brazil Glass Fiber Market Revenue (Million) Forecast, by Application 2019 & 2032
- Table 35: Argentina Glass Fiber Market Revenue (Million) Forecast, by Application 2019 & 2032
- Table 36: Peru Glass Fiber Market Revenue (Million) Forecast, by Application 2019 & 2032
- Table 37: Chile Glass Fiber Market Revenue (Million) Forecast, by Application 2019 & 2032
- Table 38: Colombia Glass Fiber Market Revenue (Million) Forecast, by Application 2019 & 2032
- Table 39: Ecuador Glass Fiber Market Revenue (Million) Forecast, by Application 2019 & 2032
- Table 40: Venezuela Glass Fiber Market Revenue (Million) Forecast, by Application 2019 & 2032
- Table 41: Rest of South America Glass Fiber Market Revenue (Million) Forecast, by Application 2019 & 2032
- Table 42: Global Glass Fiber Market Revenue Million Forecast, by Country 2019 & 2032
- Table 43: United States Glass Fiber Market Revenue (Million) Forecast, by Application 2019 & 2032
- Table 44: Canada Glass Fiber Market Revenue (Million) Forecast, by Application 2019 & 2032
- Table 45: Mexico Glass Fiber Market Revenue (Million) Forecast, by Application 2019 & 2032
- Table 46: Global Glass Fiber Market Revenue Million Forecast, by Country 2019 & 2032
- Table 47: United Arab Emirates Glass Fiber Market Revenue (Million) Forecast, by Application 2019 & 2032
- Table 48: Saudi Arabia Glass Fiber Market Revenue (Million) Forecast, by Application 2019 & 2032
- Table 49: South Africa Glass Fiber Market Revenue (Million) Forecast, by Application 2019 & 2032
- Table 50: Rest of Middle East and Africa Glass Fiber Market Revenue (Million) Forecast, by Application 2019 & 2032
- Table 51: Global Glass Fiber Market Revenue Million Forecast, by Resin Type 2019 & 2032
- Table 52: Global Glass Fiber Market Revenue Million Forecast, by Application 2019 & 2032
- Table 53: Global Glass Fiber Market Revenue Million Forecast, by End-user Industry 2019 & 2032
- Table 54: Global Glass Fiber Market Revenue Million Forecast, by Country 2019 & 2032
- Table 55: China Glass Fiber Market Revenue (Million) Forecast, by Application 2019 & 2032
- Table 56: India Glass Fiber Market Revenue (Million) Forecast, by Application 2019 & 2032
- Table 57: Japan Glass Fiber Market Revenue (Million) Forecast, by Application 2019 & 2032
- Table 58: South Korea Glass Fiber Market Revenue (Million) Forecast, by Application 2019 & 2032
- Table 59: Malaysia Glass Fiber Market Revenue (Million) Forecast, by Application 2019 & 2032
- Table 60: Thailand Glass Fiber Market Revenue (Million) Forecast, by Application 2019 & 2032
- Table 61: Indonesia Glass Fiber Market Revenue (Million) Forecast, by Application 2019 & 2032
- Table 62: Vietnam Glass Fiber Market Revenue (Million) Forecast, by Application 2019 & 2032
- Table 63: Rest of Asia Pacific Glass Fiber Market Revenue (Million) Forecast, by Application 2019 & 2032
- Table 64: Global Glass Fiber Market Revenue Million Forecast, by Resin Type 2019 & 2032
- Table 65: Global Glass Fiber Market Revenue Million Forecast, by Application 2019 & 2032
- Table 66: Global Glass Fiber Market Revenue Million Forecast, by End-user Industry 2019 & 2032
- Table 67: Global Glass Fiber Market Revenue Million Forecast, by Country 2019 & 2032
- Table 68: United States Glass Fiber Market Revenue (Million) Forecast, by Application 2019 & 2032
- Table 69: Canada Glass Fiber Market Revenue (Million) Forecast, by Application 2019 & 2032
- Table 70: Mexico Glass Fiber Market Revenue (Million) Forecast, by Application 2019 & 2032
- Table 71: Global Glass Fiber Market Revenue Million Forecast, by Resin Type 2019 & 2032
- Table 72: Global Glass Fiber Market Revenue Million Forecast, by Application 2019 & 2032
- Table 73: Global Glass Fiber Market Revenue Million Forecast, by End-user Industry 2019 & 2032
- Table 74: Global Glass Fiber Market Revenue Million Forecast, by Country 2019 & 2032
- Table 75: Germany Glass Fiber Market Revenue (Million) Forecast, by Application 2019 & 2032
- Table 76: France Glass Fiber Market Revenue (Million) Forecast, by Application 2019 & 2032
- Table 77: United Kingdom Glass Fiber Market Revenue (Million) Forecast, by Application 2019 & 2032
- Table 78: Italy Glass Fiber Market Revenue (Million) Forecast, by Application 2019 & 2032
- Table 79: Spain Glass Fiber Market Revenue (Million) Forecast, by Application 2019 & 2032
- Table 80: Turkey Glass Fiber Market Revenue (Million) Forecast, by Application 2019 & 2032
- Table 81: Russia Glass Fiber Market Revenue (Million) Forecast, by Application 2019 & 2032
- Table 82: NORDIC Glass Fiber Market Revenue (Million) Forecast, by Application 2019 & 2032
- Table 83: Rest of Europe Glass Fiber Market Revenue (Million) Forecast, by Application 2019 & 2032
- Table 84: Global Glass Fiber Market Revenue Million Forecast, by Resin Type 2019 & 2032
- Table 85: Global Glass Fiber Market Revenue Million Forecast, by Application 2019 & 2032
- Table 86: Global Glass Fiber Market Revenue Million Forecast, by End-user Industry 2019 & 2032
- Table 87: Global Glass Fiber Market Revenue Million Forecast, by Country 2019 & 2032
- Table 88: Brazil Glass Fiber Market Revenue (Million) Forecast, by Application 2019 & 2032
- Table 89: Argentina Glass Fiber Market Revenue (Million) Forecast, by Application 2019 & 2032
- Table 90: Colombia Glass Fiber Market Revenue (Million) Forecast, by Application 2019 & 2032
- Table 91: Rest of South America Glass Fiber Market Revenue (Million) Forecast, by Application 2019 & 2032
- Table 92: Global Glass Fiber Market Revenue Million Forecast, by Resin Type 2019 & 2032
- Table 93: Global Glass Fiber Market Revenue Million Forecast, by Application 2019 & 2032
- Table 94: Global Glass Fiber Market Revenue Million Forecast, by End-user Industry 2019 & 2032
- Table 95: Global Glass Fiber Market Revenue Million Forecast, by Country 2019 & 2032
- Table 96: Saudi Arabia Glass Fiber Market Revenue (Million) Forecast, by Application 2019 & 2032
- Table 97: South Africa Glass Fiber Market Revenue (Million) Forecast, by Application 2019 & 2032
- Table 98: Nigeria Glass Fiber Market Revenue (Million) Forecast, by Application 2019 & 2032
- Table 99: Qatar Glass Fiber Market Revenue (Million) Forecast, by Application 2019 & 2032
- Table 100: Egypt Glass Fiber Market Revenue (Million) Forecast, by Application 2019 & 2032
- Table 101: UAE Glass Fiber Market Revenue (Million) Forecast, by Application 2019 & 2032
- Table 102: Rest of Middle East and Africa Glass Fiber Market Revenue (Million) Forecast, by Application 2019 & 2032
Frequently Asked Questions
1. What is the projected Compound Annual Growth Rate (CAGR) of the Glass Fiber Market?
The projected CAGR is approximately > 4.00%.
2. Which companies are prominent players in the Glass Fiber Market?
Key companies in the market include Heraeus Holding, Saint-Gobain Vetrotex, Chongqing Polycomp International Corp (CPIC), CTG Group, ASAHI FIBER GLASS Co Ltd, TAIWAN GLASS IND CORP *List Not Exhaustive, Owens Corning, China Jushi Co Ltd, PFG FIBER GLASS CORPORATION, Binani Industries Ltd, Johns Manville, Nippon Electric Glass Co Ltd.
3. What are the main segments of the Glass Fiber Market?
The market segments include Resin Type, Application, End-user Industry.
4. Can you provide details about the market size?
The market size is estimated to be USD 29.21 Million as of 2022.
5. What are some drivers contributing to market growth?
Increasing Demand from the Construction Industry; Increasing Demand for Fiberglass Composites from the Automotive Industry.
6. What are the notable trends driving market growth?
Rising Demand from the Building and Construction Sector.
7. Are there any restraints impacting market growth?
Competition from Carbon Fiber and Rockwool; Low Profit Margin on Sales.
8. Can you provide examples of recent developments in the market?
October 2023: Ahlstrom (a manufacturer of fiber-based materials) introduced its new glass fiber tissue line for high-performance building materials. As the market shifts toward sustainable, high-performance building materials, Ahlstrom continues expanding its glass fiber tissue businesses and strengthening its manufacturing operations worldwide with the completion of a significant investment at its manufacturing facility in Madisonville, Kentucky, the United States.
9. What pricing options are available for accessing the report?
Pricing options include single-user, multi-user, and enterprise licenses priced at USD 4750, USD 5250, and USD 8750 respectively.
10. Is the market size provided in terms of value or volume?
The market size is provided in terms of value, measured in Million.
11. Are there any specific market keywords associated with the report?
Yes, the market keyword associated with the report is "Glass Fiber Market," which aids in identifying and referencing the specific market segment covered.
12. How do I determine which pricing option suits my needs best?
The pricing options vary based on user requirements and access needs. Individual users may opt for single-user licenses, while businesses requiring broader access may choose multi-user or enterprise licenses for cost-effective access to the report.
13. Are there any additional resources or data provided in the Glass Fiber Market report?
While the report offers comprehensive insights, it's advisable to review the specific contents or supplementary materials provided to ascertain if additional resources or data are available.
14. How can I stay updated on further developments or reports in the Glass Fiber Market?
To stay informed about further developments, trends, and reports in the Glass Fiber Market, consider subscribing to industry newsletters, following relevant companies and organizations, or regularly checking reputable industry news sources and publications.
Methodology
Step 1 - Identification of Relevant Samples Size from Population Database


Step 2 - Approaches for Defining Global Market Size (Value, Volume* & Price*)

Note*: In applicable scenarios
Step 3 - Data Sources
Primary Research
- Web Analytics
- Survey Reports
- Research Institute
- Latest Research Reports
- Opinion Leaders
Secondary Research
- Annual Reports
- White Paper
- Latest Press Release
- Industry Association
- Paid Database
- Investor Presentations

Step 4 - Data Triangulation
Involves using different sources of information in order to increase the validity of a study
These sources are likely to be stakeholders in a program - participants, other researchers, program staff, other community members, and so on.
Then we put all data in single framework & apply various statistical tools to find out the dynamic on the market.
During the analysis stage, feedback from the stakeholder groups would be compared to determine areas of agreement as well as areas of divergence


