

Key Insights
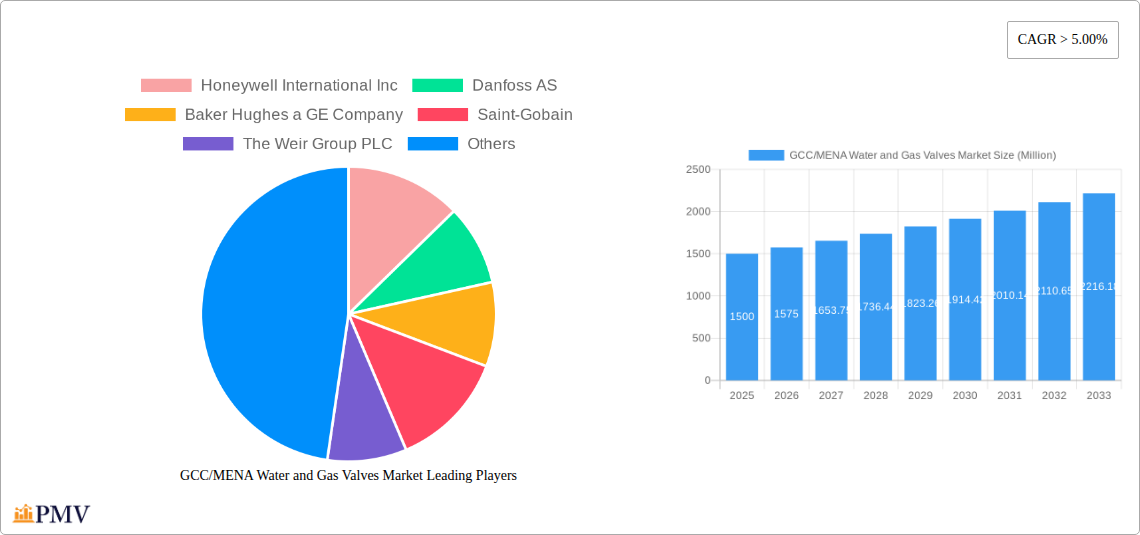
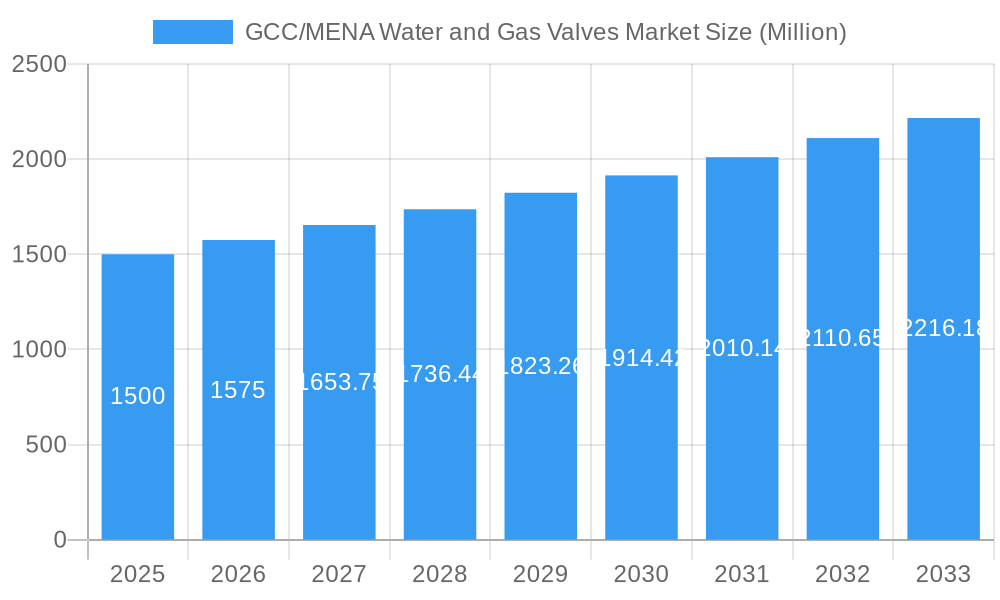
The GCC/MENA Water and Gas Valves Market is exhibiting strong growth, propelled by substantial infrastructure investment across the region. Expanding industrial sectors, particularly petrochemicals and energy, alongside rapid urbanization and population increases, are driving elevated demand for efficient and dependable water and gas distribution systems. This trend necessitates the adoption of advanced valve technologies, thereby stimulating market expansion. A Compound Annual Growth Rate (CAGR) of 5.12% underscores a consistent upward trajectory, projected through 2033. Dominant valve types include butterfly, ball, globe, and gate valves, serving diverse industrial and municipal needs. While factors like oil price volatility and potential economic slowdowns may present temporary challenges, the long-term outlook remains favorable, supported by government-led initiatives promoting sustainable water management and infrastructure modernization. The increasing integration of smart valves and automation technologies further enhances market potential. The competitive environment features a blend of global and regional enterprises, fostering innovation and competitive pricing.
GCC/MENA Water and Gas Valves Market Market Size (In Billion)
Market segmentation highlights significant demand across various valve types, with butterfly and ball valves expected to lead market share due to their broad applicability and cost-effectiveness. The industrial sector is paramount, driven by large-scale projects in oil & gas, power generation, and chemical processing. Concurrently, the municipal sector is experiencing accelerated growth, fueled by investments in water infrastructure enhancements and the expansion of water networks to support growing populations. Leading companies are prioritizing strategic alliances, technological innovation, and geographic expansion to solidify their market positions and leverage growth opportunities within the GCC/MENA region. Future expansion is anticipated to be driven by ongoing infrastructure development, smart city initiatives, and an increased emphasis on water conservation and efficiency. The projected market size for 2025 is $11.69 billion.
GCC/MENA Water and Gas Valves Market Company Market Share
GCC/MENA Water and Gas Valves Market: A Comprehensive Report (2019-2033)
This in-depth report provides a comprehensive analysis of the GCC/MENA water and gas valves market, offering invaluable insights for stakeholders across the value chain. Covering the period from 2019 to 2033, with a focus on 2025, this study meticulously examines market structure, competitive dynamics, industry trends, dominant segments, and future growth prospects. The report incorporates detailed segmentation by valve type (Butterfly Valve, Ball Valve, Globe Valve, Gate Valve, Plug Valve, Other Types) and application (Industrial, Municipal), offering granular data for informed decision-making. The market size is projected to reach xx Million by 2033.
GCC/MENA Water and Gas Valves Market Market Structure & Competitive Dynamics
The GCC/MENA water and gas valves market exhibits a moderately concentrated structure, with several multinational corporations and regional players vying for market share. Key players such as Honeywell International Inc, Danfoss AS, Baker Hughes a GE Company, and Flowserve Corporation hold significant positions, leveraging their established brand reputation and extensive distribution networks. The market is characterized by an evolving innovation ecosystem, with companies increasingly focusing on smart valves and digitally enabled solutions to enhance operational efficiency and reduce water/gas loss. Regulatory frameworks, particularly concerning water conservation and safety standards, play a crucial role in shaping market dynamics. Product substitutes, such as alternative piping materials and control systems, pose a degree of competitive pressure. End-user trends, including the growing adoption of advanced metering infrastructure (AMI) and the shift towards sustainable water management practices, are driving demand for sophisticated valve technologies. M&A activity in the sector has been moderate, with deal values averaging around xx Million in recent years, driven primarily by strategic acquisitions aimed at expanding product portfolios and geographic reach. Market share data reveals a dynamic landscape, with leading players exhibiting a robust commitment to organic growth and strategic partnerships to maintain competitiveness. For instance, Company A holds approximately xx% market share in the butterfly valve segment, while Company B dominates the industrial application sector with xx% market share.
GCC/MENA Water and Gas Valves Market Industry Trends & Insights
The GCC/MENA water and gas valves market is witnessing robust growth, driven by several key factors. The region's expanding industrial sector, particularly the petrochemical, oil & gas, and power generation segments, fuels significant demand for high-performance valves. Furthermore, government initiatives focused on infrastructure development, water conservation, and smart city projects are creating substantial opportunities for market expansion. Technological advancements, including the adoption of smart valves, automated control systems, and remote monitoring capabilities, are transforming the industry landscape. Consumer preferences are shifting towards energy-efficient and sustainable solutions, driving the demand for valves with improved leak detection and reduced maintenance requirements. The compounded annual growth rate (CAGR) is estimated at xx% during the forecast period (2025-2033), exceeding the global average. Market penetration of advanced valve technologies remains relatively low, indicating substantial growth potential. Competitive dynamics are characterized by intense rivalry among established players and the emergence of innovative startups offering specialized solutions. This competitive landscape fosters technological advancements and drives down costs, benefiting end-users. The increasing adoption of digital technologies and the implementation of smart water management systems are projected to further accelerate market growth in the coming years.
Dominant Markets & Segments in GCC/MENA Water and Gas Valves Market
The UAE and Saudi Arabia currently dominate the GCC/MENA water and gas valves market, driven by their substantial infrastructure investments and robust industrial growth.
- Key Drivers in UAE: Large-scale infrastructure projects, strategic investments in renewable energy, and a thriving industrial sector.
- Key Drivers in Saudi Arabia: Focus on Vision 2030 initiatives, diversification of the economy, and ambitious infrastructure development programs.
Within the segmentation, the Industrial application segment holds the largest market share, reflecting the high demand from various industries, including oil & gas, petrochemicals, and power generation. Among valve types, Ball Valves and Butterfly Valves represent significant portions of the market due to their versatility and cost-effectiveness. The continued expansion of industrial activities, especially in the oil and gas sector, coupled with robust government spending on infrastructure projects, fuels the dominance of these segments. Furthermore, the increasing focus on water security and efficient water management is expected to boost demand for specialized valves across various applications in the coming years. The municipal sector is also experiencing substantial growth, driven by ongoing investments in water infrastructure and smart city projects.
GCC/MENA Water and Gas Valves Market Product Innovations
Recent product innovations have focused on enhancing efficiency, reliability, and sustainability. Smart valves with integrated sensors and remote monitoring capabilities are gaining popularity, allowing for real-time performance tracking and predictive maintenance. Advanced materials like corrosion-resistant alloys and high-performance polymers are being adopted to improve valve durability and extend service life. These innovations cater to the growing demand for enhanced operational efficiency, reduced downtime, and environmentally friendly solutions in water and gas management systems. Manufacturers are focusing on compact designs to reduce installation footprint and improve ease of maintenance.
Report Segmentation & Scope
This report segments the GCC/MENA water and gas valves market based on valve type and application:
By Valve Type: Butterfly Valve, Ball Valve, Globe Valve, Gate Valve, Plug Valve, Other Types. Each segment's market size, growth projections, and competitive dynamics are analyzed in detail. For instance, the Butterfly Valve segment is expected to witness a CAGR of xx%, driven by its suitability for large-diameter pipelines.
By Application: Industrial, Municipal. The report explores the unique characteristics of each application segment, including specific technological requirements and growth drivers. The Industrial segment, fueled by ongoing infrastructure development, is projected to dominate market share, showing a projected growth of xx% over the forecast period.
Key Drivers of GCC/MENA Water and Gas Valves Market Growth
Several key factors drive the growth of the GCC/MENA water and gas valves market: the region's burgeoning industrial sector, especially oil & gas and petrochemicals; significant investments in infrastructure development; government initiatives promoting water conservation and smart city projects; increasing adoption of advanced valve technologies; and the growing emphasis on sustainable water management practices. These factors collectively create a fertile ground for market expansion and innovation.
Challenges in the GCC/MENA Water and Gas Valves Market Sector
The market faces challenges including the volatile price of raw materials, supply chain disruptions, intense competition among established players, and the regulatory environment. These factors can significantly impact pricing, availability, and overall market growth. Furthermore, the need for skilled labor and stringent safety regulations pose additional obstacles.
Leading Players in the GCC/MENA Water and Gas Valves Market Market
- Honeywell International Inc
- Danfoss AS
- Baker Hughes a GE Company
- Saint-Gobain
- The Weir Group PLC
- Flowserve Corporation
- Georg Fischer Ltd
- Emerson Electric Co
- IMI Critical Engineering
- Crane Co
- AVK Gulf And Watecom International Water Network LLC
- Schlumberger Limited
- TechnipFMC PLC
- Alfa Laval AB
- Circor International Inc
Key Developments in GCC/MENA Water and Gas Valves Market Sector
- January 2023: Honeywell International Inc. launched a new line of smart valves with integrated sensors.
- June 2022: Danfoss AS acquired a regional valve manufacturer, expanding its market presence.
- October 2021: A significant infrastructure project in Saudi Arabia spurred increased demand for high-pressure valves.
Strategic GCC/MENA Water and Gas Valves Market Market Outlook
The GCC/MENA water and gas valves market is poised for sustained growth, driven by continued investment in infrastructure, technological advancements, and the region's commitment to sustainable water management. Strategic opportunities exist for companies that can offer innovative, energy-efficient, and cost-effective solutions. Focus on digitalization, smart technologies, and sustainable practices will be crucial for success in this dynamic market. The market's long-term outlook remains positive, with significant growth potential in both the industrial and municipal sectors.
GCC/MENA Water and Gas Valves Market Segmentation
-
1. Type
- 1.1. Butterfly Valve
- 1.2. Ball Valve
- 1.3. Globe Valve
- 1.4. Gate Valve
- 1.5. Plug Valve
- 1.6. Other Types
-
2. Application
- 2.1. Industrial
- 2.2. Municipal
-
3. Geography
- 3.1. Saudi Arabia
- 3.2. United Arab Emirates
- 3.3. Qatar
- 3.4. Algeria
- 3.5. Egypt
- 3.6. Iran
- 3.7. Iraq
- 3.8. Rest of GCC and North Africa
GCC/MENA Water and Gas Valves Market Segmentation By Geography
- 1. Saudi Arabia
- 2. United Arab Emirates
- 3. Qatar
- 4. Algeria
- 5. Egypt
- 6. Iran
- 7. Iraq
- 8. Rest of GCC and North Africa
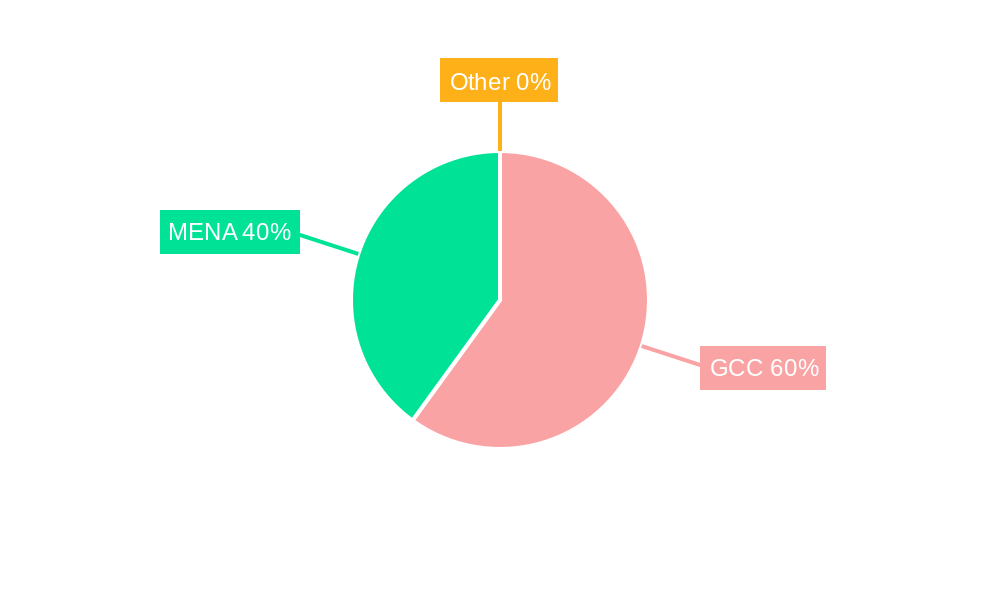
GCC/MENA Water and Gas Valves Market Regional Market Share
Geographic Coverage of GCC/MENA Water and Gas Valves Market
GCC/MENA Water and Gas Valves Market REPORT HIGHLIGHTS
| Aspects | Details |
|---|---|
| Study Period | 2020-2034 |
| Base Year | 2025 |
| Estimated Year | 2026 |
| Forecast Period | 2026-2034 |
| Historical Period | 2020-2025 |
| Growth Rate | CAGR of 5.12% from 2020-2034 |
| Segmentation |
|
Table of Contents
- 1. Introduction
- 1.1. Research Scope
- 1.2. Market Segmentation
- 1.3. Research Objective
- 1.4. Definitions and Assumptions
- 2. Executive Summary
- 2.1. Market Snapshot
- 3. Market Dynamics
- 3.1. Market Drivers
- 3.2. Market Restrains
- 3.3. Market Trends
- 3.4. Market Opportunities
- 4. Market Factor Analysis
- 4.1. Porters Five Forces
- 4.1.1. Bargaining Power of Suppliers
- 4.1.2. Bargaining Power of Buyers
- 4.1.3. Threat of New Entrants
- 4.1.4. Threat of Substitutes
- 4.1.5. Competitive Rivalry
- 4.2. PESTEL analysis
- 4.3. BCG Analysis
- 4.3.1. Stars (High Growth, High Market Share)
- 4.3.2. Cash Cows (Low Growth, High Market Share)
- 4.3.3. Question Mark (High Growth, Low Market Share)
- 4.3.4. Dogs (Low Growth, Low Market Share)
- 4.4. Ansoff Matrix Analysis
- 4.5. Supply Chain Analysis
- 4.6. Regulatory Landscape
- 4.7. Current Market Potential and Opportunity Assessment (TAM–SAM–SOM Framework)
- 4.8. PMV Analyst Note
- 4.1. Porters Five Forces
- 5. Market Analysis, Insights and Forecast 2021-2033
- 5.1. Market Analysis, Insights and Forecast - by Type
- 5.1.1. Butterfly Valve
- 5.1.2. Ball Valve
- 5.1.3. Globe Valve
- 5.1.4. Gate Valve
- 5.1.5. Plug Valve
- 5.1.6. Other Types
- 5.2. Market Analysis, Insights and Forecast - by Application
- 5.2.1. Industrial
- 5.2.2. Municipal
- 5.3. Market Analysis, Insights and Forecast - by Geography
- 5.3.1. Saudi Arabia
- 5.3.2. United Arab Emirates
- 5.3.3. Qatar
- 5.3.4. Algeria
- 5.3.5. Egypt
- 5.3.6. Iran
- 5.3.7. Iraq
- 5.3.8. Rest of GCC and North Africa
- 5.4. Market Analysis, Insights and Forecast - by Region
- 5.4.1. Saudi Arabia
- 5.4.2. United Arab Emirates
- 5.4.3. Qatar
- 5.4.4. Algeria
- 5.4.5. Egypt
- 5.4.6. Iran
- 5.4.7. Iraq
- 5.4.8. Rest of GCC and North Africa
- 5.1. Market Analysis, Insights and Forecast - by Type
- 6. Global GCC/MENA Water and Gas Valves Market Analysis, Insights and Forecast, 2021-2033
- 6.1. Market Analysis, Insights and Forecast - by Type
- 6.1.1. Butterfly Valve
- 6.1.2. Ball Valve
- 6.1.3. Globe Valve
- 6.1.4. Gate Valve
- 6.1.5. Plug Valve
- 6.1.6. Other Types
- 6.2. Market Analysis, Insights and Forecast - by Application
- 6.2.1. Industrial
- 6.2.2. Municipal
- 6.3. Market Analysis, Insights and Forecast - by Geography
- 6.3.1. Saudi Arabia
- 6.3.2. United Arab Emirates
- 6.3.3. Qatar
- 6.3.4. Algeria
- 6.3.5. Egypt
- 6.3.6. Iran
- 6.3.7. Iraq
- 6.3.8. Rest of GCC and North Africa
- 6.1. Market Analysis, Insights and Forecast - by Type
- 7. Saudi Arabia GCC/MENA Water and Gas Valves Market Analysis, Insights and Forecast, 2020-2032
- 7.1. Market Analysis, Insights and Forecast - by Type
- 7.1.1. Butterfly Valve
- 7.1.2. Ball Valve
- 7.1.3. Globe Valve
- 7.1.4. Gate Valve
- 7.1.5. Plug Valve
- 7.1.6. Other Types
- 7.2. Market Analysis, Insights and Forecast - by Application
- 7.2.1. Industrial
- 7.2.2. Municipal
- 7.3. Market Analysis, Insights and Forecast - by Geography
- 7.3.1. Saudi Arabia
- 7.3.2. United Arab Emirates
- 7.3.3. Qatar
- 7.3.4. Algeria
- 7.3.5. Egypt
- 7.3.6. Iran
- 7.3.7. Iraq
- 7.3.8. Rest of GCC and North Africa
- 7.1. Market Analysis, Insights and Forecast - by Type
- 8. United Arab Emirates GCC/MENA Water and Gas Valves Market Analysis, Insights and Forecast, 2020-2032
- 8.1. Market Analysis, Insights and Forecast - by Type
- 8.1.1. Butterfly Valve
- 8.1.2. Ball Valve
- 8.1.3. Globe Valve
- 8.1.4. Gate Valve
- 8.1.5. Plug Valve
- 8.1.6. Other Types
- 8.2. Market Analysis, Insights and Forecast - by Application
- 8.2.1. Industrial
- 8.2.2. Municipal
- 8.3. Market Analysis, Insights and Forecast - by Geography
- 8.3.1. Saudi Arabia
- 8.3.2. United Arab Emirates
- 8.3.3. Qatar
- 8.3.4. Algeria
- 8.3.5. Egypt
- 8.3.6. Iran
- 8.3.7. Iraq
- 8.3.8. Rest of GCC and North Africa
- 8.1. Market Analysis, Insights and Forecast - by Type
- 9. Qatar GCC/MENA Water and Gas Valves Market Analysis, Insights and Forecast, 2020-2032
- 9.1. Market Analysis, Insights and Forecast - by Type
- 9.1.1. Butterfly Valve
- 9.1.2. Ball Valve
- 9.1.3. Globe Valve
- 9.1.4. Gate Valve
- 9.1.5. Plug Valve
- 9.1.6. Other Types
- 9.2. Market Analysis, Insights and Forecast - by Application
- 9.2.1. Industrial
- 9.2.2. Municipal
- 9.3. Market Analysis, Insights and Forecast - by Geography
- 9.3.1. Saudi Arabia
- 9.3.2. United Arab Emirates
- 9.3.3. Qatar
- 9.3.4. Algeria
- 9.3.5. Egypt
- 9.3.6. Iran
- 9.3.7. Iraq
- 9.3.8. Rest of GCC and North Africa
- 9.1. Market Analysis, Insights and Forecast - by Type
- 10. Algeria GCC/MENA Water and Gas Valves Market Analysis, Insights and Forecast, 2020-2032
- 10.1. Market Analysis, Insights and Forecast - by Type
- 10.1.1. Butterfly Valve
- 10.1.2. Ball Valve
- 10.1.3. Globe Valve
- 10.1.4. Gate Valve
- 10.1.5. Plug Valve
- 10.1.6. Other Types
- 10.2. Market Analysis, Insights and Forecast - by Application
- 10.2.1. Industrial
- 10.2.2. Municipal
- 10.3. Market Analysis, Insights and Forecast - by Geography
- 10.3.1. Saudi Arabia
- 10.3.2. United Arab Emirates
- 10.3.3. Qatar
- 10.3.4. Algeria
- 10.3.5. Egypt
- 10.3.6. Iran
- 10.3.7. Iraq
- 10.3.8. Rest of GCC and North Africa
- 10.1. Market Analysis, Insights and Forecast - by Type
- 11. Egypt GCC/MENA Water and Gas Valves Market Analysis, Insights and Forecast, 2020-2032
- 11.1. Market Analysis, Insights and Forecast - by Type
- 11.1.1. Butterfly Valve
- 11.1.2. Ball Valve
- 11.1.3. Globe Valve
- 11.1.4. Gate Valve
- 11.1.5. Plug Valve
- 11.1.6. Other Types
- 11.2. Market Analysis, Insights and Forecast - by Application
- 11.2.1. Industrial
- 11.2.2. Municipal
- 11.3. Market Analysis, Insights and Forecast - by Geography
- 11.3.1. Saudi Arabia
- 11.3.2. United Arab Emirates
- 11.3.3. Qatar
- 11.3.4. Algeria
- 11.3.5. Egypt
- 11.3.6. Iran
- 11.3.7. Iraq
- 11.3.8. Rest of GCC and North Africa
- 11.1. Market Analysis, Insights and Forecast - by Type
- 12. Iran GCC/MENA Water and Gas Valves Market Analysis, Insights and Forecast, 2020-2032
- 12.1. Market Analysis, Insights and Forecast - by Type
- 12.1.1. Butterfly Valve
- 12.1.2. Ball Valve
- 12.1.3. Globe Valve
- 12.1.4. Gate Valve
- 12.1.5. Plug Valve
- 12.1.6. Other Types
- 12.2. Market Analysis, Insights and Forecast - by Application
- 12.2.1. Industrial
- 12.2.2. Municipal
- 12.3. Market Analysis, Insights and Forecast - by Geography
- 12.3.1. Saudi Arabia
- 12.3.2. United Arab Emirates
- 12.3.3. Qatar
- 12.3.4. Algeria
- 12.3.5. Egypt
- 12.3.6. Iran
- 12.3.7. Iraq
- 12.3.8. Rest of GCC and North Africa
- 12.1. Market Analysis, Insights and Forecast - by Type
- 13. Iraq GCC/MENA Water and Gas Valves Market Analysis, Insights and Forecast, 2020-2032
- 13.1. Market Analysis, Insights and Forecast - by Type
- 13.1.1. Butterfly Valve
- 13.1.2. Ball Valve
- 13.1.3. Globe Valve
- 13.1.4. Gate Valve
- 13.1.5. Plug Valve
- 13.1.6. Other Types
- 13.2. Market Analysis, Insights and Forecast - by Application
- 13.2.1. Industrial
- 13.2.2. Municipal
- 13.3. Market Analysis, Insights and Forecast - by Geography
- 13.3.1. Saudi Arabia
- 13.3.2. United Arab Emirates
- 13.3.3. Qatar
- 13.3.4. Algeria
- 13.3.5. Egypt
- 13.3.6. Iran
- 13.3.7. Iraq
- 13.3.8. Rest of GCC and North Africa
- 13.1. Market Analysis, Insights and Forecast - by Type
- 14. Rest of GCC and North Africa GCC/MENA Water and Gas Valves Market Analysis, Insights and Forecast, 2020-2032
- 14.1. Market Analysis, Insights and Forecast - by Type
- 14.1.1. Butterfly Valve
- 14.1.2. Ball Valve
- 14.1.3. Globe Valve
- 14.1.4. Gate Valve
- 14.1.5. Plug Valve
- 14.1.6. Other Types
- 14.2. Market Analysis, Insights and Forecast - by Application
- 14.2.1. Industrial
- 14.2.2. Municipal
- 14.3. Market Analysis, Insights and Forecast - by Geography
- 14.3.1. Saudi Arabia
- 14.3.2. United Arab Emirates
- 14.3.3. Qatar
- 14.3.4. Algeria
- 14.3.5. Egypt
- 14.3.6. Iran
- 14.3.7. Iraq
- 14.3.8. Rest of GCC and North Africa
- 14.1. Market Analysis, Insights and Forecast - by Type
- 15. Competitive Analysis
- 15.1. Company Profiles
- 15.1.1 Honeywell International Inc
- 15.1.1.1. Company Overview
- 15.1.1.2. Products
- 15.1.1.3. Company Financials
- 15.1.1.4. SWOT Analysis
- 15.1.2 Danfoss AS
- 15.1.2.1. Company Overview
- 15.1.2.2. Products
- 15.1.2.3. Company Financials
- 15.1.2.4. SWOT Analysis
- 15.1.3 Baker Hughes a GE Company
- 15.1.3.1. Company Overview
- 15.1.3.2. Products
- 15.1.3.3. Company Financials
- 15.1.3.4. SWOT Analysis
- 15.1.4 Saint-Gobain
- 15.1.4.1. Company Overview
- 15.1.4.2. Products
- 15.1.4.3. Company Financials
- 15.1.4.4. SWOT Analysis
- 15.1.5 The Weir Group PLC
- 15.1.5.1. Company Overview
- 15.1.5.2. Products
- 15.1.5.3. Company Financials
- 15.1.5.4. SWOT Analysis
- 15.1.6 Flowserve Corporation
- 15.1.6.1. Company Overview
- 15.1.6.2. Products
- 15.1.6.3. Company Financials
- 15.1.6.4. SWOT Analysis
- 15.1.7 Georg Fischer Ltd
- 15.1.7.1. Company Overview
- 15.1.7.2. Products
- 15.1.7.3. Company Financials
- 15.1.7.4. SWOT Analysis
- 15.1.8 Emerson Electric Co
- 15.1.8.1. Company Overview
- 15.1.8.2. Products
- 15.1.8.3. Company Financials
- 15.1.8.4. SWOT Analysis
- 15.1.9 IMI Critical Engineering
- 15.1.9.1. Company Overview
- 15.1.9.2. Products
- 15.1.9.3. Company Financials
- 15.1.9.4. SWOT Analysis
- 15.1.10 Crane Co
- 15.1.10.1. Company Overview
- 15.1.10.2. Products
- 15.1.10.3. Company Financials
- 15.1.10.4. SWOT Analysis
- 15.1.11 AVK Gulf And Watecom International Water Network LLC
- 15.1.11.1. Company Overview
- 15.1.11.2. Products
- 15.1.11.3. Company Financials
- 15.1.11.4. SWOT Analysis
- 15.1.12 Schlumberger Limited
- 15.1.12.1. Company Overview
- 15.1.12.2. Products
- 15.1.12.3. Company Financials
- 15.1.12.4. SWOT Analysis
- 15.1.13 TechnipFMC PLC
- 15.1.13.1. Company Overview
- 15.1.13.2. Products
- 15.1.13.3. Company Financials
- 15.1.13.4. SWOT Analysis
- 15.1.14 Alfa Laval AB
- 15.1.14.1. Company Overview
- 15.1.14.2. Products
- 15.1.14.3. Company Financials
- 15.1.14.4. SWOT Analysis
- 15.1.15 Circor International Inc
- 15.1.15.1. Company Overview
- 15.1.15.2. Products
- 15.1.15.3. Company Financials
- 15.1.15.4. SWOT Analysis
- 15.1.1 Honeywell International Inc
- 15.2. Market Entropy
- 15.2.1 Company's Key Areas Served
- 15.2.2 Recent Developments
- 15.3. Company Market Share Analysis 2025
- 15.3.1 Top 5 Companies Market Share Analysis
- 15.3.2 Top 3 Companies Market Share Analysis
- 15.4. List of Potential Customers
- 16. Research Methodology
List of Figures
- Figure 1: Global GCC/MENA Water and Gas Valves Market Revenue Breakdown (billion, %) by Region 2025 & 2033
- Figure 2: Global GCC/MENA Water and Gas Valves Market Volume Breakdown (K Units, %) by Region 2025 & 2033
- Figure 3: Saudi Arabia GCC/MENA Water and Gas Valves Market Revenue (billion), by Type 2025 & 2033
- Figure 4: Saudi Arabia GCC/MENA Water and Gas Valves Market Volume (K Units), by Type 2025 & 2033
- Figure 5: Saudi Arabia GCC/MENA Water and Gas Valves Market Revenue Share (%), by Type 2025 & 2033
- Figure 6: Saudi Arabia GCC/MENA Water and Gas Valves Market Volume Share (%), by Type 2025 & 2033
- Figure 7: Saudi Arabia GCC/MENA Water and Gas Valves Market Revenue (billion), by Application 2025 & 2033
- Figure 8: Saudi Arabia GCC/MENA Water and Gas Valves Market Volume (K Units), by Application 2025 & 2033
- Figure 9: Saudi Arabia GCC/MENA Water and Gas Valves Market Revenue Share (%), by Application 2025 & 2033
- Figure 10: Saudi Arabia GCC/MENA Water and Gas Valves Market Volume Share (%), by Application 2025 & 2033
- Figure 11: Saudi Arabia GCC/MENA Water and Gas Valves Market Revenue (billion), by Geography 2025 & 2033
- Figure 12: Saudi Arabia GCC/MENA Water and Gas Valves Market Volume (K Units), by Geography 2025 & 2033
- Figure 13: Saudi Arabia GCC/MENA Water and Gas Valves Market Revenue Share (%), by Geography 2025 & 2033
- Figure 14: Saudi Arabia GCC/MENA Water and Gas Valves Market Volume Share (%), by Geography 2025 & 2033
- Figure 15: Saudi Arabia GCC/MENA Water and Gas Valves Market Revenue (billion), by Country 2025 & 2033
- Figure 16: Saudi Arabia GCC/MENA Water and Gas Valves Market Volume (K Units), by Country 2025 & 2033
- Figure 17: Saudi Arabia GCC/MENA Water and Gas Valves Market Revenue Share (%), by Country 2025 & 2033
- Figure 18: Saudi Arabia GCC/MENA Water and Gas Valves Market Volume Share (%), by Country 2025 & 2033
- Figure 19: United Arab Emirates GCC/MENA Water and Gas Valves Market Revenue (billion), by Type 2025 & 2033
- Figure 20: United Arab Emirates GCC/MENA Water and Gas Valves Market Volume (K Units), by Type 2025 & 2033
- Figure 21: United Arab Emirates GCC/MENA Water and Gas Valves Market Revenue Share (%), by Type 2025 & 2033
- Figure 22: United Arab Emirates GCC/MENA Water and Gas Valves Market Volume Share (%), by Type 2025 & 2033
- Figure 23: United Arab Emirates GCC/MENA Water and Gas Valves Market Revenue (billion), by Application 2025 & 2033
- Figure 24: United Arab Emirates GCC/MENA Water and Gas Valves Market Volume (K Units), by Application 2025 & 2033
- Figure 25: United Arab Emirates GCC/MENA Water and Gas Valves Market Revenue Share (%), by Application 2025 & 2033
- Figure 26: United Arab Emirates GCC/MENA Water and Gas Valves Market Volume Share (%), by Application 2025 & 2033
- Figure 27: United Arab Emirates GCC/MENA Water and Gas Valves Market Revenue (billion), by Geography 2025 & 2033
- Figure 28: United Arab Emirates GCC/MENA Water and Gas Valves Market Volume (K Units), by Geography 2025 & 2033
- Figure 29: United Arab Emirates GCC/MENA Water and Gas Valves Market Revenue Share (%), by Geography 2025 & 2033
- Figure 30: United Arab Emirates GCC/MENA Water and Gas Valves Market Volume Share (%), by Geography 2025 & 2033
- Figure 31: United Arab Emirates GCC/MENA Water and Gas Valves Market Revenue (billion), by Country 2025 & 2033
- Figure 32: United Arab Emirates GCC/MENA Water and Gas Valves Market Volume (K Units), by Country 2025 & 2033
- Figure 33: United Arab Emirates GCC/MENA Water and Gas Valves Market Revenue Share (%), by Country 2025 & 2033
- Figure 34: United Arab Emirates GCC/MENA Water and Gas Valves Market Volume Share (%), by Country 2025 & 2033
- Figure 35: Qatar GCC/MENA Water and Gas Valves Market Revenue (billion), by Type 2025 & 2033
- Figure 36: Qatar GCC/MENA Water and Gas Valves Market Volume (K Units), by Type 2025 & 2033
- Figure 37: Qatar GCC/MENA Water and Gas Valves Market Revenue Share (%), by Type 2025 & 2033
- Figure 38: Qatar GCC/MENA Water and Gas Valves Market Volume Share (%), by Type 2025 & 2033
- Figure 39: Qatar GCC/MENA Water and Gas Valves Market Revenue (billion), by Application 2025 & 2033
- Figure 40: Qatar GCC/MENA Water and Gas Valves Market Volume (K Units), by Application 2025 & 2033
- Figure 41: Qatar GCC/MENA Water and Gas Valves Market Revenue Share (%), by Application 2025 & 2033
- Figure 42: Qatar GCC/MENA Water and Gas Valves Market Volume Share (%), by Application 2025 & 2033
- Figure 43: Qatar GCC/MENA Water and Gas Valves Market Revenue (billion), by Geography 2025 & 2033
- Figure 44: Qatar GCC/MENA Water and Gas Valves Market Volume (K Units), by Geography 2025 & 2033
- Figure 45: Qatar GCC/MENA Water and Gas Valves Market Revenue Share (%), by Geography 2025 & 2033
- Figure 46: Qatar GCC/MENA Water and Gas Valves Market Volume Share (%), by Geography 2025 & 2033
- Figure 47: Qatar GCC/MENA Water and Gas Valves Market Revenue (billion), by Country 2025 & 2033
- Figure 48: Qatar GCC/MENA Water and Gas Valves Market Volume (K Units), by Country 2025 & 2033
- Figure 49: Qatar GCC/MENA Water and Gas Valves Market Revenue Share (%), by Country 2025 & 2033
- Figure 50: Qatar GCC/MENA Water and Gas Valves Market Volume Share (%), by Country 2025 & 2033
- Figure 51: Algeria GCC/MENA Water and Gas Valves Market Revenue (billion), by Type 2025 & 2033
- Figure 52: Algeria GCC/MENA Water and Gas Valves Market Volume (K Units), by Type 2025 & 2033
- Figure 53: Algeria GCC/MENA Water and Gas Valves Market Revenue Share (%), by Type 2025 & 2033
- Figure 54: Algeria GCC/MENA Water and Gas Valves Market Volume Share (%), by Type 2025 & 2033
- Figure 55: Algeria GCC/MENA Water and Gas Valves Market Revenue (billion), by Application 2025 & 2033
- Figure 56: Algeria GCC/MENA Water and Gas Valves Market Volume (K Units), by Application 2025 & 2033
- Figure 57: Algeria GCC/MENA Water and Gas Valves Market Revenue Share (%), by Application 2025 & 2033
- Figure 58: Algeria GCC/MENA Water and Gas Valves Market Volume Share (%), by Application 2025 & 2033
- Figure 59: Algeria GCC/MENA Water and Gas Valves Market Revenue (billion), by Geography 2025 & 2033
- Figure 60: Algeria GCC/MENA Water and Gas Valves Market Volume (K Units), by Geography 2025 & 2033
- Figure 61: Algeria GCC/MENA Water and Gas Valves Market Revenue Share (%), by Geography 2025 & 2033
- Figure 62: Algeria GCC/MENA Water and Gas Valves Market Volume Share (%), by Geography 2025 & 2033
- Figure 63: Algeria GCC/MENA Water and Gas Valves Market Revenue (billion), by Country 2025 & 2033
- Figure 64: Algeria GCC/MENA Water and Gas Valves Market Volume (K Units), by Country 2025 & 2033
- Figure 65: Algeria GCC/MENA Water and Gas Valves Market Revenue Share (%), by Country 2025 & 2033
- Figure 66: Algeria GCC/MENA Water and Gas Valves Market Volume Share (%), by Country 2025 & 2033
- Figure 67: Egypt GCC/MENA Water and Gas Valves Market Revenue (billion), by Type 2025 & 2033
- Figure 68: Egypt GCC/MENA Water and Gas Valves Market Volume (K Units), by Type 2025 & 2033
- Figure 69: Egypt GCC/MENA Water and Gas Valves Market Revenue Share (%), by Type 2025 & 2033
- Figure 70: Egypt GCC/MENA Water and Gas Valves Market Volume Share (%), by Type 2025 & 2033
- Figure 71: Egypt GCC/MENA Water and Gas Valves Market Revenue (billion), by Application 2025 & 2033
- Figure 72: Egypt GCC/MENA Water and Gas Valves Market Volume (K Units), by Application 2025 & 2033
- Figure 73: Egypt GCC/MENA Water and Gas Valves Market Revenue Share (%), by Application 2025 & 2033
- Figure 74: Egypt GCC/MENA Water and Gas Valves Market Volume Share (%), by Application 2025 & 2033
- Figure 75: Egypt GCC/MENA Water and Gas Valves Market Revenue (billion), by Geography 2025 & 2033
- Figure 76: Egypt GCC/MENA Water and Gas Valves Market Volume (K Units), by Geography 2025 & 2033
- Figure 77: Egypt GCC/MENA Water and Gas Valves Market Revenue Share (%), by Geography 2025 & 2033
- Figure 78: Egypt GCC/MENA Water and Gas Valves Market Volume Share (%), by Geography 2025 & 2033
- Figure 79: Egypt GCC/MENA Water and Gas Valves Market Revenue (billion), by Country 2025 & 2033
- Figure 80: Egypt GCC/MENA Water and Gas Valves Market Volume (K Units), by Country 2025 & 2033
- Figure 81: Egypt GCC/MENA Water and Gas Valves Market Revenue Share (%), by Country 2025 & 2033
- Figure 82: Egypt GCC/MENA Water and Gas Valves Market Volume Share (%), by Country 2025 & 2033
- Figure 83: Iran GCC/MENA Water and Gas Valves Market Revenue (billion), by Type 2025 & 2033
- Figure 84: Iran GCC/MENA Water and Gas Valves Market Volume (K Units), by Type 2025 & 2033
- Figure 85: Iran GCC/MENA Water and Gas Valves Market Revenue Share (%), by Type 2025 & 2033
- Figure 86: Iran GCC/MENA Water and Gas Valves Market Volume Share (%), by Type 2025 & 2033
- Figure 87: Iran GCC/MENA Water and Gas Valves Market Revenue (billion), by Application 2025 & 2033
- Figure 88: Iran GCC/MENA Water and Gas Valves Market Volume (K Units), by Application 2025 & 2033
- Figure 89: Iran GCC/MENA Water and Gas Valves Market Revenue Share (%), by Application 2025 & 2033
- Figure 90: Iran GCC/MENA Water and Gas Valves Market Volume Share (%), by Application 2025 & 2033
- Figure 91: Iran GCC/MENA Water and Gas Valves Market Revenue (billion), by Geography 2025 & 2033
- Figure 92: Iran GCC/MENA Water and Gas Valves Market Volume (K Units), by Geography 2025 & 2033
- Figure 93: Iran GCC/MENA Water and Gas Valves Market Revenue Share (%), by Geography 2025 & 2033
- Figure 94: Iran GCC/MENA Water and Gas Valves Market Volume Share (%), by Geography 2025 & 2033
- Figure 95: Iran GCC/MENA Water and Gas Valves Market Revenue (billion), by Country 2025 & 2033
- Figure 96: Iran GCC/MENA Water and Gas Valves Market Volume (K Units), by Country 2025 & 2033
- Figure 97: Iran GCC/MENA Water and Gas Valves Market Revenue Share (%), by Country 2025 & 2033
- Figure 98: Iran GCC/MENA Water and Gas Valves Market Volume Share (%), by Country 2025 & 2033
- Figure 99: Iraq GCC/MENA Water and Gas Valves Market Revenue (billion), by Type 2025 & 2033
- Figure 100: Iraq GCC/MENA Water and Gas Valves Market Volume (K Units), by Type 2025 & 2033
- Figure 101: Iraq GCC/MENA Water and Gas Valves Market Revenue Share (%), by Type 2025 & 2033
- Figure 102: Iraq GCC/MENA Water and Gas Valves Market Volume Share (%), by Type 2025 & 2033
- Figure 103: Iraq GCC/MENA Water and Gas Valves Market Revenue (billion), by Application 2025 & 2033
- Figure 104: Iraq GCC/MENA Water and Gas Valves Market Volume (K Units), by Application 2025 & 2033
- Figure 105: Iraq GCC/MENA Water and Gas Valves Market Revenue Share (%), by Application 2025 & 2033
- Figure 106: Iraq GCC/MENA Water and Gas Valves Market Volume Share (%), by Application 2025 & 2033
- Figure 107: Iraq GCC/MENA Water and Gas Valves Market Revenue (billion), by Geography 2025 & 2033
- Figure 108: Iraq GCC/MENA Water and Gas Valves Market Volume (K Units), by Geography 2025 & 2033
- Figure 109: Iraq GCC/MENA Water and Gas Valves Market Revenue Share (%), by Geography 2025 & 2033
- Figure 110: Iraq GCC/MENA Water and Gas Valves Market Volume Share (%), by Geography 2025 & 2033
- Figure 111: Iraq GCC/MENA Water and Gas Valves Market Revenue (billion), by Country 2025 & 2033
- Figure 112: Iraq GCC/MENA Water and Gas Valves Market Volume (K Units), by Country 2025 & 2033
- Figure 113: Iraq GCC/MENA Water and Gas Valves Market Revenue Share (%), by Country 2025 & 2033
- Figure 114: Iraq GCC/MENA Water and Gas Valves Market Volume Share (%), by Country 2025 & 2033
- Figure 115: Rest of GCC and North Africa GCC/MENA Water and Gas Valves Market Revenue (billion), by Type 2025 & 2033
- Figure 116: Rest of GCC and North Africa GCC/MENA Water and Gas Valves Market Volume (K Units), by Type 2025 & 2033
- Figure 117: Rest of GCC and North Africa GCC/MENA Water and Gas Valves Market Revenue Share (%), by Type 2025 & 2033
- Figure 118: Rest of GCC and North Africa GCC/MENA Water and Gas Valves Market Volume Share (%), by Type 2025 & 2033
- Figure 119: Rest of GCC and North Africa GCC/MENA Water and Gas Valves Market Revenue (billion), by Application 2025 & 2033
- Figure 120: Rest of GCC and North Africa GCC/MENA Water and Gas Valves Market Volume (K Units), by Application 2025 & 2033
- Figure 121: Rest of GCC and North Africa GCC/MENA Water and Gas Valves Market Revenue Share (%), by Application 2025 & 2033
- Figure 122: Rest of GCC and North Africa GCC/MENA Water and Gas Valves Market Volume Share (%), by Application 2025 & 2033
- Figure 123: Rest of GCC and North Africa GCC/MENA Water and Gas Valves Market Revenue (billion), by Geography 2025 & 2033
- Figure 124: Rest of GCC and North Africa GCC/MENA Water and Gas Valves Market Volume (K Units), by Geography 2025 & 2033
- Figure 125: Rest of GCC and North Africa GCC/MENA Water and Gas Valves Market Revenue Share (%), by Geography 2025 & 2033
- Figure 126: Rest of GCC and North Africa GCC/MENA Water and Gas Valves Market Volume Share (%), by Geography 2025 & 2033
- Figure 127: Rest of GCC and North Africa GCC/MENA Water and Gas Valves Market Revenue (billion), by Country 2025 & 2033
- Figure 128: Rest of GCC and North Africa GCC/MENA Water and Gas Valves Market Volume (K Units), by Country 2025 & 2033
- Figure 129: Rest of GCC and North Africa GCC/MENA Water and Gas Valves Market Revenue Share (%), by Country 2025 & 2033
- Figure 130: Rest of GCC and North Africa GCC/MENA Water and Gas Valves Market Volume Share (%), by Country 2025 & 2033
List of Tables
- Table 1: Global GCC/MENA Water and Gas Valves Market Revenue billion Forecast, by Type 2020 & 2033
- Table 2: Global GCC/MENA Water and Gas Valves Market Volume K Units Forecast, by Type 2020 & 2033
- Table 3: Global GCC/MENA Water and Gas Valves Market Revenue billion Forecast, by Application 2020 & 2033
- Table 4: Global GCC/MENA Water and Gas Valves Market Volume K Units Forecast, by Application 2020 & 2033
- Table 5: Global GCC/MENA Water and Gas Valves Market Revenue billion Forecast, by Geography 2020 & 2033
- Table 6: Global GCC/MENA Water and Gas Valves Market Volume K Units Forecast, by Geography 2020 & 2033
- Table 7: Global GCC/MENA Water and Gas Valves Market Revenue billion Forecast, by Region 2020 & 2033
- Table 8: Global GCC/MENA Water and Gas Valves Market Volume K Units Forecast, by Region 2020 & 2033
- Table 9: Global GCC/MENA Water and Gas Valves Market Revenue billion Forecast, by Type 2020 & 2033
- Table 10: Global GCC/MENA Water and Gas Valves Market Volume K Units Forecast, by Type 2020 & 2033
- Table 11: Global GCC/MENA Water and Gas Valves Market Revenue billion Forecast, by Application 2020 & 2033
- Table 12: Global GCC/MENA Water and Gas Valves Market Volume K Units Forecast, by Application 2020 & 2033
- Table 13: Global GCC/MENA Water and Gas Valves Market Revenue billion Forecast, by Geography 2020 & 2033
- Table 14: Global GCC/MENA Water and Gas Valves Market Volume K Units Forecast, by Geography 2020 & 2033
- Table 15: Global GCC/MENA Water and Gas Valves Market Revenue billion Forecast, by Country 2020 & 2033
- Table 16: Global GCC/MENA Water and Gas Valves Market Volume K Units Forecast, by Country 2020 & 2033
- Table 17: Global GCC/MENA Water and Gas Valves Market Revenue billion Forecast, by Type 2020 & 2033
- Table 18: Global GCC/MENA Water and Gas Valves Market Volume K Units Forecast, by Type 2020 & 2033
- Table 19: Global GCC/MENA Water and Gas Valves Market Revenue billion Forecast, by Application 2020 & 2033
- Table 20: Global GCC/MENA Water and Gas Valves Market Volume K Units Forecast, by Application 2020 & 2033
- Table 21: Global GCC/MENA Water and Gas Valves Market Revenue billion Forecast, by Geography 2020 & 2033
- Table 22: Global GCC/MENA Water and Gas Valves Market Volume K Units Forecast, by Geography 2020 & 2033
- Table 23: Global GCC/MENA Water and Gas Valves Market Revenue billion Forecast, by Country 2020 & 2033
- Table 24: Global GCC/MENA Water and Gas Valves Market Volume K Units Forecast, by Country 2020 & 2033
- Table 25: Global GCC/MENA Water and Gas Valves Market Revenue billion Forecast, by Type 2020 & 2033
- Table 26: Global GCC/MENA Water and Gas Valves Market Volume K Units Forecast, by Type 2020 & 2033
- Table 27: Global GCC/MENA Water and Gas Valves Market Revenue billion Forecast, by Application 2020 & 2033
- Table 28: Global GCC/MENA Water and Gas Valves Market Volume K Units Forecast, by Application 2020 & 2033
- Table 29: Global GCC/MENA Water and Gas Valves Market Revenue billion Forecast, by Geography 2020 & 2033
- Table 30: Global GCC/MENA Water and Gas Valves Market Volume K Units Forecast, by Geography 2020 & 2033
- Table 31: Global GCC/MENA Water and Gas Valves Market Revenue billion Forecast, by Country 2020 & 2033
- Table 32: Global GCC/MENA Water and Gas Valves Market Volume K Units Forecast, by Country 2020 & 2033
- Table 33: Global GCC/MENA Water and Gas Valves Market Revenue billion Forecast, by Type 2020 & 2033
- Table 34: Global GCC/MENA Water and Gas Valves Market Volume K Units Forecast, by Type 2020 & 2033
- Table 35: Global GCC/MENA Water and Gas Valves Market Revenue billion Forecast, by Application 2020 & 2033
- Table 36: Global GCC/MENA Water and Gas Valves Market Volume K Units Forecast, by Application 2020 & 2033
- Table 37: Global GCC/MENA Water and Gas Valves Market Revenue billion Forecast, by Geography 2020 & 2033
- Table 38: Global GCC/MENA Water and Gas Valves Market Volume K Units Forecast, by Geography 2020 & 2033
- Table 39: Global GCC/MENA Water and Gas Valves Market Revenue billion Forecast, by Country 2020 & 2033
- Table 40: Global GCC/MENA Water and Gas Valves Market Volume K Units Forecast, by Country 2020 & 2033
- Table 41: Global GCC/MENA Water and Gas Valves Market Revenue billion Forecast, by Type 2020 & 2033
- Table 42: Global GCC/MENA Water and Gas Valves Market Volume K Units Forecast, by Type 2020 & 2033
- Table 43: Global GCC/MENA Water and Gas Valves Market Revenue billion Forecast, by Application 2020 & 2033
- Table 44: Global GCC/MENA Water and Gas Valves Market Volume K Units Forecast, by Application 2020 & 2033
- Table 45: Global GCC/MENA Water and Gas Valves Market Revenue billion Forecast, by Geography 2020 & 2033
- Table 46: Global GCC/MENA Water and Gas Valves Market Volume K Units Forecast, by Geography 2020 & 2033
- Table 47: Global GCC/MENA Water and Gas Valves Market Revenue billion Forecast, by Country 2020 & 2033
- Table 48: Global GCC/MENA Water and Gas Valves Market Volume K Units Forecast, by Country 2020 & 2033
- Table 49: Global GCC/MENA Water and Gas Valves Market Revenue billion Forecast, by Type 2020 & 2033
- Table 50: Global GCC/MENA Water and Gas Valves Market Volume K Units Forecast, by Type 2020 & 2033
- Table 51: Global GCC/MENA Water and Gas Valves Market Revenue billion Forecast, by Application 2020 & 2033
- Table 52: Global GCC/MENA Water and Gas Valves Market Volume K Units Forecast, by Application 2020 & 2033
- Table 53: Global GCC/MENA Water and Gas Valves Market Revenue billion Forecast, by Geography 2020 & 2033
- Table 54: Global GCC/MENA Water and Gas Valves Market Volume K Units Forecast, by Geography 2020 & 2033
- Table 55: Global GCC/MENA Water and Gas Valves Market Revenue billion Forecast, by Country 2020 & 2033
- Table 56: Global GCC/MENA Water and Gas Valves Market Volume K Units Forecast, by Country 2020 & 2033
- Table 57: Global GCC/MENA Water and Gas Valves Market Revenue billion Forecast, by Type 2020 & 2033
- Table 58: Global GCC/MENA Water and Gas Valves Market Volume K Units Forecast, by Type 2020 & 2033
- Table 59: Global GCC/MENA Water and Gas Valves Market Revenue billion Forecast, by Application 2020 & 2033
- Table 60: Global GCC/MENA Water and Gas Valves Market Volume K Units Forecast, by Application 2020 & 2033
- Table 61: Global GCC/MENA Water and Gas Valves Market Revenue billion Forecast, by Geography 2020 & 2033
- Table 62: Global GCC/MENA Water and Gas Valves Market Volume K Units Forecast, by Geography 2020 & 2033
- Table 63: Global GCC/MENA Water and Gas Valves Market Revenue billion Forecast, by Country 2020 & 2033
- Table 64: Global GCC/MENA Water and Gas Valves Market Volume K Units Forecast, by Country 2020 & 2033
- Table 65: Global GCC/MENA Water and Gas Valves Market Revenue billion Forecast, by Type 2020 & 2033
- Table 66: Global GCC/MENA Water and Gas Valves Market Volume K Units Forecast, by Type 2020 & 2033
- Table 67: Global GCC/MENA Water and Gas Valves Market Revenue billion Forecast, by Application 2020 & 2033
- Table 68: Global GCC/MENA Water and Gas Valves Market Volume K Units Forecast, by Application 2020 & 2033
- Table 69: Global GCC/MENA Water and Gas Valves Market Revenue billion Forecast, by Geography 2020 & 2033
- Table 70: Global GCC/MENA Water and Gas Valves Market Volume K Units Forecast, by Geography 2020 & 2033
- Table 71: Global GCC/MENA Water and Gas Valves Market Revenue billion Forecast, by Country 2020 & 2033
- Table 72: Global GCC/MENA Water and Gas Valves Market Volume K Units Forecast, by Country 2020 & 2033
Frequently Asked Questions
1. What is the projected Compound Annual Growth Rate (CAGR) of the GCC/MENA Water and Gas Valves Market?
The projected CAGR is approximately 5.12%.
2. Which companies are prominent players in the GCC/MENA Water and Gas Valves Market?
Key companies in the market include Honeywell International Inc, Danfoss AS, Baker Hughes a GE Company, Saint-Gobain, The Weir Group PLC, Flowserve Corporation, Georg Fischer Ltd, Emerson Electric Co, IMI Critical Engineering, Crane Co, AVK Gulf And Watecom International Water Network LLC, Schlumberger Limited, TechnipFMC PLC, Alfa Laval AB, Circor International Inc.
3. What are the main segments of the GCC/MENA Water and Gas Valves Market?
The market segments include Type, Application, Geography.
4. Can you provide details about the market size?
The market size is estimated to be USD 11.69 billion as of 2022.
5. What are some drivers contributing to market growth?
Expanding Power Generation Sector in GCC Countries; Surge in Oil Refining in the MEA Region.
6. What are the notable trends driving market growth?
Increasing Demand from Industrial Applications.
7. Are there any restraints impacting market growth?
Health Concerns and Stringent Environmental Regulations; Impact of COVID-19 on the Market Studied.
8. Can you provide examples of recent developments in the market?
N/A
9. What pricing options are available for accessing the report?
Pricing options include single-user, multi-user, and enterprise licenses priced at USD 4750, USD 5250, and USD 8750 respectively.
10. Is the market size provided in terms of value or volume?
The market size is provided in terms of value, measured in billion and volume, measured in K Units.
11. Are there any specific market keywords associated with the report?
Yes, the market keyword associated with the report is "GCC/MENA Water and Gas Valves Market," which aids in identifying and referencing the specific market segment covered.
12. How do I determine which pricing option suits my needs best?
The pricing options vary based on user requirements and access needs. Individual users may opt for single-user licenses, while businesses requiring broader access may choose multi-user or enterprise licenses for cost-effective access to the report.
13. Are there any additional resources or data provided in the GCC/MENA Water and Gas Valves Market report?
While the report offers comprehensive insights, it's advisable to review the specific contents or supplementary materials provided to ascertain if additional resources or data are available.
14. How can I stay updated on further developments or reports in the GCC/MENA Water and Gas Valves Market?
To stay informed about further developments, trends, and reports in the GCC/MENA Water and Gas Valves Market, consider subscribing to industry newsletters, following relevant companies and organizations, or regularly checking reputable industry news sources and publications.
Methodology
Step 1 - Identification of Relevant Samples Size from Population Database


Step 2 - Approaches for Defining Global Market Size (Value, Volume* & Price*)

Note*: In applicable scenarios
Step 3 - Data Sources
Primary Research
- Web Analytics
- Survey Reports
- Research Institute
- Latest Research Reports
- Opinion Leaders
Secondary Research
- Annual Reports
- White Paper
- Latest Press Release
- Industry Association
- Paid Database
- Investor Presentations

Step 4 - Data Triangulation
Involves using different sources of information in order to increase the validity of a study
These sources are likely to be stakeholders in a program - participants, other researchers, program staff, other community members, and so on.
Then we put all data in single framework & apply various statistical tools to find out the dynamic on the market.
During the analysis stage, feedback from the stakeholder groups would be compared to determine areas of agreement as well as areas of divergence