
Key Insights
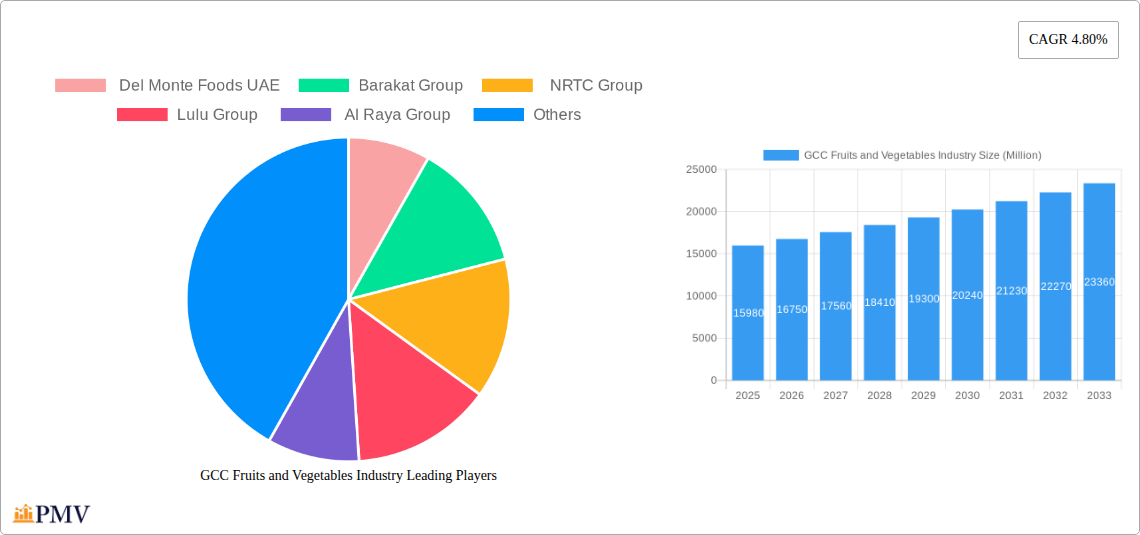
The GCC fruits and vegetables market, valued at $15.98 billion in 2025, is experiencing robust growth, projected to expand at a Compound Annual Growth Rate (CAGR) of 4.80% from 2025 to 2033. This growth is fueled by several key factors. Rising disposable incomes within the GCC region are driving increased consumer spending on fresh produce, particularly among health-conscious individuals seeking nutritious and convenient options. The burgeoning food service industry, encompassing restaurants, cafes, and catering services, is another significant driver, demanding substantial volumes of fresh fruits and vegetables. Furthermore, the increasing adoption of e-commerce platforms and organized retail channels like supermarkets and hypermarkets is facilitating market expansion, offering wider product availability and improved consumer access. Government initiatives promoting agricultural diversification and food security within the region also contribute positively to the market's growth trajectory.
However, challenges remain. Fluctuations in global produce prices, due to factors such as weather patterns and geopolitical events, can impact profitability and create price volatility for consumers. Maintaining the cold chain throughout the supply chain is crucial to prevent spoilage and wastage, requiring significant investment in infrastructure and technology. Competition within the market is intense, with both established players like Lulu Group and Al-Futtaim Group and smaller, specialized companies vying for market share. Successfully navigating these challenges requires efficient supply chain management, a focus on product quality and freshness, and a robust marketing strategy targeting specific consumer segments. The market segmentation reveals a diverse landscape, with fresh produce dominating, followed by processed options. Supermarkets and hypermarkets currently hold a larger share of distribution channels, yet the e-commerce segment shows significant potential for future growth. Household consumption remains the largest end-use segment, reflecting the importance of fresh produce in daily diets.
GCC Fruits and Vegetables Industry: Market Analysis & Forecast (2019-2033)
This comprehensive report provides a detailed analysis of the GCC fruits and vegetables industry, covering market size, segmentation, competitive landscape, and future growth prospects. The study period spans from 2019 to 2033, with 2025 as the base and estimated year. This report is essential for businesses, investors, and stakeholders seeking to understand and capitalize on opportunities within this dynamic sector.
GCC Fruits and Vegetables Industry Market Structure & Competitive Dynamics
The GCC fruits and vegetables market is characterized by a moderately concentrated structure with several large players and a significant number of smaller, regional operators. Market share is largely determined by factors such as distribution network reach, brand recognition, and sourcing capabilities. Key players such as Del Monte Foods UAE, Barakat Group, NRTC Group, Lulu Group, Al Raya Group, Al-Futtaim Group, Al Bakrawe Group, Fresh Fruits Company, SPAR, and Carrefour dominate various segments. The industry is witnessing increasing consolidation through mergers and acquisitions (M&A), driven by the need for economies of scale and expansion into new markets. Recent M&A deals have involved values ranging from xx Million to xx Million, depending on the size and scope of the acquisition.
- Market Concentration: The market exhibits moderate concentration, with the top five players holding an estimated xx% market share in 2024.
- Innovation Ecosystems: While innovation is present, it's primarily focused on supply chain efficiency and improved retail experiences rather than radical product innovation.
- Regulatory Frameworks: Government regulations pertaining to food safety, labeling, and import/export significantly impact market dynamics.
- Product Substitutes: The primary substitutes are processed foods and imported fruits and vegetables, exerting competitive pressure on the fresh produce segment.
- End-User Trends: Growing health consciousness and rising disposable incomes fuel demand for premium and organic products.
- M&A Activity: The moderate pace of consolidation signals a gradual shift towards larger players dominating market share.
GCC Fruits and Vegetables Industry Industry Trends & Insights
The GCC fruits and vegetables market demonstrates robust growth, driven by factors such as a rising population, increasing urbanization, changing dietary habits, and growing tourism. The market exhibited a Compound Annual Growth Rate (CAGR) of xx% during the historical period (2019-2024) and is projected to maintain a CAGR of xx% during the forecast period (2025-2033). Market penetration of processed fruits and vegetables is high, while e-commerce channels are experiencing rapid growth. Consumer preferences are shifting towards healthier, convenient, and sustainably sourced products. Competitive dynamics are marked by intense price competition and the expansion of large retail chains.
Technological advancements in areas like cold chain logistics, traceability, and packaging solutions are further enhancing the market's efficiency and sustainability. However, challenges remain in terms of addressing food waste and improving the efficiency of the overall value chain. The growing trend towards organized retail and the expansion of e-commerce platforms continue to impact market dynamics.

Dominant Markets & Segments in GCC Fruits and Vegetables Industry
The GCC region as a whole demonstrates strong growth, with specific countries like the UAE and Saudi Arabia showing particularly robust performance due to significant population growth and strong economic activity.
Leading Region/Country: The UAE and Saudi Arabia are the dominant markets within the GCC, accounting for a combined xx% of the total market value.
Leading Segments:
- Product Type: Fresh fruits dominate, followed by fresh vegetables and processed products. Key drivers include the preference for fresh produce in the region, coupled with increasing demand for convenient processed options.
- Distribution Channel: Supermarkets and hypermarkets represent the largest distribution channel due to organized retail expansion, followed by traditional markets. E-commerce is rapidly emerging as a significant channel.
- End-Use: Household consumption accounts for the largest portion of demand, while food processing, restaurants, and catering sectors are also important end-use segments.
Key Drivers:
- Economic Growth: Strong economic growth in the GCC fuels increased disposable incomes, leading to higher spending on food.
- Population Growth: The GCC region is experiencing significant population growth, driving demand for fruits and vegetables.
- Infrastructure Development: Investments in cold chain infrastructure and logistics significantly contribute to market growth.
- Government Initiatives: Initiatives to promote healthy eating and food security bolster the demand.
GCC Fruits and Vegetables Industry Product Innovations
Recent product innovations have focused on extending shelf life, improving packaging for enhanced freshness, and offering ready-to-eat and convenient options. Technological advancements in cold chain logistics and packaging have played a vital role in enhancing product quality and availability. The market has witnessed increased emphasis on organic and sustainably sourced products, aligning with consumer trends. Furthermore, innovations in processing techniques are enhancing the appeal and nutritional value of processed fruits and vegetables.
Report Segmentation & Scope
This report segments the GCC fruits and vegetables market across multiple dimensions:
Product Type: Fresh Fruits, Fresh Vegetables, Processed Fruits and Vegetables. Growth projections vary across segments, with processed fruits and vegetables experiencing faster growth than fresh products.
Distribution Channel: Supermarkets and Hypermarkets, Traditional Markets, E-commerce, Wholesale Markets. E-commerce is expected to demonstrate the highest growth rate.
End-Use: Household Consumption, Food Processing, Restaurants and Catering. Household consumption remains the dominant segment, but the food service sector shows significant growth potential.
Key Drivers of GCC Fruits and Vegetables Industry Growth
The GCC fruits and vegetables industry’s growth is propelled by several factors: rising disposable incomes leading to increased spending on premium and diverse food options; a growing population driving higher overall demand; and favorable government policies supporting agricultural development and food security. Technological advancements in cold chain logistics and packaging also play a crucial role in enhancing product quality and extending shelf life.
Challenges in the GCC Fruits and Vegetables Industry Sector
The sector faces several challenges, including seasonality of production, dependence on imports, and high logistics costs. Food waste remains a significant issue, representing a substantial economic loss and impacting sustainability. Intense competition, particularly among supermarkets and hypermarkets, influences pricing and profitability. Regulatory hurdles and compliance requirements also pose operational difficulties for many businesses.
Leading Players in the GCC Fruits and Vegetables Industry Market
- Del Monte Foods UAE
- Barakat Group
- NRTC Group
- Lulu Group
- Al Raya Group
- Al-Futtaim Group
- Al Bakrawe Group
- Fresh Fruits Company
- SPAR
- Carrefour
Key Developments in GCC Fruits and Vegetables Industry Sector
- February 2024: Lulu Group opened its 23rd hypermarket in Doha Mall, Qatar, featuring an extensive fresh produce section and launching the "Lulu Happiness" loyalty program. This significantly expands Lulu's reach and enhances customer loyalty.
- February 2024: SPAR opened its 28th outlet in Al Muna Bousher, Oman, further strengthening its presence in the region and expanding access to fresh produce.
- February 2024: Carrefour launched its "Choose Better" program in Expo City, promoting healthier and sustainable choices. This initiative strengthens Carrefour's brand image and caters to consumer preferences.
Strategic GCC Fruits and Vegetables Industry Market Outlook
The GCC fruits and vegetables market presents significant opportunities for growth. Strategic investments in cold chain infrastructure, technological advancements in processing and packaging, and the development of sustainable sourcing practices will be key to unlocking future potential. Focusing on consumer preferences for healthy, convenient, and sustainably produced products will be crucial for success. The expansion of e-commerce and the ongoing growth of organized retail offer further avenues for market expansion.
GCC Fruits and Vegetables Industry Segmentation
- 1. Production Analysis
- 2. Consumption Analysis
- 3. Import Market Analysis (Value & Volume)
- 4. Export Market Analysis (Value & Volume)
- 5. Price Trend Analysis
GCC Fruits and Vegetables Industry Segmentation By Geography
-
1. United Arab Emirates
- 1.1. Fruits
- 1.2. Vegetables
-
2. Bahrain
- 2.1. Fruits
- 2.2. Vegetables
-
3. Kuwait
- 3.1. Fruits
- 3.2. Vegetables
-
4. Oman
- 4.1. Fruits
- 4.2. Vegetables
-
5. Qatar
- 5.1. Fruits
- 5.2. Vegetables
-
6. Saudi Arabia
- 6.1. Fruits
- 6.2. Vegetables

GCC Fruits and Vegetables Industry REPORT HIGHLIGHTS
| Aspects | Details |
|---|---|
| Study Period | 2019-2033 |
| Base Year | 2024 |
| Estimated Year | 2025 |
| Forecast Period | 2025-2033 |
| Historical Period | 2019-2024 |
| Growth Rate | CAGR of 4.80% from 2019-2033 |
| Segmentation |
|
Table of Contents
- 1. Introduction
- 1.1. Research Scope
- 1.2. Market Segmentation
- 1.3. Research Methodology
- 1.4. Definitions and Assumptions
- 2. Executive Summary
- 2.1. Introduction
- 3. Market Dynamics
- 3.1. Introduction
- 3.2. Market Drivers
- 3.2.1. Increasing Adoption of Technology in Horticulture; Government Initiatives for Self-reliance in Vegetable and Fruit Farming
- 3.3. Market Restrains
- 3.3.1. Limited Resource Availability and Unfavourable Climatic Condition; Increasing Reliance on Imports for Domestic Supply
- 3.4. Market Trends
- 3.4.1. Increasing Adoption of Technology in Horticulture
- 4. Market Factor Analysis
- 4.1. Porters Five Forces
- 4.2. Supply/Value Chain
- 4.3. PESTEL analysis
- 4.4. Market Entropy
- 4.5. Patent/Trademark Analysis
- 5. Global GCC Fruits and Vegetables Industry Analysis, Insights and Forecast, 2019-2031
- 5.1. Market Analysis, Insights and Forecast - by Production Analysis
- 5.2. Market Analysis, Insights and Forecast - by Consumption Analysis
- 5.3. Market Analysis, Insights and Forecast - by Import Market Analysis (Value & Volume)
- 5.4. Market Analysis, Insights and Forecast - by Export Market Analysis (Value & Volume)
- 5.5. Market Analysis, Insights and Forecast - by Price Trend Analysis
- 5.6. Market Analysis, Insights and Forecast - by Region
- 5.6.1. United Arab Emirates
- 5.6.2. Bahrain
- 5.6.3. Kuwait
- 5.6.4. Oman
- 5.6.5. Qatar
- 5.6.6. Saudi Arabia
- 5.1. Market Analysis, Insights and Forecast - by Production Analysis
- 6. United Arab Emirates GCC Fruits and Vegetables Industry Analysis, Insights and Forecast, 2019-2031
- 6.1. Market Analysis, Insights and Forecast - by Production Analysis
- 6.2. Market Analysis, Insights and Forecast - by Consumption Analysis
- 6.3. Market Analysis, Insights and Forecast - by Import Market Analysis (Value & Volume)
- 6.4. Market Analysis, Insights and Forecast - by Export Market Analysis (Value & Volume)
- 6.5. Market Analysis, Insights and Forecast - by Price Trend Analysis
- 6.1. Market Analysis, Insights and Forecast - by Production Analysis
- 7. Bahrain GCC Fruits and Vegetables Industry Analysis, Insights and Forecast, 2019-2031
- 7.1. Market Analysis, Insights and Forecast - by Production Analysis
- 7.2. Market Analysis, Insights and Forecast - by Consumption Analysis
- 7.3. Market Analysis, Insights and Forecast - by Import Market Analysis (Value & Volume)
- 7.4. Market Analysis, Insights and Forecast - by Export Market Analysis (Value & Volume)
- 7.5. Market Analysis, Insights and Forecast - by Price Trend Analysis
- 7.1. Market Analysis, Insights and Forecast - by Production Analysis
- 8. Kuwait GCC Fruits and Vegetables Industry Analysis, Insights and Forecast, 2019-2031
- 8.1. Market Analysis, Insights and Forecast - by Production Analysis
- 8.2. Market Analysis, Insights and Forecast - by Consumption Analysis
- 8.3. Market Analysis, Insights and Forecast - by Import Market Analysis (Value & Volume)
- 8.4. Market Analysis, Insights and Forecast - by Export Market Analysis (Value & Volume)
- 8.5. Market Analysis, Insights and Forecast - by Price Trend Analysis
- 8.1. Market Analysis, Insights and Forecast - by Production Analysis
- 9. Oman GCC Fruits and Vegetables Industry Analysis, Insights and Forecast, 2019-2031
- 9.1. Market Analysis, Insights and Forecast - by Production Analysis
- 9.2. Market Analysis, Insights and Forecast - by Consumption Analysis
- 9.3. Market Analysis, Insights and Forecast - by Import Market Analysis (Value & Volume)
- 9.4. Market Analysis, Insights and Forecast - by Export Market Analysis (Value & Volume)
- 9.5. Market Analysis, Insights and Forecast - by Price Trend Analysis
- 9.1. Market Analysis, Insights and Forecast - by Production Analysis
- 10. Qatar GCC Fruits and Vegetables Industry Analysis, Insights and Forecast, 2019-2031
- 10.1. Market Analysis, Insights and Forecast - by Production Analysis
- 10.2. Market Analysis, Insights and Forecast - by Consumption Analysis
- 10.3. Market Analysis, Insights and Forecast - by Import Market Analysis (Value & Volume)
- 10.4. Market Analysis, Insights and Forecast - by Export Market Analysis (Value & Volume)
- 10.5. Market Analysis, Insights and Forecast - by Price Trend Analysis
- 10.1. Market Analysis, Insights and Forecast - by Production Analysis
- 11. Saudi Arabia GCC Fruits and Vegetables Industry Analysis, Insights and Forecast, 2019-2031
- 11.1. Market Analysis, Insights and Forecast - by Production Analysis
- 11.2. Market Analysis, Insights and Forecast - by Consumption Analysis
- 11.3. Market Analysis, Insights and Forecast - by Import Market Analysis (Value & Volume)
- 11.4. Market Analysis, Insights and Forecast - by Export Market Analysis (Value & Volume)
- 11.5. Market Analysis, Insights and Forecast - by Price Trend Analysis
- 11.1. Market Analysis, Insights and Forecast - by Production Analysis
- 12. South America GCC Fruits and Vegetables Industry Analysis, Insights and Forecast, 2019-2031
- 12.1. Market Analysis, Insights and Forecast - By Country/Sub-region
- 12.1.1 Brazil
- 12.1.2 Argentina
- 12.1.3 Rest of South America
- 13. North America GCC Fruits and Vegetables Industry Analysis, Insights and Forecast, 2019-2031
- 13.1. Market Analysis, Insights and Forecast - By Country/Sub-region
- 13.1.1 United States
- 13.1.2 Canada
- 13.1.3 Mexico
- 14. Europe GCC Fruits and Vegetables Industry Analysis, Insights and Forecast, 2019-2031
- 14.1. Market Analysis, Insights and Forecast - By Country/Sub-region
- 14.1.1 Germany
- 14.1.2 France
- 14.1.3 Italy
- 14.1.4 United Kingdom
- 14.1.5 Netherlands
- 14.1.6 Rest of Europe
- 15. Asia Pacific GCC Fruits and Vegetables Industry Analysis, Insights and Forecast, 2019-2031
- 15.1. Market Analysis, Insights and Forecast - By Country/Sub-region
- 15.1.1 China
- 15.1.2 Japan
- 15.1.3 India
- 15.1.4 South Korea
- 15.1.5 Taiwan
- 15.1.6 Australia
- 15.1.7 Rest of Asia-Pacific
- 16. MEA GCC Fruits and Vegetables Industry Analysis, Insights and Forecast, 2019-2031
- 16.1. Market Analysis, Insights and Forecast - By Country/Sub-region
- 16.1.1 Middle East
- 16.1.2 Africa
- 17. Competitive Analysis
- 17.1. Global Market Share Analysis 2024
- 17.2. Company Profiles
- 17.2.1 Del Monte Foods UAE
- 17.2.1.1. Overview
- 17.2.1.2. Products
- 17.2.1.3. SWOT Analysis
- 17.2.1.4. Recent Developments
- 17.2.1.5. Financials (Based on Availability)
- 17.2.2 Barakat Group
- 17.2.2.1. Overview
- 17.2.2.2. Products
- 17.2.2.3. SWOT Analysis
- 17.2.2.4. Recent Developments
- 17.2.2.5. Financials (Based on Availability)
- 17.2.3 NRTC Group
- 17.2.3.1. Overview
- 17.2.3.2. Products
- 17.2.3.3. SWOT Analysis
- 17.2.3.4. Recent Developments
- 17.2.3.5. Financials (Based on Availability)
- 17.2.4 Lulu Group
- 17.2.4.1. Overview
- 17.2.4.2. Products
- 17.2.4.3. SWOT Analysis
- 17.2.4.4. Recent Developments
- 17.2.4.5. Financials (Based on Availability)
- 17.2.5 Al Raya Group
- 17.2.5.1. Overview
- 17.2.5.2. Products
- 17.2.5.3. SWOT Analysis
- 17.2.5.4. Recent Developments
- 17.2.5.5. Financials (Based on Availability)
- 17.2.6 Al-Futtaim Group
- 17.2.6.1. Overview
- 17.2.6.2. Products
- 17.2.6.3. SWOT Analysis
- 17.2.6.4. Recent Developments
- 17.2.6.5. Financials (Based on Availability)
- 17.2.7 Al Bakrawe Group
- 17.2.7.1. Overview
- 17.2.7.2. Products
- 17.2.7.3. SWOT Analysis
- 17.2.7.4. Recent Developments
- 17.2.7.5. Financials (Based on Availability)
- 17.2.8 Fresh Fruits Company
- 17.2.8.1. Overview
- 17.2.8.2. Products
- 17.2.8.3. SWOT Analysis
- 17.2.8.4. Recent Developments
- 17.2.8.5. Financials (Based on Availability)
- 17.2.9 SPAR
- 17.2.9.1. Overview
- 17.2.9.2. Products
- 17.2.9.3. SWOT Analysis
- 17.2.9.4. Recent Developments
- 17.2.9.5. Financials (Based on Availability)
- 17.2.10 Carrefour
- 17.2.10.1. Overview
- 17.2.10.2. Products
- 17.2.10.3. SWOT Analysis
- 17.2.10.4. Recent Developments
- 17.2.10.5. Financials (Based on Availability)
- 17.2.1 Del Monte Foods UAE
List of Figures
- Figure 1: Global GCC Fruits and Vegetables Industry Revenue Breakdown (Million, %) by Region 2024 & 2032
- Figure 2: Global GCC Fruits and Vegetables Industry Volume Breakdown (Kiloton, %) by Region 2024 & 2032
- Figure 3: South America GCC Fruits and Vegetables Industry Revenue (Million), by Country 2024 & 2032
- Figure 4: South America GCC Fruits and Vegetables Industry Volume (Kiloton), by Country 2024 & 2032
- Figure 5: South America GCC Fruits and Vegetables Industry Revenue Share (%), by Country 2024 & 2032
- Figure 6: South America GCC Fruits and Vegetables Industry Volume Share (%), by Country 2024 & 2032
- Figure 7: North America GCC Fruits and Vegetables Industry Revenue (Million), by Country 2024 & 2032
- Figure 8: North America GCC Fruits and Vegetables Industry Volume (Kiloton), by Country 2024 & 2032
- Figure 9: North America GCC Fruits and Vegetables Industry Revenue Share (%), by Country 2024 & 2032
- Figure 10: North America GCC Fruits and Vegetables Industry Volume Share (%), by Country 2024 & 2032
- Figure 11: Europe GCC Fruits and Vegetables Industry Revenue (Million), by Country 2024 & 2032
- Figure 12: Europe GCC Fruits and Vegetables Industry Volume (Kiloton), by Country 2024 & 2032
- Figure 13: Europe GCC Fruits and Vegetables Industry Revenue Share (%), by Country 2024 & 2032
- Figure 14: Europe GCC Fruits and Vegetables Industry Volume Share (%), by Country 2024 & 2032
- Figure 15: Asia Pacific GCC Fruits and Vegetables Industry Revenue (Million), by Country 2024 & 2032
- Figure 16: Asia Pacific GCC Fruits and Vegetables Industry Volume (Kiloton), by Country 2024 & 2032
- Figure 17: Asia Pacific GCC Fruits and Vegetables Industry Revenue Share (%), by Country 2024 & 2032
- Figure 18: Asia Pacific GCC Fruits and Vegetables Industry Volume Share (%), by Country 2024 & 2032
- Figure 19: MEA GCC Fruits and Vegetables Industry Revenue (Million), by Country 2024 & 2032
- Figure 20: MEA GCC Fruits and Vegetables Industry Volume (Kiloton), by Country 2024 & 2032
- Figure 21: MEA GCC Fruits and Vegetables Industry Revenue Share (%), by Country 2024 & 2032
- Figure 22: MEA GCC Fruits and Vegetables Industry Volume Share (%), by Country 2024 & 2032
- Figure 23: United Arab Emirates GCC Fruits and Vegetables Industry Revenue (Million), by Production Analysis 2024 & 2032
- Figure 24: United Arab Emirates GCC Fruits and Vegetables Industry Volume (Kiloton), by Production Analysis 2024 & 2032
- Figure 25: United Arab Emirates GCC Fruits and Vegetables Industry Revenue Share (%), by Production Analysis 2024 & 2032
- Figure 26: United Arab Emirates GCC Fruits and Vegetables Industry Volume Share (%), by Production Analysis 2024 & 2032
- Figure 27: United Arab Emirates GCC Fruits and Vegetables Industry Revenue (Million), by Consumption Analysis 2024 & 2032
- Figure 28: United Arab Emirates GCC Fruits and Vegetables Industry Volume (Kiloton), by Consumption Analysis 2024 & 2032
- Figure 29: United Arab Emirates GCC Fruits and Vegetables Industry Revenue Share (%), by Consumption Analysis 2024 & 2032
- Figure 30: United Arab Emirates GCC Fruits and Vegetables Industry Volume Share (%), by Consumption Analysis 2024 & 2032
- Figure 31: United Arab Emirates GCC Fruits and Vegetables Industry Revenue (Million), by Import Market Analysis (Value & Volume) 2024 & 2032
- Figure 32: United Arab Emirates GCC Fruits and Vegetables Industry Volume (Kiloton), by Import Market Analysis (Value & Volume) 2024 & 2032
- Figure 33: United Arab Emirates GCC Fruits and Vegetables Industry Revenue Share (%), by Import Market Analysis (Value & Volume) 2024 & 2032
- Figure 34: United Arab Emirates GCC Fruits and Vegetables Industry Volume Share (%), by Import Market Analysis (Value & Volume) 2024 & 2032
- Figure 35: United Arab Emirates GCC Fruits and Vegetables Industry Revenue (Million), by Export Market Analysis (Value & Volume) 2024 & 2032
- Figure 36: United Arab Emirates GCC Fruits and Vegetables Industry Volume (Kiloton), by Export Market Analysis (Value & Volume) 2024 & 2032
- Figure 37: United Arab Emirates GCC Fruits and Vegetables Industry Revenue Share (%), by Export Market Analysis (Value & Volume) 2024 & 2032
- Figure 38: United Arab Emirates GCC Fruits and Vegetables Industry Volume Share (%), by Export Market Analysis (Value & Volume) 2024 & 2032
- Figure 39: United Arab Emirates GCC Fruits and Vegetables Industry Revenue (Million), by Price Trend Analysis 2024 & 2032
- Figure 40: United Arab Emirates GCC Fruits and Vegetables Industry Volume (Kiloton), by Price Trend Analysis 2024 & 2032
- Figure 41: United Arab Emirates GCC Fruits and Vegetables Industry Revenue Share (%), by Price Trend Analysis 2024 & 2032
- Figure 42: United Arab Emirates GCC Fruits and Vegetables Industry Volume Share (%), by Price Trend Analysis 2024 & 2032
- Figure 43: United Arab Emirates GCC Fruits and Vegetables Industry Revenue (Million), by Country 2024 & 2032
- Figure 44: United Arab Emirates GCC Fruits and Vegetables Industry Volume (Kiloton), by Country 2024 & 2032
- Figure 45: United Arab Emirates GCC Fruits and Vegetables Industry Revenue Share (%), by Country 2024 & 2032
- Figure 46: United Arab Emirates GCC Fruits and Vegetables Industry Volume Share (%), by Country 2024 & 2032
- Figure 47: Bahrain GCC Fruits and Vegetables Industry Revenue (Million), by Production Analysis 2024 & 2032
- Figure 48: Bahrain GCC Fruits and Vegetables Industry Volume (Kiloton), by Production Analysis 2024 & 2032
- Figure 49: Bahrain GCC Fruits and Vegetables Industry Revenue Share (%), by Production Analysis 2024 & 2032
- Figure 50: Bahrain GCC Fruits and Vegetables Industry Volume Share (%), by Production Analysis 2024 & 2032
- Figure 51: Bahrain GCC Fruits and Vegetables Industry Revenue (Million), by Consumption Analysis 2024 & 2032
- Figure 52: Bahrain GCC Fruits and Vegetables Industry Volume (Kiloton), by Consumption Analysis 2024 & 2032
- Figure 53: Bahrain GCC Fruits and Vegetables Industry Revenue Share (%), by Consumption Analysis 2024 & 2032
- Figure 54: Bahrain GCC Fruits and Vegetables Industry Volume Share (%), by Consumption Analysis 2024 & 2032
- Figure 55: Bahrain GCC Fruits and Vegetables Industry Revenue (Million), by Import Market Analysis (Value & Volume) 2024 & 2032
- Figure 56: Bahrain GCC Fruits and Vegetables Industry Volume (Kiloton), by Import Market Analysis (Value & Volume) 2024 & 2032
- Figure 57: Bahrain GCC Fruits and Vegetables Industry Revenue Share (%), by Import Market Analysis (Value & Volume) 2024 & 2032
- Figure 58: Bahrain GCC Fruits and Vegetables Industry Volume Share (%), by Import Market Analysis (Value & Volume) 2024 & 2032
- Figure 59: Bahrain GCC Fruits and Vegetables Industry Revenue (Million), by Export Market Analysis (Value & Volume) 2024 & 2032
- Figure 60: Bahrain GCC Fruits and Vegetables Industry Volume (Kiloton), by Export Market Analysis (Value & Volume) 2024 & 2032
- Figure 61: Bahrain GCC Fruits and Vegetables Industry Revenue Share (%), by Export Market Analysis (Value & Volume) 2024 & 2032
- Figure 62: Bahrain GCC Fruits and Vegetables Industry Volume Share (%), by Export Market Analysis (Value & Volume) 2024 & 2032
- Figure 63: Bahrain GCC Fruits and Vegetables Industry Revenue (Million), by Price Trend Analysis 2024 & 2032
- Figure 64: Bahrain GCC Fruits and Vegetables Industry Volume (Kiloton), by Price Trend Analysis 2024 & 2032
- Figure 65: Bahrain GCC Fruits and Vegetables Industry Revenue Share (%), by Price Trend Analysis 2024 & 2032
- Figure 66: Bahrain GCC Fruits and Vegetables Industry Volume Share (%), by Price Trend Analysis 2024 & 2032
- Figure 67: Bahrain GCC Fruits and Vegetables Industry Revenue (Million), by Country 2024 & 2032
- Figure 68: Bahrain GCC Fruits and Vegetables Industry Volume (Kiloton), by Country 2024 & 2032
- Figure 69: Bahrain GCC Fruits and Vegetables Industry Revenue Share (%), by Country 2024 & 2032
- Figure 70: Bahrain GCC Fruits and Vegetables Industry Volume Share (%), by Country 2024 & 2032
- Figure 71: Kuwait GCC Fruits and Vegetables Industry Revenue (Million), by Production Analysis 2024 & 2032
- Figure 72: Kuwait GCC Fruits and Vegetables Industry Volume (Kiloton), by Production Analysis 2024 & 2032
- Figure 73: Kuwait GCC Fruits and Vegetables Industry Revenue Share (%), by Production Analysis 2024 & 2032
- Figure 74: Kuwait GCC Fruits and Vegetables Industry Volume Share (%), by Production Analysis 2024 & 2032
- Figure 75: Kuwait GCC Fruits and Vegetables Industry Revenue (Million), by Consumption Analysis 2024 & 2032
- Figure 76: Kuwait GCC Fruits and Vegetables Industry Volume (Kiloton), by Consumption Analysis 2024 & 2032
- Figure 77: Kuwait GCC Fruits and Vegetables Industry Revenue Share (%), by Consumption Analysis 2024 & 2032
- Figure 78: Kuwait GCC Fruits and Vegetables Industry Volume Share (%), by Consumption Analysis 2024 & 2032
- Figure 79: Kuwait GCC Fruits and Vegetables Industry Revenue (Million), by Import Market Analysis (Value & Volume) 2024 & 2032
- Figure 80: Kuwait GCC Fruits and Vegetables Industry Volume (Kiloton), by Import Market Analysis (Value & Volume) 2024 & 2032
- Figure 81: Kuwait GCC Fruits and Vegetables Industry Revenue Share (%), by Import Market Analysis (Value & Volume) 2024 & 2032
- Figure 82: Kuwait GCC Fruits and Vegetables Industry Volume Share (%), by Import Market Analysis (Value & Volume) 2024 & 2032
- Figure 83: Kuwait GCC Fruits and Vegetables Industry Revenue (Million), by Export Market Analysis (Value & Volume) 2024 & 2032
- Figure 84: Kuwait GCC Fruits and Vegetables Industry Volume (Kiloton), by Export Market Analysis (Value & Volume) 2024 & 2032
- Figure 85: Kuwait GCC Fruits and Vegetables Industry Revenue Share (%), by Export Market Analysis (Value & Volume) 2024 & 2032
- Figure 86: Kuwait GCC Fruits and Vegetables Industry Volume Share (%), by Export Market Analysis (Value & Volume) 2024 & 2032
- Figure 87: Kuwait GCC Fruits and Vegetables Industry Revenue (Million), by Price Trend Analysis 2024 & 2032
- Figure 88: Kuwait GCC Fruits and Vegetables Industry Volume (Kiloton), by Price Trend Analysis 2024 & 2032
- Figure 89: Kuwait GCC Fruits and Vegetables Industry Revenue Share (%), by Price Trend Analysis 2024 & 2032
- Figure 90: Kuwait GCC Fruits and Vegetables Industry Volume Share (%), by Price Trend Analysis 2024 & 2032
- Figure 91: Kuwait GCC Fruits and Vegetables Industry Revenue (Million), by Country 2024 & 2032
- Figure 92: Kuwait GCC Fruits and Vegetables Industry Volume (Kiloton), by Country 2024 & 2032
- Figure 93: Kuwait GCC Fruits and Vegetables Industry Revenue Share (%), by Country 2024 & 2032
- Figure 94: Kuwait GCC Fruits and Vegetables Industry Volume Share (%), by Country 2024 & 2032
- Figure 95: Oman GCC Fruits and Vegetables Industry Revenue (Million), by Production Analysis 2024 & 2032
- Figure 96: Oman GCC Fruits and Vegetables Industry Volume (Kiloton), by Production Analysis 2024 & 2032
- Figure 97: Oman GCC Fruits and Vegetables Industry Revenue Share (%), by Production Analysis 2024 & 2032
- Figure 98: Oman GCC Fruits and Vegetables Industry Volume Share (%), by Production Analysis 2024 & 2032
- Figure 99: Oman GCC Fruits and Vegetables Industry Revenue (Million), by Consumption Analysis 2024 & 2032
- Figure 100: Oman GCC Fruits and Vegetables Industry Volume (Kiloton), by Consumption Analysis 2024 & 2032
- Figure 101: Oman GCC Fruits and Vegetables Industry Revenue Share (%), by Consumption Analysis 2024 & 2032
- Figure 102: Oman GCC Fruits and Vegetables Industry Volume Share (%), by Consumption Analysis 2024 & 2032
- Figure 103: Oman GCC Fruits and Vegetables Industry Revenue (Million), by Import Market Analysis (Value & Volume) 2024 & 2032
- Figure 104: Oman GCC Fruits and Vegetables Industry Volume (Kiloton), by Import Market Analysis (Value & Volume) 2024 & 2032
- Figure 105: Oman GCC Fruits and Vegetables Industry Revenue Share (%), by Import Market Analysis (Value & Volume) 2024 & 2032
- Figure 106: Oman GCC Fruits and Vegetables Industry Volume Share (%), by Import Market Analysis (Value & Volume) 2024 & 2032
- Figure 107: Oman GCC Fruits and Vegetables Industry Revenue (Million), by Export Market Analysis (Value & Volume) 2024 & 2032
- Figure 108: Oman GCC Fruits and Vegetables Industry Volume (Kiloton), by Export Market Analysis (Value & Volume) 2024 & 2032
- Figure 109: Oman GCC Fruits and Vegetables Industry Revenue Share (%), by Export Market Analysis (Value & Volume) 2024 & 2032
- Figure 110: Oman GCC Fruits and Vegetables Industry Volume Share (%), by Export Market Analysis (Value & Volume) 2024 & 2032
- Figure 111: Oman GCC Fruits and Vegetables Industry Revenue (Million), by Price Trend Analysis 2024 & 2032
- Figure 112: Oman GCC Fruits and Vegetables Industry Volume (Kiloton), by Price Trend Analysis 2024 & 2032
- Figure 113: Oman GCC Fruits and Vegetables Industry Revenue Share (%), by Price Trend Analysis 2024 & 2032
- Figure 114: Oman GCC Fruits and Vegetables Industry Volume Share (%), by Price Trend Analysis 2024 & 2032
- Figure 115: Oman GCC Fruits and Vegetables Industry Revenue (Million), by Country 2024 & 2032
- Figure 116: Oman GCC Fruits and Vegetables Industry Volume (Kiloton), by Country 2024 & 2032
- Figure 117: Oman GCC Fruits and Vegetables Industry Revenue Share (%), by Country 2024 & 2032
- Figure 118: Oman GCC Fruits and Vegetables Industry Volume Share (%), by Country 2024 & 2032
- Figure 119: Qatar GCC Fruits and Vegetables Industry Revenue (Million), by Production Analysis 2024 & 2032
- Figure 120: Qatar GCC Fruits and Vegetables Industry Volume (Kiloton), by Production Analysis 2024 & 2032
- Figure 121: Qatar GCC Fruits and Vegetables Industry Revenue Share (%), by Production Analysis 2024 & 2032
- Figure 122: Qatar GCC Fruits and Vegetables Industry Volume Share (%), by Production Analysis 2024 & 2032
- Figure 123: Qatar GCC Fruits and Vegetables Industry Revenue (Million), by Consumption Analysis 2024 & 2032
- Figure 124: Qatar GCC Fruits and Vegetables Industry Volume (Kiloton), by Consumption Analysis 2024 & 2032
- Figure 125: Qatar GCC Fruits and Vegetables Industry Revenue Share (%), by Consumption Analysis 2024 & 2032
- Figure 126: Qatar GCC Fruits and Vegetables Industry Volume Share (%), by Consumption Analysis 2024 & 2032
- Figure 127: Qatar GCC Fruits and Vegetables Industry Revenue (Million), by Import Market Analysis (Value & Volume) 2024 & 2032
- Figure 128: Qatar GCC Fruits and Vegetables Industry Volume (Kiloton), by Import Market Analysis (Value & Volume) 2024 & 2032
- Figure 129: Qatar GCC Fruits and Vegetables Industry Revenue Share (%), by Import Market Analysis (Value & Volume) 2024 & 2032
- Figure 130: Qatar GCC Fruits and Vegetables Industry Volume Share (%), by Import Market Analysis (Value & Volume) 2024 & 2032
- Figure 131: Qatar GCC Fruits and Vegetables Industry Revenue (Million), by Export Market Analysis (Value & Volume) 2024 & 2032
- Figure 132: Qatar GCC Fruits and Vegetables Industry Volume (Kiloton), by Export Market Analysis (Value & Volume) 2024 & 2032
- Figure 133: Qatar GCC Fruits and Vegetables Industry Revenue Share (%), by Export Market Analysis (Value & Volume) 2024 & 2032
- Figure 134: Qatar GCC Fruits and Vegetables Industry Volume Share (%), by Export Market Analysis (Value & Volume) 2024 & 2032
- Figure 135: Qatar GCC Fruits and Vegetables Industry Revenue (Million), by Price Trend Analysis 2024 & 2032
- Figure 136: Qatar GCC Fruits and Vegetables Industry Volume (Kiloton), by Price Trend Analysis 2024 & 2032
- Figure 137: Qatar GCC Fruits and Vegetables Industry Revenue Share (%), by Price Trend Analysis 2024 & 2032
- Figure 138: Qatar GCC Fruits and Vegetables Industry Volume Share (%), by Price Trend Analysis 2024 & 2032
- Figure 139: Qatar GCC Fruits and Vegetables Industry Revenue (Million), by Country 2024 & 2032
- Figure 140: Qatar GCC Fruits and Vegetables Industry Volume (Kiloton), by Country 2024 & 2032
- Figure 141: Qatar GCC Fruits and Vegetables Industry Revenue Share (%), by Country 2024 & 2032
- Figure 142: Qatar GCC Fruits and Vegetables Industry Volume Share (%), by Country 2024 & 2032
- Figure 143: Saudi Arabia GCC Fruits and Vegetables Industry Revenue (Million), by Production Analysis 2024 & 2032
- Figure 144: Saudi Arabia GCC Fruits and Vegetables Industry Volume (Kiloton), by Production Analysis 2024 & 2032
- Figure 145: Saudi Arabia GCC Fruits and Vegetables Industry Revenue Share (%), by Production Analysis 2024 & 2032
- Figure 146: Saudi Arabia GCC Fruits and Vegetables Industry Volume Share (%), by Production Analysis 2024 & 2032
- Figure 147: Saudi Arabia GCC Fruits and Vegetables Industry Revenue (Million), by Consumption Analysis 2024 & 2032
- Figure 148: Saudi Arabia GCC Fruits and Vegetables Industry Volume (Kiloton), by Consumption Analysis 2024 & 2032
- Figure 149: Saudi Arabia GCC Fruits and Vegetables Industry Revenue Share (%), by Consumption Analysis 2024 & 2032
- Figure 150: Saudi Arabia GCC Fruits and Vegetables Industry Volume Share (%), by Consumption Analysis 2024 & 2032
- Figure 151: Saudi Arabia GCC Fruits and Vegetables Industry Revenue (Million), by Import Market Analysis (Value & Volume) 2024 & 2032
- Figure 152: Saudi Arabia GCC Fruits and Vegetables Industry Volume (Kiloton), by Import Market Analysis (Value & Volume) 2024 & 2032
- Figure 153: Saudi Arabia GCC Fruits and Vegetables Industry Revenue Share (%), by Import Market Analysis (Value & Volume) 2024 & 2032
- Figure 154: Saudi Arabia GCC Fruits and Vegetables Industry Volume Share (%), by Import Market Analysis (Value & Volume) 2024 & 2032
- Figure 155: Saudi Arabia GCC Fruits and Vegetables Industry Revenue (Million), by Export Market Analysis (Value & Volume) 2024 & 2032
- Figure 156: Saudi Arabia GCC Fruits and Vegetables Industry Volume (Kiloton), by Export Market Analysis (Value & Volume) 2024 & 2032
- Figure 157: Saudi Arabia GCC Fruits and Vegetables Industry Revenue Share (%), by Export Market Analysis (Value & Volume) 2024 & 2032
- Figure 158: Saudi Arabia GCC Fruits and Vegetables Industry Volume Share (%), by Export Market Analysis (Value & Volume) 2024 & 2032
- Figure 159: Saudi Arabia GCC Fruits and Vegetables Industry Revenue (Million), by Price Trend Analysis 2024 & 2032
- Figure 160: Saudi Arabia GCC Fruits and Vegetables Industry Volume (Kiloton), by Price Trend Analysis 2024 & 2032
- Figure 161: Saudi Arabia GCC Fruits and Vegetables Industry Revenue Share (%), by Price Trend Analysis 2024 & 2032
- Figure 162: Saudi Arabia GCC Fruits and Vegetables Industry Volume Share (%), by Price Trend Analysis 2024 & 2032
- Figure 163: Saudi Arabia GCC Fruits and Vegetables Industry Revenue (Million), by Country 2024 & 2032
- Figure 164: Saudi Arabia GCC Fruits and Vegetables Industry Volume (Kiloton), by Country 2024 & 2032
- Figure 165: Saudi Arabia GCC Fruits and Vegetables Industry Revenue Share (%), by Country 2024 & 2032
- Figure 166: Saudi Arabia GCC Fruits and Vegetables Industry Volume Share (%), by Country 2024 & 2032
List of Tables
- Table 1: Global GCC Fruits and Vegetables Industry Revenue Million Forecast, by Region 2019 & 2032
- Table 2: Global GCC Fruits and Vegetables Industry Volume Kiloton Forecast, by Region 2019 & 2032
- Table 3: Global GCC Fruits and Vegetables Industry Revenue Million Forecast, by Production Analysis 2019 & 2032
- Table 4: Global GCC Fruits and Vegetables Industry Volume Kiloton Forecast, by Production Analysis 2019 & 2032
- Table 5: Global GCC Fruits and Vegetables Industry Revenue Million Forecast, by Consumption Analysis 2019 & 2032
- Table 6: Global GCC Fruits and Vegetables Industry Volume Kiloton Forecast, by Consumption Analysis 2019 & 2032
- Table 7: Global GCC Fruits and Vegetables Industry Revenue Million Forecast, by Import Market Analysis (Value & Volume) 2019 & 2032
- Table 8: Global GCC Fruits and Vegetables Industry Volume Kiloton Forecast, by Import Market Analysis (Value & Volume) 2019 & 2032
- Table 9: Global GCC Fruits and Vegetables Industry Revenue Million Forecast, by Export Market Analysis (Value & Volume) 2019 & 2032
- Table 10: Global GCC Fruits and Vegetables Industry Volume Kiloton Forecast, by Export Market Analysis (Value & Volume) 2019 & 2032
- Table 11: Global GCC Fruits and Vegetables Industry Revenue Million Forecast, by Price Trend Analysis 2019 & 2032
- Table 12: Global GCC Fruits and Vegetables Industry Volume Kiloton Forecast, by Price Trend Analysis 2019 & 2032
- Table 13: Global GCC Fruits and Vegetables Industry Revenue Million Forecast, by Region 2019 & 2032
- Table 14: Global GCC Fruits and Vegetables Industry Volume Kiloton Forecast, by Region 2019 & 2032
- Table 15: Global GCC Fruits and Vegetables Industry Revenue Million Forecast, by Country 2019 & 2032
- Table 16: Global GCC Fruits and Vegetables Industry Volume Kiloton Forecast, by Country 2019 & 2032
- Table 17: Brazil GCC Fruits and Vegetables Industry Revenue (Million) Forecast, by Application 2019 & 2032
- Table 18: Brazil GCC Fruits and Vegetables Industry Volume (Kiloton) Forecast, by Application 2019 & 2032
- Table 19: Argentina GCC Fruits and Vegetables Industry Revenue (Million) Forecast, by Application 2019 & 2032
- Table 20: Argentina GCC Fruits and Vegetables Industry Volume (Kiloton) Forecast, by Application 2019 & 2032
- Table 21: Rest of South America GCC Fruits and Vegetables Industry Revenue (Million) Forecast, by Application 2019 & 2032
- Table 22: Rest of South America GCC Fruits and Vegetables Industry Volume (Kiloton) Forecast, by Application 2019 & 2032
- Table 23: Global GCC Fruits and Vegetables Industry Revenue Million Forecast, by Country 2019 & 2032
- Table 24: Global GCC Fruits and Vegetables Industry Volume Kiloton Forecast, by Country 2019 & 2032
- Table 25: United States GCC Fruits and Vegetables Industry Revenue (Million) Forecast, by Application 2019 & 2032
- Table 26: United States GCC Fruits and Vegetables Industry Volume (Kiloton) Forecast, by Application 2019 & 2032
- Table 27: Canada GCC Fruits and Vegetables Industry Revenue (Million) Forecast, by Application 2019 & 2032
- Table 28: Canada GCC Fruits and Vegetables Industry Volume (Kiloton) Forecast, by Application 2019 & 2032
- Table 29: Mexico GCC Fruits and Vegetables Industry Revenue (Million) Forecast, by Application 2019 & 2032
- Table 30: Mexico GCC Fruits and Vegetables Industry Volume (Kiloton) Forecast, by Application 2019 & 2032
- Table 31: Global GCC Fruits and Vegetables Industry Revenue Million Forecast, by Country 2019 & 2032
- Table 32: Global GCC Fruits and Vegetables Industry Volume Kiloton Forecast, by Country 2019 & 2032
- Table 33: Germany GCC Fruits and Vegetables Industry Revenue (Million) Forecast, by Application 2019 & 2032
- Table 34: Germany GCC Fruits and Vegetables Industry Volume (Kiloton) Forecast, by Application 2019 & 2032
- Table 35: France GCC Fruits and Vegetables Industry Revenue (Million) Forecast, by Application 2019 & 2032
- Table 36: France GCC Fruits and Vegetables Industry Volume (Kiloton) Forecast, by Application 2019 & 2032
- Table 37: Italy GCC Fruits and Vegetables Industry Revenue (Million) Forecast, by Application 2019 & 2032
- Table 38: Italy GCC Fruits and Vegetables Industry Volume (Kiloton) Forecast, by Application 2019 & 2032
- Table 39: United Kingdom GCC Fruits and Vegetables Industry Revenue (Million) Forecast, by Application 2019 & 2032
- Table 40: United Kingdom GCC Fruits and Vegetables Industry Volume (Kiloton) Forecast, by Application 2019 & 2032
- Table 41: Netherlands GCC Fruits and Vegetables Industry Revenue (Million) Forecast, by Application 2019 & 2032
- Table 42: Netherlands GCC Fruits and Vegetables Industry Volume (Kiloton) Forecast, by Application 2019 & 2032
- Table 43: Rest of Europe GCC Fruits and Vegetables Industry Revenue (Million) Forecast, by Application 2019 & 2032
- Table 44: Rest of Europe GCC Fruits and Vegetables Industry Volume (Kiloton) Forecast, by Application 2019 & 2032
- Table 45: Global GCC Fruits and Vegetables Industry Revenue Million Forecast, by Country 2019 & 2032
- Table 46: Global GCC Fruits and Vegetables Industry Volume Kiloton Forecast, by Country 2019 & 2032
- Table 47: China GCC Fruits and Vegetables Industry Revenue (Million) Forecast, by Application 2019 & 2032
- Table 48: China GCC Fruits and Vegetables Industry Volume (Kiloton) Forecast, by Application 2019 & 2032
- Table 49: Japan GCC Fruits and Vegetables Industry Revenue (Million) Forecast, by Application 2019 & 2032
- Table 50: Japan GCC Fruits and Vegetables Industry Volume (Kiloton) Forecast, by Application 2019 & 2032
- Table 51: India GCC Fruits and Vegetables Industry Revenue (Million) Forecast, by Application 2019 & 2032
- Table 52: India GCC Fruits and Vegetables Industry Volume (Kiloton) Forecast, by Application 2019 & 2032
- Table 53: South Korea GCC Fruits and Vegetables Industry Revenue (Million) Forecast, by Application 2019 & 2032
- Table 54: South Korea GCC Fruits and Vegetables Industry Volume (Kiloton) Forecast, by Application 2019 & 2032
- Table 55: Taiwan GCC Fruits and Vegetables Industry Revenue (Million) Forecast, by Application 2019 & 2032
- Table 56: Taiwan GCC Fruits and Vegetables Industry Volume (Kiloton) Forecast, by Application 2019 & 2032
- Table 57: Australia GCC Fruits and Vegetables Industry Revenue (Million) Forecast, by Application 2019 & 2032
- Table 58: Australia GCC Fruits and Vegetables Industry Volume (Kiloton) Forecast, by Application 2019 & 2032
- Table 59: Rest of Asia-Pacific GCC Fruits and Vegetables Industry Revenue (Million) Forecast, by Application 2019 & 2032
- Table 60: Rest of Asia-Pacific GCC Fruits and Vegetables Industry Volume (Kiloton) Forecast, by Application 2019 & 2032
- Table 61: Global GCC Fruits and Vegetables Industry Revenue Million Forecast, by Country 2019 & 2032
- Table 62: Global GCC Fruits and Vegetables Industry Volume Kiloton Forecast, by Country 2019 & 2032
- Table 63: Middle East GCC Fruits and Vegetables Industry Revenue (Million) Forecast, by Application 2019 & 2032
- Table 64: Middle East GCC Fruits and Vegetables Industry Volume (Kiloton) Forecast, by Application 2019 & 2032
- Table 65: Africa GCC Fruits and Vegetables Industry Revenue (Million) Forecast, by Application 2019 & 2032
- Table 66: Africa GCC Fruits and Vegetables Industry Volume (Kiloton) Forecast, by Application 2019 & 2032
- Table 67: Global GCC Fruits and Vegetables Industry Revenue Million Forecast, by Production Analysis 2019 & 2032
- Table 68: Global GCC Fruits and Vegetables Industry Volume Kiloton Forecast, by Production Analysis 2019 & 2032
- Table 69: Global GCC Fruits and Vegetables Industry Revenue Million Forecast, by Consumption Analysis 2019 & 2032
- Table 70: Global GCC Fruits and Vegetables Industry Volume Kiloton Forecast, by Consumption Analysis 2019 & 2032
- Table 71: Global GCC Fruits and Vegetables Industry Revenue Million Forecast, by Import Market Analysis (Value & Volume) 2019 & 2032
- Table 72: Global GCC Fruits and Vegetables Industry Volume Kiloton Forecast, by Import Market Analysis (Value & Volume) 2019 & 2032
- Table 73: Global GCC Fruits and Vegetables Industry Revenue Million Forecast, by Export Market Analysis (Value & Volume) 2019 & 2032
- Table 74: Global GCC Fruits and Vegetables Industry Volume Kiloton Forecast, by Export Market Analysis (Value & Volume) 2019 & 2032
- Table 75: Global GCC Fruits and Vegetables Industry Revenue Million Forecast, by Price Trend Analysis 2019 & 2032
- Table 76: Global GCC Fruits and Vegetables Industry Volume Kiloton Forecast, by Price Trend Analysis 2019 & 2032
- Table 77: Global GCC Fruits and Vegetables Industry Revenue Million Forecast, by Country 2019 & 2032
- Table 78: Global GCC Fruits and Vegetables Industry Volume Kiloton Forecast, by Country 2019 & 2032
- Table 79: Fruits GCC Fruits and Vegetables Industry Revenue (Million) Forecast, by Application 2019 & 2032
- Table 80: Fruits GCC Fruits and Vegetables Industry Volume (Kiloton) Forecast, by Application 2019 & 2032
- Table 81: Vegetables GCC Fruits and Vegetables Industry Revenue (Million) Forecast, by Application 2019 & 2032
- Table 82: Vegetables GCC Fruits and Vegetables Industry Volume (Kiloton) Forecast, by Application 2019 & 2032
- Table 83: Global GCC Fruits and Vegetables Industry Revenue Million Forecast, by Production Analysis 2019 & 2032
- Table 84: Global GCC Fruits and Vegetables Industry Volume Kiloton Forecast, by Production Analysis 2019 & 2032
- Table 85: Global GCC Fruits and Vegetables Industry Revenue Million Forecast, by Consumption Analysis 2019 & 2032
- Table 86: Global GCC Fruits and Vegetables Industry Volume Kiloton Forecast, by Consumption Analysis 2019 & 2032
- Table 87: Global GCC Fruits and Vegetables Industry Revenue Million Forecast, by Import Market Analysis (Value & Volume) 2019 & 2032
- Table 88: Global GCC Fruits and Vegetables Industry Volume Kiloton Forecast, by Import Market Analysis (Value & Volume) 2019 & 2032
- Table 89: Global GCC Fruits and Vegetables Industry Revenue Million Forecast, by Export Market Analysis (Value & Volume) 2019 & 2032
- Table 90: Global GCC Fruits and Vegetables Industry Volume Kiloton Forecast, by Export Market Analysis (Value & Volume) 2019 & 2032
- Table 91: Global GCC Fruits and Vegetables Industry Revenue Million Forecast, by Price Trend Analysis 2019 & 2032
- Table 92: Global GCC Fruits and Vegetables Industry Volume Kiloton Forecast, by Price Trend Analysis 2019 & 2032
- Table 93: Global GCC Fruits and Vegetables Industry Revenue Million Forecast, by Country 2019 & 2032
- Table 94: Global GCC Fruits and Vegetables Industry Volume Kiloton Forecast, by Country 2019 & 2032
- Table 95: Fruits GCC Fruits and Vegetables Industry Revenue (Million) Forecast, by Application 2019 & 2032
- Table 96: Fruits GCC Fruits and Vegetables Industry Volume (Kiloton) Forecast, by Application 2019 & 2032
- Table 97: Vegetables GCC Fruits and Vegetables Industry Revenue (Million) Forecast, by Application 2019 & 2032
- Table 98: Vegetables GCC Fruits and Vegetables Industry Volume (Kiloton) Forecast, by Application 2019 & 2032
- Table 99: Global GCC Fruits and Vegetables Industry Revenue Million Forecast, by Production Analysis 2019 & 2032
- Table 100: Global GCC Fruits and Vegetables Industry Volume Kiloton Forecast, by Production Analysis 2019 & 2032
- Table 101: Global GCC Fruits and Vegetables Industry Revenue Million Forecast, by Consumption Analysis 2019 & 2032
- Table 102: Global GCC Fruits and Vegetables Industry Volume Kiloton Forecast, by Consumption Analysis 2019 & 2032
- Table 103: Global GCC Fruits and Vegetables Industry Revenue Million Forecast, by Import Market Analysis (Value & Volume) 2019 & 2032
- Table 104: Global GCC Fruits and Vegetables Industry Volume Kiloton Forecast, by Import Market Analysis (Value & Volume) 2019 & 2032
- Table 105: Global GCC Fruits and Vegetables Industry Revenue Million Forecast, by Export Market Analysis (Value & Volume) 2019 & 2032
- Table 106: Global GCC Fruits and Vegetables Industry Volume Kiloton Forecast, by Export Market Analysis (Value & Volume) 2019 & 2032
- Table 107: Global GCC Fruits and Vegetables Industry Revenue Million Forecast, by Price Trend Analysis 2019 & 2032
- Table 108: Global GCC Fruits and Vegetables Industry Volume Kiloton Forecast, by Price Trend Analysis 2019 & 2032
- Table 109: Global GCC Fruits and Vegetables Industry Revenue Million Forecast, by Country 2019 & 2032
- Table 110: Global GCC Fruits and Vegetables Industry Volume Kiloton Forecast, by Country 2019 & 2032
- Table 111: Fruits GCC Fruits and Vegetables Industry Revenue (Million) Forecast, by Application 2019 & 2032
- Table 112: Fruits GCC Fruits and Vegetables Industry Volume (Kiloton) Forecast, by Application 2019 & 2032
- Table 113: Vegetables GCC Fruits and Vegetables Industry Revenue (Million) Forecast, by Application 2019 & 2032
- Table 114: Vegetables GCC Fruits and Vegetables Industry Volume (Kiloton) Forecast, by Application 2019 & 2032
- Table 115: Global GCC Fruits and Vegetables Industry Revenue Million Forecast, by Production Analysis 2019 & 2032
- Table 116: Global GCC Fruits and Vegetables Industry Volume Kiloton Forecast, by Production Analysis 2019 & 2032
- Table 117: Global GCC Fruits and Vegetables Industry Revenue Million Forecast, by Consumption Analysis 2019 & 2032
- Table 118: Global GCC Fruits and Vegetables Industry Volume Kiloton Forecast, by Consumption Analysis 2019 & 2032
- Table 119: Global GCC Fruits and Vegetables Industry Revenue Million Forecast, by Import Market Analysis (Value & Volume) 2019 & 2032
- Table 120: Global GCC Fruits and Vegetables Industry Volume Kiloton Forecast, by Import Market Analysis (Value & Volume) 2019 & 2032
- Table 121: Global GCC Fruits and Vegetables Industry Revenue Million Forecast, by Export Market Analysis (Value & Volume) 2019 & 2032
- Table 122: Global GCC Fruits and Vegetables Industry Volume Kiloton Forecast, by Export Market Analysis (Value & Volume) 2019 & 2032
- Table 123: Global GCC Fruits and Vegetables Industry Revenue Million Forecast, by Price Trend Analysis 2019 & 2032
- Table 124: Global GCC Fruits and Vegetables Industry Volume Kiloton Forecast, by Price Trend Analysis 2019 & 2032
- Table 125: Global GCC Fruits and Vegetables Industry Revenue Million Forecast, by Country 2019 & 2032
- Table 126: Global GCC Fruits and Vegetables Industry Volume Kiloton Forecast, by Country 2019 & 2032
- Table 127: Fruits GCC Fruits and Vegetables Industry Revenue (Million) Forecast, by Application 2019 & 2032
- Table 128: Fruits GCC Fruits and Vegetables Industry Volume (Kiloton) Forecast, by Application 2019 & 2032
- Table 129: Vegetables GCC Fruits and Vegetables Industry Revenue (Million) Forecast, by Application 2019 & 2032
- Table 130: Vegetables GCC Fruits and Vegetables Industry Volume (Kiloton) Forecast, by Application 2019 & 2032
- Table 131: Global GCC Fruits and Vegetables Industry Revenue Million Forecast, by Production Analysis 2019 & 2032
- Table 132: Global GCC Fruits and Vegetables Industry Volume Kiloton Forecast, by Production Analysis 2019 & 2032
- Table 133: Global GCC Fruits and Vegetables Industry Revenue Million Forecast, by Consumption Analysis 2019 & 2032
- Table 134: Global GCC Fruits and Vegetables Industry Volume Kiloton Forecast, by Consumption Analysis 2019 & 2032
- Table 135: Global GCC Fruits and Vegetables Industry Revenue Million Forecast, by Import Market Analysis (Value & Volume) 2019 & 2032
- Table 136: Global GCC Fruits and Vegetables Industry Volume Kiloton Forecast, by Import Market Analysis (Value & Volume) 2019 & 2032
- Table 137: Global GCC Fruits and Vegetables Industry Revenue Million Forecast, by Export Market Analysis (Value & Volume) 2019 & 2032
- Table 138: Global GCC Fruits and Vegetables Industry Volume Kiloton Forecast, by Export Market Analysis (Value & Volume) 2019 & 2032
- Table 139: Global GCC Fruits and Vegetables Industry Revenue Million Forecast, by Price Trend Analysis 2019 & 2032
- Table 140: Global GCC Fruits and Vegetables Industry Volume Kiloton Forecast, by Price Trend Analysis 2019 & 2032
- Table 141: Global GCC Fruits and Vegetables Industry Revenue Million Forecast, by Country 2019 & 2032
- Table 142: Global GCC Fruits and Vegetables Industry Volume Kiloton Forecast, by Country 2019 & 2032
- Table 143: Fruits GCC Fruits and Vegetables Industry Revenue (Million) Forecast, by Application 2019 & 2032
- Table 144: Fruits GCC Fruits and Vegetables Industry Volume (Kiloton) Forecast, by Application 2019 & 2032
- Table 145: Vegetables GCC Fruits and Vegetables Industry Revenue (Million) Forecast, by Application 2019 & 2032
- Table 146: Vegetables GCC Fruits and Vegetables Industry Volume (Kiloton) Forecast, by Application 2019 & 2032
- Table 147: Global GCC Fruits and Vegetables Industry Revenue Million Forecast, by Production Analysis 2019 & 2032
- Table 148: Global GCC Fruits and Vegetables Industry Volume Kiloton Forecast, by Production Analysis 2019 & 2032
- Table 149: Global GCC Fruits and Vegetables Industry Revenue Million Forecast, by Consumption Analysis 2019 & 2032
- Table 150: Global GCC Fruits and Vegetables Industry Volume Kiloton Forecast, by Consumption Analysis 2019 & 2032
- Table 151: Global GCC Fruits and Vegetables Industry Revenue Million Forecast, by Import Market Analysis (Value & Volume) 2019 & 2032
- Table 152: Global GCC Fruits and Vegetables Industry Volume Kiloton Forecast, by Import Market Analysis (Value & Volume) 2019 & 2032
- Table 153: Global GCC Fruits and Vegetables Industry Revenue Million Forecast, by Export Market Analysis (Value & Volume) 2019 & 2032
- Table 154: Global GCC Fruits and Vegetables Industry Volume Kiloton Forecast, by Export Market Analysis (Value & Volume) 2019 & 2032
- Table 155: Global GCC Fruits and Vegetables Industry Revenue Million Forecast, by Price Trend Analysis 2019 & 2032
- Table 156: Global GCC Fruits and Vegetables Industry Volume Kiloton Forecast, by Price Trend Analysis 2019 & 2032
- Table 157: Global GCC Fruits and Vegetables Industry Revenue Million Forecast, by Country 2019 & 2032
- Table 158: Global GCC Fruits and Vegetables Industry Volume Kiloton Forecast, by Country 2019 & 2032
- Table 159: Fruits GCC Fruits and Vegetables Industry Revenue (Million) Forecast, by Application 2019 & 2032
- Table 160: Fruits GCC Fruits and Vegetables Industry Volume (Kiloton) Forecast, by Application 2019 & 2032
- Table 161: Vegetables GCC Fruits and Vegetables Industry Revenue (Million) Forecast, by Application 2019 & 2032
- Table 162: Vegetables GCC Fruits and Vegetables Industry Volume (Kiloton) Forecast, by Application 2019 & 2032
Frequently Asked Questions
1. What is the projected Compound Annual Growth Rate (CAGR) of the GCC Fruits and Vegetables Industry?
The projected CAGR is approximately 4.80%.
2. Which companies are prominent players in the GCC Fruits and Vegetables Industry?
Key companies in the market include Del Monte Foods UAE , Barakat Group , NRTC Group, Lulu Group , Al Raya Group , Al-Futtaim Group , Al Bakrawe Group , Fresh Fruits Company, SPAR , Carrefour .
3. What are the main segments of the GCC Fruits and Vegetables Industry?
The market segments include Production Analysis, Consumption Analysis, Import Market Analysis (Value & Volume), Export Market Analysis (Value & Volume), Price Trend Analysis.
4. Can you provide details about the market size?
The market size is estimated to be USD 15.98 Million as of 2022.
5. What are some drivers contributing to market growth?
Increasing Adoption of Technology in Horticulture; Government Initiatives for Self-reliance in Vegetable and Fruit Farming.
6. What are the notable trends driving market growth?
Increasing Adoption of Technology in Horticulture.
7. Are there any restraints impacting market growth?
Limited Resource Availability and Unfavourable Climatic Condition; Increasing Reliance on Imports for Domestic Supply.
8. Can you provide examples of recent developments in the market?
February 2024: Lulu Group opened its 23rd hypermarket in the new Doha Mall, Qatar. The hypermarket is a two-floor space of 80,000 square feet that features a modern design aligned with the latest shopping trends. The new hypermarket introduces an extensive range of fresh produce worldwide. Also, to help shoppers save more and get loyalty rewards, Lulu launched its innovative loyalty reward program, Lulu Happiness. By joining this program, shoppers get exclusive offers, additional discounts, and redeemable points whenever they shop at any Lulu Hypermarket.
9. What pricing options are available for accessing the report?
Pricing options include single-user, multi-user, and enterprise licenses priced at USD 4750, USD 5250, and USD 8750 respectively.
10. Is the market size provided in terms of value or volume?
The market size is provided in terms of value, measured in Million and volume, measured in Kiloton.
11. Are there any specific market keywords associated with the report?
Yes, the market keyword associated with the report is "GCC Fruits and Vegetables Industry," which aids in identifying and referencing the specific market segment covered.
12. How do I determine which pricing option suits my needs best?
The pricing options vary based on user requirements and access needs. Individual users may opt for single-user licenses, while businesses requiring broader access may choose multi-user or enterprise licenses for cost-effective access to the report.
13. Are there any additional resources or data provided in the GCC Fruits and Vegetables Industry report?
While the report offers comprehensive insights, it's advisable to review the specific contents or supplementary materials provided to ascertain if additional resources or data are available.
14. How can I stay updated on further developments or reports in the GCC Fruits and Vegetables Industry?
To stay informed about further developments, trends, and reports in the GCC Fruits and Vegetables Industry, consider subscribing to industry newsletters, following relevant companies and organizations, or regularly checking reputable industry news sources and publications.
Methodology
Step 1 - Identification of Relevant Samples Size from Population Database


Step 2 - Approaches for Defining Global Market Size (Value, Volume* & Price*)

Note*: In applicable scenarios
Step 3 - Data Sources
Primary Research
- Web Analytics
- Survey Reports
- Research Institute
- Latest Research Reports
- Opinion Leaders
Secondary Research
- Annual Reports
- White Paper
- Latest Press Release
- Industry Association
- Paid Database
- Investor Presentations

Step 4 - Data Triangulation
Involves using different sources of information in order to increase the validity of a study
These sources are likely to be stakeholders in a program - participants, other researchers, program staff, other community members, and so on.
Then we put all data in single framework & apply various statistical tools to find out the dynamic on the market.
During the analysis stage, feedback from the stakeholder groups would be compared to determine areas of agreement as well as areas of divergence


