

Key Insights
The fused fiber optic WDM market is experiencing robust growth, driven by the increasing demand for high-bandwidth communication networks across various sectors. The expanding adoption of 5G networks, cloud computing, and the Internet of Things (IoT) is fueling this demand, necessitating efficient and scalable optical communication solutions. Fused fiber optic WDM technology, with its ability to multiplex multiple wavelengths onto a single fiber, offers a cost-effective and high-capacity solution compared to traditional methods. Significant advancements in laser technology, particularly in the 1550nm range, are further contributing to market expansion. The market is segmented by application (network monitoring, test equipment, fiber-optic lasers, optical fiber amplifiers, and others) and by type (980nm, 1064nm, 1310nm, 1550nm, and others). North America and Europe currently hold significant market share, driven by strong technological advancements and infrastructure development. However, the Asia-Pacific region is poised for rapid growth due to substantial investments in telecommunication infrastructure and increasing digitalization across various industries. Competition among major players like Thorlabs, Lumentum, and others is intense, fostering innovation and driving down prices, making the technology accessible to a wider range of users.
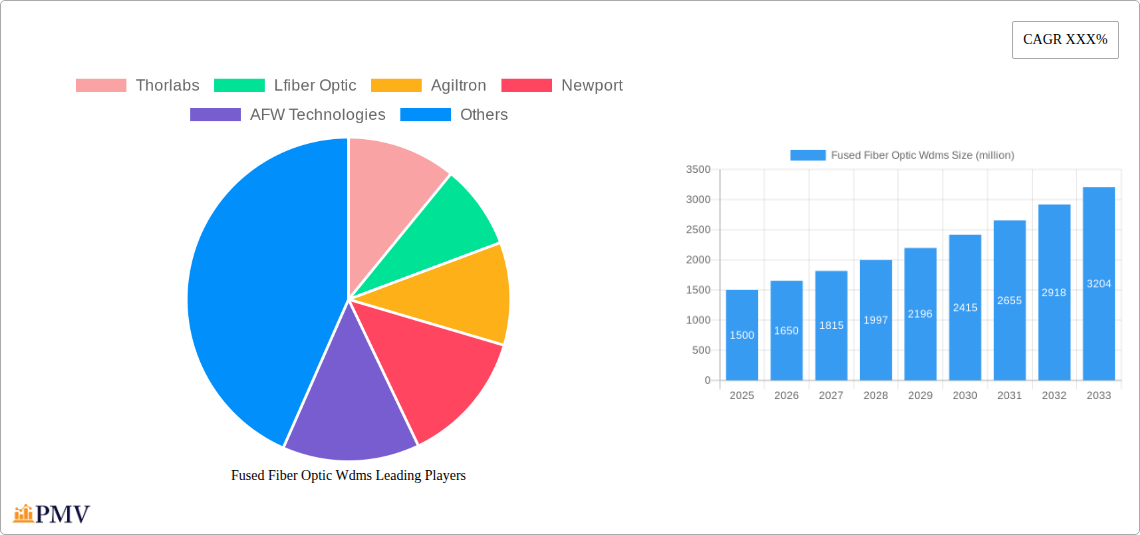
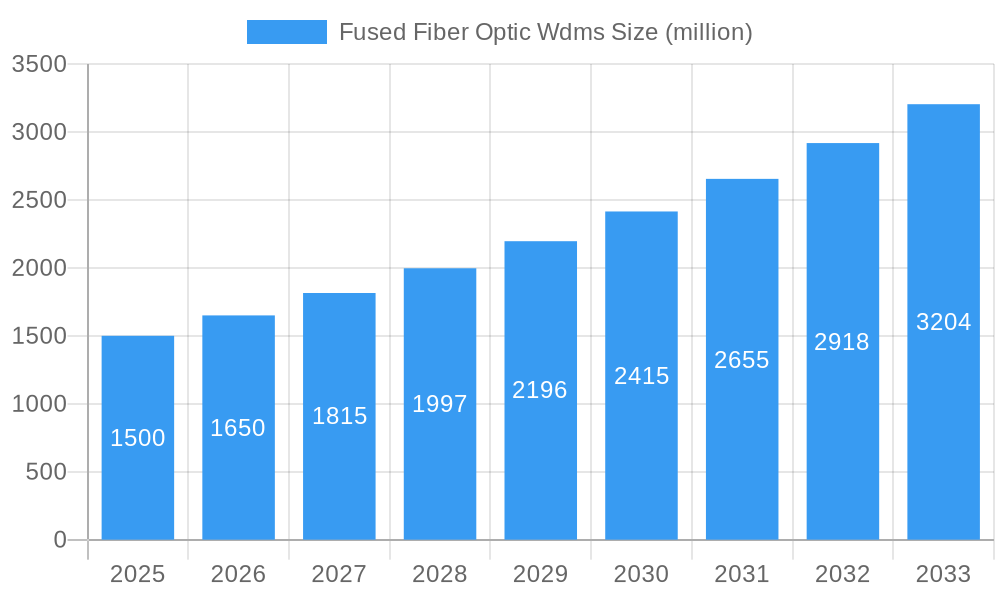
Fused Fiber Optic Wdms Market Size (In Billion)
The restraints to market growth include the high initial investment required for deploying WDM systems, particularly in developing regions. However, this is mitigated by the long-term cost savings associated with increased bandwidth and efficiency. Furthermore, the potential for fiber optic cable damage and the complexities involved in system installation and maintenance pose challenges. Despite these constraints, the overall market outlook for fused fiber optic WDM remains positive, projecting a sustained growth trajectory throughout the forecast period. The market is expected to be driven by continuous technological advancements, the growing demand for higher bandwidth capabilities, and ongoing expansion in global telecommunication infrastructure. Key players are focusing on product innovation, strategic partnerships, and mergers and acquisitions to expand their market presence and enhance their product offerings.
Fused Fiber Optic Wdms Company Market Share
Fused Fiber Optic WDMs Market Report: 2019-2033
This comprehensive report provides a detailed analysis of the Fused Fiber Optic WDMs market, offering invaluable insights for industry professionals, investors, and strategic decision-makers. Covering the period from 2019 to 2033, with a base year of 2025 and a forecast period of 2025-2033, this report leverages extensive research and data analysis to present a clear and actionable understanding of this dynamic market. The market is projected to reach xx million by 2033, exhibiting a CAGR of xx% during the forecast period.
Fused Fiber Optic Wdms Market Structure & Competitive Dynamics
The Fused Fiber Optic WDMs market is characterized by a moderately concentrated structure, with key players holding significant market share. Thorlabs, Newport, and Corning, among others, are prominent market leaders, collectively accounting for approximately xx million in revenue in 2025. However, the market exhibits a healthy level of competition, driven by innovation and the emergence of new technologies. The competitive landscape is further shaped by ongoing mergers and acquisitions (M&A) activities, with an estimated xx million in M&A deal value recorded during the historical period (2019-2024). This includes strategic acquisitions aimed at expanding product portfolios and market reach.
- Market Concentration: Moderately concentrated, with top 5 players holding approximately xx% market share in 2025.
- Innovation Ecosystems: Active participation from research institutions and startups driving technological advancements.
- Regulatory Frameworks: Stringent regulations governing telecommunications infrastructure influence market dynamics.
- Product Substitutes: Limited direct substitutes, but alternative technologies exist for specific applications.
- End-User Trends: Growing demand for high-bandwidth applications fuels market expansion.
- M&A Activities: Significant M&A activity observed during the historical period, with deals valued at approximately xx million.
Fused Fiber Optic Wdms Industry Trends & Insights
The Fused Fiber Optic Wdms market is experiencing robust growth, primarily driven by the increasing demand for high-speed data transmission across various industries. The rising adoption of 5G networks and the expansion of data centers are major catalysts for market expansion. Technological advancements, including the development of advanced wavelength-division multiplexing (WDM) technologies, are further enhancing the capabilities and efficiency of Fused Fiber Optic WDMs. Consumer preferences for seamless connectivity and high-quality data services are also contributing to market growth. The market is witnessing a significant shift towards higher-capacity systems, leading to increased demand for higher-wavelength count WDMs. This trend, coupled with the ongoing adoption of coherent optical technology, is expected to drive market expansion in the forecast period. The overall market exhibits a significant CAGR of xx% and a market penetration of xx% by 2033, with the 1550nm segment dominating due to its compatibility with long-haul fiber optic systems.
Dominant Markets & Segments in Fused Fiber Optic Wdms
The North American region currently dominates the Fused Fiber Optic WDM market, owing to significant investments in advanced telecommunications infrastructure and robust data center deployments. The Network Monitoring and Test Equipment application segments hold the largest market shares globally, fueled by the increasing need for efficient network management and testing capabilities. The 1550nm type dominates the market due to its suitability for long-haul fiber-optic communications.
Key Drivers for North American Dominance:
- Extensive fiber optic network infrastructure
- High adoption of advanced technologies
- Strong government support for technological advancement
- Presence of major telecom companies
Dominant Application Segments:
- Network Monitoring: Driven by the need to enhance network reliability and efficiency.
- Test Equipment: Essential for ensuring the optimal performance of Fused Fiber Optic WDM systems.
Dominant Type Segment:
- 1550nm: Predominantly used in long-haul fiber optic transmission.
Fused Fiber Optic Wdms Product Innovations
Recent product developments in Fused Fiber Optic WDMs focus on enhanced performance, miniaturization, and cost reduction. Innovations include improved packaging techniques, optimized fiber splicing methods, and the integration of advanced optical components to enhance signal quality and reduce signal loss. These advancements cater to the growing demand for high-capacity, low-latency optical communication systems and further strengthen the market competitiveness.
Report Segmentation & Scope
This report segments the Fused Fiber Optic WDM market by Application (Network Monitoring, Test Equipment, Fiber-optic Laser, Optical Fiber Amplifier, Others) and by Type (980nm, 1064nm, 1310nm, 1550nm, Others). Each segment’s growth projections, market size estimations, and competitive dynamics are meticulously analyzed. For instance, the Network Monitoring segment shows a consistent high growth rate due to the increasing importance of network optimization. The 1550nm segment dominates the Type category, with significant market share driven by its long-haul transmission capabilities. Detailed analyses of each segment are included.
Key Drivers of Fused Fiber Optic Wdms Growth
The market's growth is primarily fueled by the burgeoning demand for high-bandwidth communication, driven by factors such as the expansion of 5G and 6G networks, the rapid growth of data centers, and increasing cloud computing adoption. Government initiatives promoting digital infrastructure development also provide further impetus to market growth. Furthermore, continuous technological advancements, leading to more efficient and cost-effective WDM solutions, further stimulate market expansion.
Challenges in the Fused Fiber Optic Wdms Sector
The Fused Fiber Optic WDM sector faces challenges including the high initial investment costs associated with deploying fiber optic networks, potential supply chain disruptions impacting the availability of key components, and intense competition from alternative technologies. These factors can influence market growth and profitability. The increasing complexity of network management also poses a challenge.
Leading Players in the Fused Fiber Optic Wdms Market
- Thorlabs
- Lfiber Optic
- Agiltron
- Newport
- AFW Technologies
- OptiWorks
- OPTOKON
- Gooch & Housego
- Lightel
- AFL Global
- Corning
- Senko Advanced Components
- Ascentta
- Opto-Link Corporation
- Anfiber Technology Limited
- LEAD Fiber Optics
- Ruik-Tech Communication
- Casix
Key Developments in Fused Fiber Optic Wdms Sector
- Q1 2023: Thorlabs announced a new generation of high-performance Fused Fiber Optic WDMs.
- Q3 2022: Newport launched a miniaturized Fused Fiber Optic WDM module for compact applications.
- Q4 2021: A strategic partnership between Corning and AFL Global was formed to enhance the supply chain.
- (Further developments to be added based on available data)
Strategic Fused Fiber Optic Wdms Market Outlook
The future of the Fused Fiber Optic WDM market looks promising, with substantial growth potential fueled by continued advancements in optical communication technologies, growing demand for higher bandwidths, and increasing investments in global fiber optic infrastructure. Strategic opportunities exist for companies focusing on innovative product development, efficient manufacturing, and strong partnerships to capitalize on this expanding market. The focus on cost-effective solutions and sustainable manufacturing practices will be crucial for long-term success.
Fused Fiber Optic Wdms Segmentation
-
1. Application
- 1.1. Network Monitoring
- 1.2. Test Equipment
- 1.3. Fiber-optic Laser
- 1.4. Optical Fiber Amplifier
- 1.5. Others
-
2. Type
- 2.1. 980nm
- 2.2. 1064nm
- 2.3. 1310nm
- 2.4. 1550nm
- 2.5. Others
Fused Fiber Optic Wdms Segmentation By Geography
-
1. North America
- 1.1. United States
- 1.2. Canada
- 1.3. Mexico
-
2. South America
- 2.1. Brazil
- 2.2. Argentina
- 2.3. Rest of South America
-
3. Europe
- 3.1. United Kingdom
- 3.2. Germany
- 3.3. France
- 3.4. Italy
- 3.5. Spain
- 3.6. Russia
- 3.7. Benelux
- 3.8. Nordics
- 3.9. Rest of Europe
-
4. Middle East & Africa
- 4.1. Turkey
- 4.2. Israel
- 4.3. GCC
- 4.4. North Africa
- 4.5. South Africa
- 4.6. Rest of Middle East & Africa
-
5. Asia Pacific
- 5.1. China
- 5.2. India
- 5.3. Japan
- 5.4. South Korea
- 5.5. ASEAN
- 5.6. Oceania
- 5.7. Rest of Asia Pacific

Fused Fiber Optic Wdms Regional Market Share
Geographic Coverage of Fused Fiber Optic Wdms
Fused Fiber Optic Wdms REPORT HIGHLIGHTS
| Aspects | Details |
|---|---|
| Study Period | 2020-2034 |
| Base Year | 2025 |
| Estimated Year | 2026 |
| Forecast Period | 2026-2034 |
| Historical Period | 2020-2025 |
| Growth Rate | CAGR of XXX% from 2020-2034 |
| Segmentation |
|
Table of Contents
- 1. Introduction
- 1.1. Research Scope
- 1.2. Market Segmentation
- 1.3. Research Objective
- 1.4. Definitions and Assumptions
- 2. Executive Summary
- 2.1. Market Snapshot
- 3. Market Dynamics
- 3.1. Market Drivers
- 3.2. Market Restrains
- 3.3. Market Trends
- 3.4. Market Opportunities
- 4. Market Factor Analysis
- 4.1. Porters Five Forces
- 4.1.1. Bargaining Power of Suppliers
- 4.1.2. Bargaining Power of Buyers
- 4.1.3. Threat of New Entrants
- 4.1.4. Threat of Substitutes
- 4.1.5. Competitive Rivalry
- 4.2. PESTEL analysis
- 4.3. BCG Analysis
- 4.3.1. Stars (High Growth, High Market Share)
- 4.3.2. Cash Cows (Low Growth, High Market Share)
- 4.3.3. Question Mark (High Growth, Low Market Share)
- 4.3.4. Dogs (Low Growth, Low Market Share)
- 4.4. Ansoff Matrix Analysis
- 4.5. Supply Chain Analysis
- 4.6. Regulatory Landscape
- 4.7. Current Market Potential and Opportunity Assessment (TAM–SAM–SOM Framework)
- 4.8. PMV Analyst Note
- 4.1. Porters Five Forces
- 5. Market Analysis, Insights and Forecast 2021-2033
- 5.1. Market Analysis, Insights and Forecast - by Application
- 5.1.1. Network Monitoring
- 5.1.2. Test Equipment
- 5.1.3. Fiber-optic Laser
- 5.1.4. Optical Fiber Amplifier
- 5.1.5. Others
- 5.2. Market Analysis, Insights and Forecast - by Type
- 5.2.1. 980nm
- 5.2.2. 1064nm
- 5.2.3. 1310nm
- 5.2.4. 1550nm
- 5.2.5. Others
- 5.3. Market Analysis, Insights and Forecast - by Region
- 5.3.1. North America
- 5.3.2. South America
- 5.3.3. Europe
- 5.3.4. Middle East & Africa
- 5.3.5. Asia Pacific
- 5.1. Market Analysis, Insights and Forecast - by Application
- 6. Global Fused Fiber Optic Wdms Analysis, Insights and Forecast, 2021-2033
- 6.1. Market Analysis, Insights and Forecast - by Application
- 6.1.1. Network Monitoring
- 6.1.2. Test Equipment
- 6.1.3. Fiber-optic Laser
- 6.1.4. Optical Fiber Amplifier
- 6.1.5. Others
- 6.2. Market Analysis, Insights and Forecast - by Type
- 6.2.1. 980nm
- 6.2.2. 1064nm
- 6.2.3. 1310nm
- 6.2.4. 1550nm
- 6.2.5. Others
- 6.1. Market Analysis, Insights and Forecast - by Application
- 7. North America Fused Fiber Optic Wdms Analysis, Insights and Forecast, 2020-2032
- 7.1. Market Analysis, Insights and Forecast - by Application
- 7.1.1. Network Monitoring
- 7.1.2. Test Equipment
- 7.1.3. Fiber-optic Laser
- 7.1.4. Optical Fiber Amplifier
- 7.1.5. Others
- 7.2. Market Analysis, Insights and Forecast - by Type
- 7.2.1. 980nm
- 7.2.2. 1064nm
- 7.2.3. 1310nm
- 7.2.4. 1550nm
- 7.2.5. Others
- 7.1. Market Analysis, Insights and Forecast - by Application
- 8. South America Fused Fiber Optic Wdms Analysis, Insights and Forecast, 2020-2032
- 8.1. Market Analysis, Insights and Forecast - by Application
- 8.1.1. Network Monitoring
- 8.1.2. Test Equipment
- 8.1.3. Fiber-optic Laser
- 8.1.4. Optical Fiber Amplifier
- 8.1.5. Others
- 8.2. Market Analysis, Insights and Forecast - by Type
- 8.2.1. 980nm
- 8.2.2. 1064nm
- 8.2.3. 1310nm
- 8.2.4. 1550nm
- 8.2.5. Others
- 8.1. Market Analysis, Insights and Forecast - by Application
- 9. Europe Fused Fiber Optic Wdms Analysis, Insights and Forecast, 2020-2032
- 9.1. Market Analysis, Insights and Forecast - by Application
- 9.1.1. Network Monitoring
- 9.1.2. Test Equipment
- 9.1.3. Fiber-optic Laser
- 9.1.4. Optical Fiber Amplifier
- 9.1.5. Others
- 9.2. Market Analysis, Insights and Forecast - by Type
- 9.2.1. 980nm
- 9.2.2. 1064nm
- 9.2.3. 1310nm
- 9.2.4. 1550nm
- 9.2.5. Others
- 9.1. Market Analysis, Insights and Forecast - by Application
- 10. Middle East & Africa Fused Fiber Optic Wdms Analysis, Insights and Forecast, 2020-2032
- 10.1. Market Analysis, Insights and Forecast - by Application
- 10.1.1. Network Monitoring
- 10.1.2. Test Equipment
- 10.1.3. Fiber-optic Laser
- 10.1.4. Optical Fiber Amplifier
- 10.1.5. Others
- 10.2. Market Analysis, Insights and Forecast - by Type
- 10.2.1. 980nm
- 10.2.2. 1064nm
- 10.2.3. 1310nm
- 10.2.4. 1550nm
- 10.2.5. Others
- 10.1. Market Analysis, Insights and Forecast - by Application
- 11. Asia Pacific Fused Fiber Optic Wdms Analysis, Insights and Forecast, 2020-2032
- 11.1. Market Analysis, Insights and Forecast - by Application
- 11.1.1. Network Monitoring
- 11.1.2. Test Equipment
- 11.1.3. Fiber-optic Laser
- 11.1.4. Optical Fiber Amplifier
- 11.1.5. Others
- 11.2. Market Analysis, Insights and Forecast - by Type
- 11.2.1. 980nm
- 11.2.2. 1064nm
- 11.2.3. 1310nm
- 11.2.4. 1550nm
- 11.2.5. Others
- 11.1. Market Analysis, Insights and Forecast - by Application
- 12. Competitive Analysis
- 12.1. Company Profiles
- 12.1.1 Thorlabs
- 12.1.1.1. Company Overview
- 12.1.1.2. Products
- 12.1.1.3. Company Financials
- 12.1.1.4. SWOT Analysis
- 12.1.2 Lfiber Optic
- 12.1.2.1. Company Overview
- 12.1.2.2. Products
- 12.1.2.3. Company Financials
- 12.1.2.4. SWOT Analysis
- 12.1.3 Agiltron
- 12.1.3.1. Company Overview
- 12.1.3.2. Products
- 12.1.3.3. Company Financials
- 12.1.3.4. SWOT Analysis
- 12.1.4 Newport
- 12.1.4.1. Company Overview
- 12.1.4.2. Products
- 12.1.4.3. Company Financials
- 12.1.4.4. SWOT Analysis
- 12.1.5 AFW Technologies
- 12.1.5.1. Company Overview
- 12.1.5.2. Products
- 12.1.5.3. Company Financials
- 12.1.5.4. SWOT Analysis
- 12.1.6 OptiWorks
- 12.1.6.1. Company Overview
- 12.1.6.2. Products
- 12.1.6.3. Company Financials
- 12.1.6.4. SWOT Analysis
- 12.1.7 OPTOKON
- 12.1.7.1. Company Overview
- 12.1.7.2. Products
- 12.1.7.3. Company Financials
- 12.1.7.4. SWOT Analysis
- 12.1.8 Gooch & Housego
- 12.1.8.1. Company Overview
- 12.1.8.2. Products
- 12.1.8.3. Company Financials
- 12.1.8.4. SWOT Analysis
- 12.1.9 Lightel
- 12.1.9.1. Company Overview
- 12.1.9.2. Products
- 12.1.9.3. Company Financials
- 12.1.9.4. SWOT Analysis
- 12.1.10 AFL Global
- 12.1.10.1. Company Overview
- 12.1.10.2. Products
- 12.1.10.3. Company Financials
- 12.1.10.4. SWOT Analysis
- 12.1.11 Corning
- 12.1.11.1. Company Overview
- 12.1.11.2. Products
- 12.1.11.3. Company Financials
- 12.1.11.4. SWOT Analysis
- 12.1.12 Senko Advanced Components
- 12.1.12.1. Company Overview
- 12.1.12.2. Products
- 12.1.12.3. Company Financials
- 12.1.12.4. SWOT Analysis
- 12.1.13 Ascentta
- 12.1.13.1. Company Overview
- 12.1.13.2. Products
- 12.1.13.3. Company Financials
- 12.1.13.4. SWOT Analysis
- 12.1.14 Opto-Link Corporation
- 12.1.14.1. Company Overview
- 12.1.14.2. Products
- 12.1.14.3. Company Financials
- 12.1.14.4. SWOT Analysis
- 12.1.15 Anfiber Technology Limited
- 12.1.15.1. Company Overview
- 12.1.15.2. Products
- 12.1.15.3. Company Financials
- 12.1.15.4. SWOT Analysis
- 12.1.16 LEAD Fiber Optics
- 12.1.16.1. Company Overview
- 12.1.16.2. Products
- 12.1.16.3. Company Financials
- 12.1.16.4. SWOT Analysis
- 12.1.17 Ruik-Tech Communication
- 12.1.17.1. Company Overview
- 12.1.17.2. Products
- 12.1.17.3. Company Financials
- 12.1.17.4. SWOT Analysis
- 12.1.18 Casix
- 12.1.18.1. Company Overview
- 12.1.18.2. Products
- 12.1.18.3. Company Financials
- 12.1.18.4. SWOT Analysis
- 12.1.1 Thorlabs
- 12.2. Market Entropy
- 12.2.1 Company's Key Areas Served
- 12.2.2 Recent Developments
- 12.3. Company Market Share Analysis 2025
- 12.3.1 Top 5 Companies Market Share Analysis
- 12.3.2 Top 3 Companies Market Share Analysis
- 12.4. List of Potential Customers
- 13. Research Methodology
List of Figures
- Figure 1: Global Fused Fiber Optic Wdms Revenue Breakdown (million, %) by Region 2025 & 2033
- Figure 2: Global Fused Fiber Optic Wdms Volume Breakdown (K, %) by Region 2025 & 2033
- Figure 3: North America Fused Fiber Optic Wdms Revenue (million), by Application 2025 & 2033
- Figure 4: North America Fused Fiber Optic Wdms Volume (K), by Application 2025 & 2033
- Figure 5: North America Fused Fiber Optic Wdms Revenue Share (%), by Application 2025 & 2033
- Figure 6: North America Fused Fiber Optic Wdms Volume Share (%), by Application 2025 & 2033
- Figure 7: North America Fused Fiber Optic Wdms Revenue (million), by Type 2025 & 2033
- Figure 8: North America Fused Fiber Optic Wdms Volume (K), by Type 2025 & 2033
- Figure 9: North America Fused Fiber Optic Wdms Revenue Share (%), by Type 2025 & 2033
- Figure 10: North America Fused Fiber Optic Wdms Volume Share (%), by Type 2025 & 2033
- Figure 11: North America Fused Fiber Optic Wdms Revenue (million), by Country 2025 & 2033
- Figure 12: North America Fused Fiber Optic Wdms Volume (K), by Country 2025 & 2033
- Figure 13: North America Fused Fiber Optic Wdms Revenue Share (%), by Country 2025 & 2033
- Figure 14: North America Fused Fiber Optic Wdms Volume Share (%), by Country 2025 & 2033
- Figure 15: South America Fused Fiber Optic Wdms Revenue (million), by Application 2025 & 2033
- Figure 16: South America Fused Fiber Optic Wdms Volume (K), by Application 2025 & 2033
- Figure 17: South America Fused Fiber Optic Wdms Revenue Share (%), by Application 2025 & 2033
- Figure 18: South America Fused Fiber Optic Wdms Volume Share (%), by Application 2025 & 2033
- Figure 19: South America Fused Fiber Optic Wdms Revenue (million), by Type 2025 & 2033
- Figure 20: South America Fused Fiber Optic Wdms Volume (K), by Type 2025 & 2033
- Figure 21: South America Fused Fiber Optic Wdms Revenue Share (%), by Type 2025 & 2033
- Figure 22: South America Fused Fiber Optic Wdms Volume Share (%), by Type 2025 & 2033
- Figure 23: South America Fused Fiber Optic Wdms Revenue (million), by Country 2025 & 2033
- Figure 24: South America Fused Fiber Optic Wdms Volume (K), by Country 2025 & 2033
- Figure 25: South America Fused Fiber Optic Wdms Revenue Share (%), by Country 2025 & 2033
- Figure 26: South America Fused Fiber Optic Wdms Volume Share (%), by Country 2025 & 2033
- Figure 27: Europe Fused Fiber Optic Wdms Revenue (million), by Application 2025 & 2033
- Figure 28: Europe Fused Fiber Optic Wdms Volume (K), by Application 2025 & 2033
- Figure 29: Europe Fused Fiber Optic Wdms Revenue Share (%), by Application 2025 & 2033
- Figure 30: Europe Fused Fiber Optic Wdms Volume Share (%), by Application 2025 & 2033
- Figure 31: Europe Fused Fiber Optic Wdms Revenue (million), by Type 2025 & 2033
- Figure 32: Europe Fused Fiber Optic Wdms Volume (K), by Type 2025 & 2033
- Figure 33: Europe Fused Fiber Optic Wdms Revenue Share (%), by Type 2025 & 2033
- Figure 34: Europe Fused Fiber Optic Wdms Volume Share (%), by Type 2025 & 2033
- Figure 35: Europe Fused Fiber Optic Wdms Revenue (million), by Country 2025 & 2033
- Figure 36: Europe Fused Fiber Optic Wdms Volume (K), by Country 2025 & 2033
- Figure 37: Europe Fused Fiber Optic Wdms Revenue Share (%), by Country 2025 & 2033
- Figure 38: Europe Fused Fiber Optic Wdms Volume Share (%), by Country 2025 & 2033
- Figure 39: Middle East & Africa Fused Fiber Optic Wdms Revenue (million), by Application 2025 & 2033
- Figure 40: Middle East & Africa Fused Fiber Optic Wdms Volume (K), by Application 2025 & 2033
- Figure 41: Middle East & Africa Fused Fiber Optic Wdms Revenue Share (%), by Application 2025 & 2033
- Figure 42: Middle East & Africa Fused Fiber Optic Wdms Volume Share (%), by Application 2025 & 2033
- Figure 43: Middle East & Africa Fused Fiber Optic Wdms Revenue (million), by Type 2025 & 2033
- Figure 44: Middle East & Africa Fused Fiber Optic Wdms Volume (K), by Type 2025 & 2033
- Figure 45: Middle East & Africa Fused Fiber Optic Wdms Revenue Share (%), by Type 2025 & 2033
- Figure 46: Middle East & Africa Fused Fiber Optic Wdms Volume Share (%), by Type 2025 & 2033
- Figure 47: Middle East & Africa Fused Fiber Optic Wdms Revenue (million), by Country 2025 & 2033
- Figure 48: Middle East & Africa Fused Fiber Optic Wdms Volume (K), by Country 2025 & 2033
- Figure 49: Middle East & Africa Fused Fiber Optic Wdms Revenue Share (%), by Country 2025 & 2033
- Figure 50: Middle East & Africa Fused Fiber Optic Wdms Volume Share (%), by Country 2025 & 2033
- Figure 51: Asia Pacific Fused Fiber Optic Wdms Revenue (million), by Application 2025 & 2033
- Figure 52: Asia Pacific Fused Fiber Optic Wdms Volume (K), by Application 2025 & 2033
- Figure 53: Asia Pacific Fused Fiber Optic Wdms Revenue Share (%), by Application 2025 & 2033
- Figure 54: Asia Pacific Fused Fiber Optic Wdms Volume Share (%), by Application 2025 & 2033
- Figure 55: Asia Pacific Fused Fiber Optic Wdms Revenue (million), by Type 2025 & 2033
- Figure 56: Asia Pacific Fused Fiber Optic Wdms Volume (K), by Type 2025 & 2033
- Figure 57: Asia Pacific Fused Fiber Optic Wdms Revenue Share (%), by Type 2025 & 2033
- Figure 58: Asia Pacific Fused Fiber Optic Wdms Volume Share (%), by Type 2025 & 2033
- Figure 59: Asia Pacific Fused Fiber Optic Wdms Revenue (million), by Country 2025 & 2033
- Figure 60: Asia Pacific Fused Fiber Optic Wdms Volume (K), by Country 2025 & 2033
- Figure 61: Asia Pacific Fused Fiber Optic Wdms Revenue Share (%), by Country 2025 & 2033
- Figure 62: Asia Pacific Fused Fiber Optic Wdms Volume Share (%), by Country 2025 & 2033
List of Tables
- Table 1: Global Fused Fiber Optic Wdms Revenue million Forecast, by Application 2020 & 2033
- Table 2: Global Fused Fiber Optic Wdms Volume K Forecast, by Application 2020 & 2033
- Table 3: Global Fused Fiber Optic Wdms Revenue million Forecast, by Type 2020 & 2033
- Table 4: Global Fused Fiber Optic Wdms Volume K Forecast, by Type 2020 & 2033
- Table 5: Global Fused Fiber Optic Wdms Revenue million Forecast, by Region 2020 & 2033
- Table 6: Global Fused Fiber Optic Wdms Volume K Forecast, by Region 2020 & 2033
- Table 7: Global Fused Fiber Optic Wdms Revenue million Forecast, by Application 2020 & 2033
- Table 8: Global Fused Fiber Optic Wdms Volume K Forecast, by Application 2020 & 2033
- Table 9: Global Fused Fiber Optic Wdms Revenue million Forecast, by Type 2020 & 2033
- Table 10: Global Fused Fiber Optic Wdms Volume K Forecast, by Type 2020 & 2033
- Table 11: Global Fused Fiber Optic Wdms Revenue million Forecast, by Country 2020 & 2033
- Table 12: Global Fused Fiber Optic Wdms Volume K Forecast, by Country 2020 & 2033
- Table 13: United States Fused Fiber Optic Wdms Revenue (million) Forecast, by Application 2020 & 2033
- Table 14: United States Fused Fiber Optic Wdms Volume (K) Forecast, by Application 2020 & 2033
- Table 15: Canada Fused Fiber Optic Wdms Revenue (million) Forecast, by Application 2020 & 2033
- Table 16: Canada Fused Fiber Optic Wdms Volume (K) Forecast, by Application 2020 & 2033
- Table 17: Mexico Fused Fiber Optic Wdms Revenue (million) Forecast, by Application 2020 & 2033
- Table 18: Mexico Fused Fiber Optic Wdms Volume (K) Forecast, by Application 2020 & 2033
- Table 19: Global Fused Fiber Optic Wdms Revenue million Forecast, by Application 2020 & 2033
- Table 20: Global Fused Fiber Optic Wdms Volume K Forecast, by Application 2020 & 2033
- Table 21: Global Fused Fiber Optic Wdms Revenue million Forecast, by Type 2020 & 2033
- Table 22: Global Fused Fiber Optic Wdms Volume K Forecast, by Type 2020 & 2033
- Table 23: Global Fused Fiber Optic Wdms Revenue million Forecast, by Country 2020 & 2033
- Table 24: Global Fused Fiber Optic Wdms Volume K Forecast, by Country 2020 & 2033
- Table 25: Brazil Fused Fiber Optic Wdms Revenue (million) Forecast, by Application 2020 & 2033
- Table 26: Brazil Fused Fiber Optic Wdms Volume (K) Forecast, by Application 2020 & 2033
- Table 27: Argentina Fused Fiber Optic Wdms Revenue (million) Forecast, by Application 2020 & 2033
- Table 28: Argentina Fused Fiber Optic Wdms Volume (K) Forecast, by Application 2020 & 2033
- Table 29: Rest of South America Fused Fiber Optic Wdms Revenue (million) Forecast, by Application 2020 & 2033
- Table 30: Rest of South America Fused Fiber Optic Wdms Volume (K) Forecast, by Application 2020 & 2033
- Table 31: Global Fused Fiber Optic Wdms Revenue million Forecast, by Application 2020 & 2033
- Table 32: Global Fused Fiber Optic Wdms Volume K Forecast, by Application 2020 & 2033
- Table 33: Global Fused Fiber Optic Wdms Revenue million Forecast, by Type 2020 & 2033
- Table 34: Global Fused Fiber Optic Wdms Volume K Forecast, by Type 2020 & 2033
- Table 35: Global Fused Fiber Optic Wdms Revenue million Forecast, by Country 2020 & 2033
- Table 36: Global Fused Fiber Optic Wdms Volume K Forecast, by Country 2020 & 2033
- Table 37: United Kingdom Fused Fiber Optic Wdms Revenue (million) Forecast, by Application 2020 & 2033
- Table 38: United Kingdom Fused Fiber Optic Wdms Volume (K) Forecast, by Application 2020 & 2033
- Table 39: Germany Fused Fiber Optic Wdms Revenue (million) Forecast, by Application 2020 & 2033
- Table 40: Germany Fused Fiber Optic Wdms Volume (K) Forecast, by Application 2020 & 2033
- Table 41: France Fused Fiber Optic Wdms Revenue (million) Forecast, by Application 2020 & 2033
- Table 42: France Fused Fiber Optic Wdms Volume (K) Forecast, by Application 2020 & 2033
- Table 43: Italy Fused Fiber Optic Wdms Revenue (million) Forecast, by Application 2020 & 2033
- Table 44: Italy Fused Fiber Optic Wdms Volume (K) Forecast, by Application 2020 & 2033
- Table 45: Spain Fused Fiber Optic Wdms Revenue (million) Forecast, by Application 2020 & 2033
- Table 46: Spain Fused Fiber Optic Wdms Volume (K) Forecast, by Application 2020 & 2033
- Table 47: Russia Fused Fiber Optic Wdms Revenue (million) Forecast, by Application 2020 & 2033
- Table 48: Russia Fused Fiber Optic Wdms Volume (K) Forecast, by Application 2020 & 2033
- Table 49: Benelux Fused Fiber Optic Wdms Revenue (million) Forecast, by Application 2020 & 2033
- Table 50: Benelux Fused Fiber Optic Wdms Volume (K) Forecast, by Application 2020 & 2033
- Table 51: Nordics Fused Fiber Optic Wdms Revenue (million) Forecast, by Application 2020 & 2033
- Table 52: Nordics Fused Fiber Optic Wdms Volume (K) Forecast, by Application 2020 & 2033
- Table 53: Rest of Europe Fused Fiber Optic Wdms Revenue (million) Forecast, by Application 2020 & 2033
- Table 54: Rest of Europe Fused Fiber Optic Wdms Volume (K) Forecast, by Application 2020 & 2033
- Table 55: Global Fused Fiber Optic Wdms Revenue million Forecast, by Application 2020 & 2033
- Table 56: Global Fused Fiber Optic Wdms Volume K Forecast, by Application 2020 & 2033
- Table 57: Global Fused Fiber Optic Wdms Revenue million Forecast, by Type 2020 & 2033
- Table 58: Global Fused Fiber Optic Wdms Volume K Forecast, by Type 2020 & 2033
- Table 59: Global Fused Fiber Optic Wdms Revenue million Forecast, by Country 2020 & 2033
- Table 60: Global Fused Fiber Optic Wdms Volume K Forecast, by Country 2020 & 2033
- Table 61: Turkey Fused Fiber Optic Wdms Revenue (million) Forecast, by Application 2020 & 2033
- Table 62: Turkey Fused Fiber Optic Wdms Volume (K) Forecast, by Application 2020 & 2033
- Table 63: Israel Fused Fiber Optic Wdms Revenue (million) Forecast, by Application 2020 & 2033
- Table 64: Israel Fused Fiber Optic Wdms Volume (K) Forecast, by Application 2020 & 2033
- Table 65: GCC Fused Fiber Optic Wdms Revenue (million) Forecast, by Application 2020 & 2033
- Table 66: GCC Fused Fiber Optic Wdms Volume (K) Forecast, by Application 2020 & 2033
- Table 67: North Africa Fused Fiber Optic Wdms Revenue (million) Forecast, by Application 2020 & 2033
- Table 68: North Africa Fused Fiber Optic Wdms Volume (K) Forecast, by Application 2020 & 2033
- Table 69: South Africa Fused Fiber Optic Wdms Revenue (million) Forecast, by Application 2020 & 2033
- Table 70: South Africa Fused Fiber Optic Wdms Volume (K) Forecast, by Application 2020 & 2033
- Table 71: Rest of Middle East & Africa Fused Fiber Optic Wdms Revenue (million) Forecast, by Application 2020 & 2033
- Table 72: Rest of Middle East & Africa Fused Fiber Optic Wdms Volume (K) Forecast, by Application 2020 & 2033
- Table 73: Global Fused Fiber Optic Wdms Revenue million Forecast, by Application 2020 & 2033
- Table 74: Global Fused Fiber Optic Wdms Volume K Forecast, by Application 2020 & 2033
- Table 75: Global Fused Fiber Optic Wdms Revenue million Forecast, by Type 2020 & 2033
- Table 76: Global Fused Fiber Optic Wdms Volume K Forecast, by Type 2020 & 2033
- Table 77: Global Fused Fiber Optic Wdms Revenue million Forecast, by Country 2020 & 2033
- Table 78: Global Fused Fiber Optic Wdms Volume K Forecast, by Country 2020 & 2033
- Table 79: China Fused Fiber Optic Wdms Revenue (million) Forecast, by Application 2020 & 2033
- Table 80: China Fused Fiber Optic Wdms Volume (K) Forecast, by Application 2020 & 2033
- Table 81: India Fused Fiber Optic Wdms Revenue (million) Forecast, by Application 2020 & 2033
- Table 82: India Fused Fiber Optic Wdms Volume (K) Forecast, by Application 2020 & 2033
- Table 83: Japan Fused Fiber Optic Wdms Revenue (million) Forecast, by Application 2020 & 2033
- Table 84: Japan Fused Fiber Optic Wdms Volume (K) Forecast, by Application 2020 & 2033
- Table 85: South Korea Fused Fiber Optic Wdms Revenue (million) Forecast, by Application 2020 & 2033
- Table 86: South Korea Fused Fiber Optic Wdms Volume (K) Forecast, by Application 2020 & 2033
- Table 87: ASEAN Fused Fiber Optic Wdms Revenue (million) Forecast, by Application 2020 & 2033
- Table 88: ASEAN Fused Fiber Optic Wdms Volume (K) Forecast, by Application 2020 & 2033
- Table 89: Oceania Fused Fiber Optic Wdms Revenue (million) Forecast, by Application 2020 & 2033
- Table 90: Oceania Fused Fiber Optic Wdms Volume (K) Forecast, by Application 2020 & 2033
- Table 91: Rest of Asia Pacific Fused Fiber Optic Wdms Revenue (million) Forecast, by Application 2020 & 2033
- Table 92: Rest of Asia Pacific Fused Fiber Optic Wdms Volume (K) Forecast, by Application 2020 & 2033
Frequently Asked Questions
1. What is the projected Compound Annual Growth Rate (CAGR) of the Fused Fiber Optic Wdms?
The projected CAGR is approximately XXX%.
2. Which companies are prominent players in the Fused Fiber Optic Wdms?
Key companies in the market include Thorlabs, Lfiber Optic, Agiltron, Newport, AFW Technologies, OptiWorks, OPTOKON, Gooch & Housego, Lightel, AFL Global, Corning, Senko Advanced Components, Ascentta, Opto-Link Corporation, Anfiber Technology Limited, LEAD Fiber Optics, Ruik-Tech Communication, Casix.
3. What are the main segments of the Fused Fiber Optic Wdms?
The market segments include Application, Type.
4. Can you provide details about the market size?
The market size is estimated to be USD XXX million as of 2022.
5. What are some drivers contributing to market growth?
N/A
6. What are the notable trends driving market growth?
N/A
7. Are there any restraints impacting market growth?
N/A
8. Can you provide examples of recent developments in the market?
N/A
9. What pricing options are available for accessing the report?
Pricing options include single-user, multi-user, and enterprise licenses priced at USD 3950.00, USD 5925.00, and USD 7900.00 respectively.
10. Is the market size provided in terms of value or volume?
The market size is provided in terms of value, measured in million and volume, measured in K.
11. Are there any specific market keywords associated with the report?
Yes, the market keyword associated with the report is "Fused Fiber Optic Wdms," which aids in identifying and referencing the specific market segment covered.
12. How do I determine which pricing option suits my needs best?
The pricing options vary based on user requirements and access needs. Individual users may opt for single-user licenses, while businesses requiring broader access may choose multi-user or enterprise licenses for cost-effective access to the report.
13. Are there any additional resources or data provided in the Fused Fiber Optic Wdms report?
While the report offers comprehensive insights, it's advisable to review the specific contents or supplementary materials provided to ascertain if additional resources or data are available.
14. How can I stay updated on further developments or reports in the Fused Fiber Optic Wdms?
To stay informed about further developments, trends, and reports in the Fused Fiber Optic Wdms, consider subscribing to industry newsletters, following relevant companies and organizations, or regularly checking reputable industry news sources and publications.
Methodology
Step 1 - Identification of Relevant Samples Size from Population Database


Step 2 - Approaches for Defining Global Market Size (Value, Volume* & Price*)

Note*: In applicable scenarios
Step 3 - Data Sources
Primary Research
- Web Analytics
- Survey Reports
- Research Institute
- Latest Research Reports
- Opinion Leaders
Secondary Research
- Annual Reports
- White Paper
- Latest Press Release
- Industry Association
- Paid Database
- Investor Presentations

Step 4 - Data Triangulation
Involves using different sources of information in order to increase the validity of a study
These sources are likely to be stakeholders in a program - participants, other researchers, program staff, other community members, and so on.
Then we put all data in single framework & apply various statistical tools to find out the dynamic on the market.
During the analysis stage, feedback from the stakeholder groups would be compared to determine areas of agreement as well as areas of divergence