

Key Insights
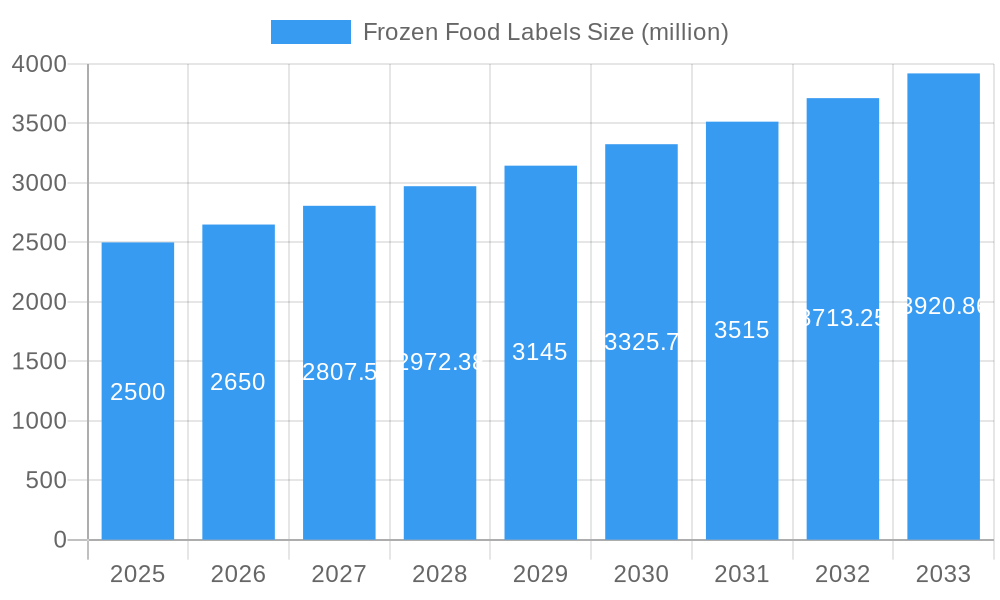
The global frozen food label market is poised for significant expansion, propelled by the robust growth of the frozen food industry and escalating consumer preference for convenient meal solutions. Key growth drivers include the surging popularity of ready-to-eat frozen meals, a growing demand for healthier frozen options with transparent labeling, and the integration of advanced labeling technologies such as QR codes and smart labels for enhanced traceability. The proliferation of e-commerce further bolsters this trend, where compelling product labels are essential for online sales performance. Despite potential challenges from stringent regulations and fluctuating raw material costs, the market outlook is decidedly optimistic. We project the market size to reach $335.58 billion by 2025, with an estimated compound annual growth rate (CAGR) of 4.12%, reflecting underlying growth dynamics within the broader food packaging and frozen food sectors. Sustained demand for convenient frozen foods, coupled with increasing disposable incomes, particularly in emerging economies, will continue to fuel this growth trajectory.
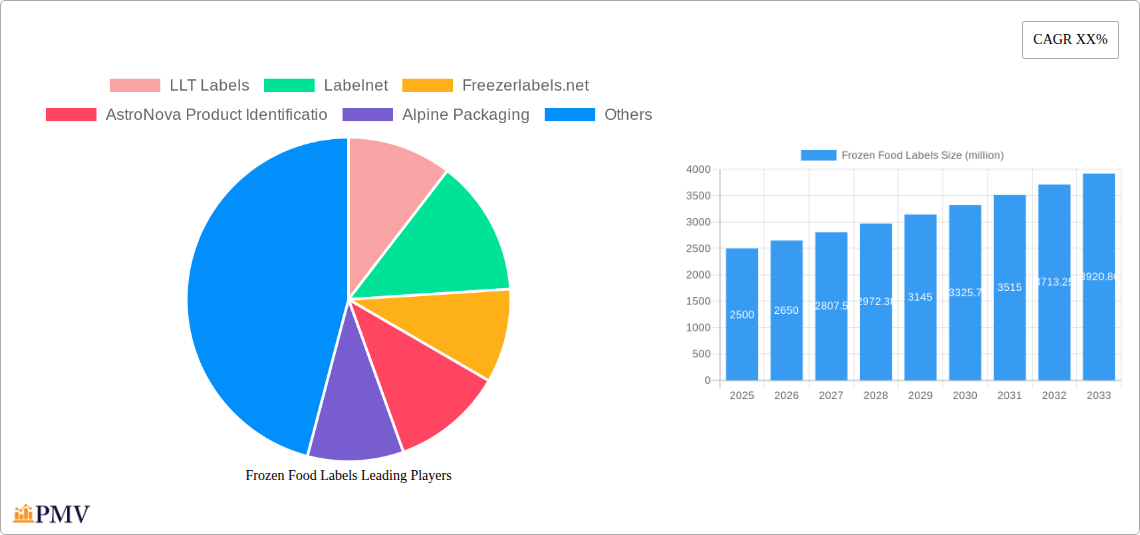
Frozen Food Labels Market Size (In Billion)
The frozen food label market is highly competitive, featuring a blend of established multinational corporations and agile regional enterprises. Prominent players such as LLT Labels, Labelnet, and AstroNova Product Identification are capitalizing on their market presence and technological capabilities. Concurrently, smaller, specialized companies are carving out significant market share by offering tailored solutions and addressing niche demands. A notable trend is the increasing adoption of sustainable and eco-friendly labeling materials, driven by heightened consumer environmental awareness. This focus on sustainability is expected to shape future market dynamics, with substantial investment in biodegradable and recyclable label alternatives. Geographic growth patterns are anticipated to vary, with steady expansion in mature markets like North America and Europe, while emerging economies in Asia and Latin America are projected for substantial growth fueled by rising purchasing power and escalating frozen food consumption.
Frozen Food Labels Company Market Share
Frozen Food Labels Market Report: 2019-2033
This comprehensive report provides an in-depth analysis of the global frozen food labels market, offering invaluable insights for businesses operating within this dynamic sector. The study period covers 2019-2033, with 2025 as the base and estimated year. The forecast period spans 2025-2033, and the historical period encompasses 2019-2024. This report projects a market value exceeding $XX million by 2033, driven by several key factors analyzed within.
Frozen Food Labels Market Structure & Competitive Dynamics
The frozen food labels market exhibits a moderately consolidated structure, with several major players commanding significant market share. LLT Labels, Labelnet, and Freezerlabels.net are among the key companies shaping the competitive landscape. Market concentration is estimated at xx%, reflecting a balance between established players and emerging entrants. Innovation ecosystems are robust, with companies continuously developing new label materials, printing technologies, and sustainable solutions. Regulatory frameworks, including food safety regulations and environmental standards, significantly impact label production and design. Product substitutes, such as digital printing technologies, present both opportunities and challenges. End-user trends towards eco-friendly packaging are driving demand for sustainable label materials. The market has witnessed several M&A activities in recent years, with deal values exceeding $XX million annually.
- Market Share: LLT Labels (xx%), Labelnet (xx%), Freezerlabels.net (xx%), Others (xx%).
- M&A Activity: XX major mergers and acquisitions recorded between 2019-2024, with a total deal value exceeding $XX million.
- Key Competitive Dynamics: Focus on innovation, sustainability, cost optimization, and strategic partnerships.
Frozen Food Labels Industry Trends & Insights
The frozen food labels market is experiencing robust growth, driven by the increasing demand for frozen food products globally. The Compound Annual Growth Rate (CAGR) during the forecast period (2025-2033) is projected to be xx%. This growth is fueled by several factors: rising disposable incomes, changing consumer lifestyles, and the expanding global frozen food industry. Technological disruptions, such as the adoption of digital printing and advanced materials, are reshaping production processes and label design capabilities. Consumer preferences are shifting towards sustainable and eco-friendly packaging, driving demand for biodegradable and recyclable labels. Market penetration of sustainable labels is expected to reach xx% by 2033. The competitive landscape remains dynamic, with companies investing heavily in R&D and strategic partnerships to gain a competitive edge.
Dominant Markets & Segments in Frozen Food Labels
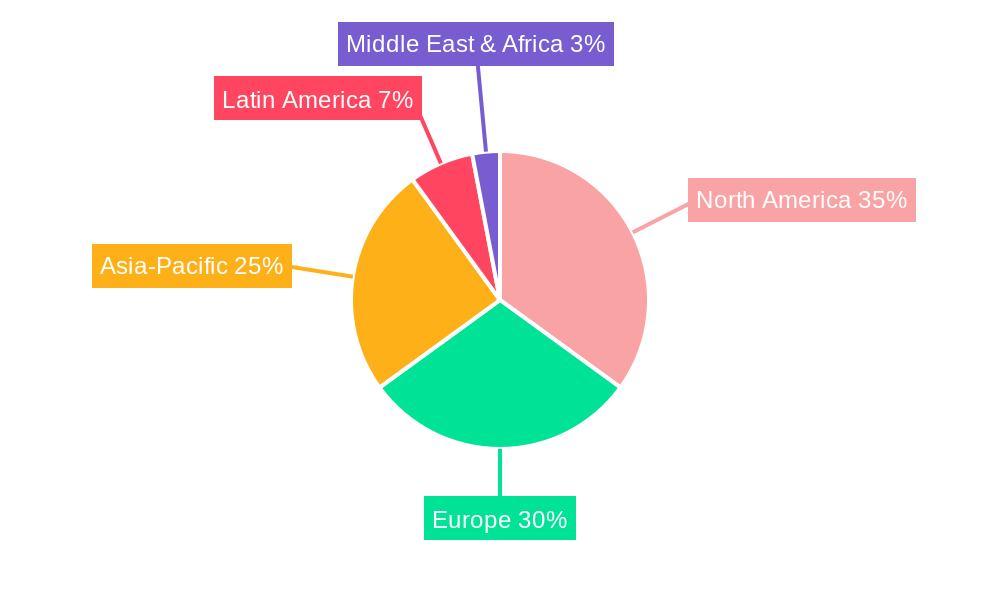
The North American region currently dominates the global frozen food labels market, accounting for xx% of the total market value in 2025. This dominance is attributed to several factors:
- Key Drivers:
- High per capita consumption of frozen food.
- Well-established frozen food industry infrastructure.
- Stringent food safety regulations driving demand for high-quality labels.
- Robust technological advancements in label production.
- Dominance Analysis: North America's large and mature frozen food sector, coupled with high consumer demand for convenient and readily-available food options, significantly contributes to its leading position in the frozen food labels market. The region's advanced packaging technology infrastructure also plays a crucial role.
Frozen Food Labels Product Innovations
Recent product innovations in the frozen food labels market include the development of freezer-resistant, sustainable, and tamper-evident labels. These innovations are driven by technological advancements in materials science and printing technologies. Companies are focusing on developing labels that provide enhanced durability, improved printability, and increased shelf life for frozen food products. The integration of smart labels with tracking capabilities is another key area of focus, enhancing supply chain efficiency and product traceability. These innovations are improving product safety and appeal, thus strengthening market fit.
Report Segmentation & Scope
The report segments the frozen food labels market based on several factors:
- By Label Type: This includes flexible labels, pressure-sensitive labels, and other specialized labels. The flexible label segment is projected to witness substantial growth due to its adaptability to diverse packaging formats.
- By Material Type: This includes paper, film, and other materials. Sustainable materials are gaining traction, driven by eco-conscious consumer preferences.
- By Printing Technology: This includes flexography, digital printing, and other technologies. Digital printing is gaining popularity due to its versatility and cost-effectiveness for shorter print runs.
- By Application: This includes meat & poultry, fruits & vegetables, prepared meals, and others. The meat & poultry segment holds significant market share due to the large frozen food consumption of these products.
Each segment's market size, growth projections, and competitive dynamics are thoroughly examined within the report.
Key Drivers of Frozen Food Labels Growth
Several key factors are driving growth in the frozen food labels market: The rising demand for frozen food products globally, driven by changing consumer lifestyles and increased convenience seeking, is a primary driver. Technological advancements, such as improved printing techniques and sustainable material development, are also significantly impacting market expansion. Favorable government regulations supporting sustainable packaging further propel market growth. Finally, the increasing adoption of advanced labeling technologies, particularly for enhanced product traceability and safety, contributes to overall market expansion.
Challenges in the Frozen Food Labels Sector
The frozen food labels sector faces several challenges, including fluctuating raw material prices, which impact production costs. Stringent regulatory compliance requirements related to food safety and environmental protection add complexities and expenses to operations. Intense competition, particularly among established players, puts pressure on pricing and profitability. Supply chain disruptions and logistics challenges can hinder timely product delivery and affect overall production efficiency. These factors collectively contribute to a complex and dynamic market environment.
Leading Players in the Frozen Food Labels Market
- LLT Labels
- Labelnet
- Freezerlabels.net
- AstroNova Product Identification
- Alpine Packaging
- Harfield Components
- OnlineLabels
- Dot It Nation
- Cloud Labels
- GA International
- UPM Specialty Papers
- Windmill Tapes&Labels
Key Developments in Frozen Food Labels Sector
- 2022/03: Labelnet launches a new line of sustainable frozen food labels.
- 2023/10: LLT Labels acquires a smaller competitor, expanding its market share.
- 2024/06: New regulations regarding food traceability are implemented, impacting label requirements.
- 2025/02: Several companies announce investments in advanced printing technologies.
Strategic Frozen Food Labels Market Outlook
The frozen food labels market presents substantial growth opportunities. Expanding global demand for frozen foods, coupled with ongoing technological advancements and the increasing focus on sustainable packaging solutions, provides a strong foundation for future market expansion. Strategic investments in R&D, sustainable material development, and efficient supply chain management will be key factors in achieving success in this competitive market. Companies with a strong focus on innovation and consumer-centric product offerings are poised to benefit most from the predicted growth.
Frozen Food Labels Segmentation
-
1. Application
- 1.1. Fresh and Frozen Meats
- 1.2. Frozen Pet Food
- 1.3. Frozen Vegetables
- 1.4. Frozen Fruit
- 1.5. Bakery Products
- 1.6. Others
-
2. Types
- 2.1. Coated Paper
- 2.2. Synthetic Paper
- 2.3. Kraft Paper
- 2.4. Others
Frozen Food Labels Segmentation By Geography
-
1. North America
- 1.1. United States
- 1.2. Canada
- 1.3. Mexico
-
2. South America
- 2.1. Brazil
- 2.2. Argentina
- 2.3. Rest of South America
-
3. Europe
- 3.1. United Kingdom
- 3.2. Germany
- 3.3. France
- 3.4. Italy
- 3.5. Spain
- 3.6. Russia
- 3.7. Benelux
- 3.8. Nordics
- 3.9. Rest of Europe
-
4. Middle East & Africa
- 4.1. Turkey
- 4.2. Israel
- 4.3. GCC
- 4.4. North Africa
- 4.5. South Africa
- 4.6. Rest of Middle East & Africa
-
5. Asia Pacific
- 5.1. China
- 5.2. India
- 5.3. Japan
- 5.4. South Korea
- 5.5. ASEAN
- 5.6. Oceania
- 5.7. Rest of Asia Pacific
Frozen Food Labels Regional Market Share
Geographic Coverage of Frozen Food Labels
Frozen Food Labels REPORT HIGHLIGHTS
| Aspects | Details |
|---|---|
| Study Period | 2020-2034 |
| Base Year | 2025 |
| Estimated Year | 2026 |
| Forecast Period | 2026-2034 |
| Historical Period | 2020-2025 |
| Growth Rate | CAGR of 4.12% from 2020-2034 |
| Segmentation |
|
Table of Contents
- 1. Introduction
- 1.1. Research Scope
- 1.2. Market Segmentation
- 1.3. Research Objective
- 1.4. Definitions and Assumptions
- 2. Executive Summary
- 2.1. Market Snapshot
- 3. Market Dynamics
- 3.1. Market Drivers
- 3.2. Market Restrains
- 3.3. Market Trends
- 3.4. Market Opportunities
- 4. Market Factor Analysis
- 4.1. Porters Five Forces
- 4.1.1. Bargaining Power of Suppliers
- 4.1.2. Bargaining Power of Buyers
- 4.1.3. Threat of New Entrants
- 4.1.4. Threat of Substitutes
- 4.1.5. Competitive Rivalry
- 4.2. PESTEL analysis
- 4.3. BCG Analysis
- 4.3.1. Stars (High Growth, High Market Share)
- 4.3.2. Cash Cows (Low Growth, High Market Share)
- 4.3.3. Question Mark (High Growth, Low Market Share)
- 4.3.4. Dogs (Low Growth, Low Market Share)
- 4.4. Ansoff Matrix Analysis
- 4.5. Supply Chain Analysis
- 4.6. Regulatory Landscape
- 4.7. Current Market Potential and Opportunity Assessment (TAM–SAM–SOM Framework)
- 4.8. PMV Analyst Note
- 4.1. Porters Five Forces
- 5. Market Analysis, Insights and Forecast 2021-2033
- 5.1. Market Analysis, Insights and Forecast - by Application
- 5.1.1. Fresh and Frozen Meats
- 5.1.2. Frozen Pet Food
- 5.1.3. Frozen Vegetables
- 5.1.4. Frozen Fruit
- 5.1.5. Bakery Products
- 5.1.6. Others
- 5.2. Market Analysis, Insights and Forecast - by Types
- 5.2.1. Coated Paper
- 5.2.2. Synthetic Paper
- 5.2.3. Kraft Paper
- 5.2.4. Others
- 5.3. Market Analysis, Insights and Forecast - by Region
- 5.3.1. North America
- 5.3.2. South America
- 5.3.3. Europe
- 5.3.4. Middle East & Africa
- 5.3.5. Asia Pacific
- 5.1. Market Analysis, Insights and Forecast - by Application
- 6. Global Frozen Food Labels Analysis, Insights and Forecast, 2021-2033
- 6.1. Market Analysis, Insights and Forecast - by Application
- 6.1.1. Fresh and Frozen Meats
- 6.1.2. Frozen Pet Food
- 6.1.3. Frozen Vegetables
- 6.1.4. Frozen Fruit
- 6.1.5. Bakery Products
- 6.1.6. Others
- 6.2. Market Analysis, Insights and Forecast - by Types
- 6.2.1. Coated Paper
- 6.2.2. Synthetic Paper
- 6.2.3. Kraft Paper
- 6.2.4. Others
- 6.1. Market Analysis, Insights and Forecast - by Application
- 7. North America Frozen Food Labels Analysis, Insights and Forecast, 2020-2032
- 7.1. Market Analysis, Insights and Forecast - by Application
- 7.1.1. Fresh and Frozen Meats
- 7.1.2. Frozen Pet Food
- 7.1.3. Frozen Vegetables
- 7.1.4. Frozen Fruit
- 7.1.5. Bakery Products
- 7.1.6. Others
- 7.2. Market Analysis, Insights and Forecast - by Types
- 7.2.1. Coated Paper
- 7.2.2. Synthetic Paper
- 7.2.3. Kraft Paper
- 7.2.4. Others
- 7.1. Market Analysis, Insights and Forecast - by Application
- 8. South America Frozen Food Labels Analysis, Insights and Forecast, 2020-2032
- 8.1. Market Analysis, Insights and Forecast - by Application
- 8.1.1. Fresh and Frozen Meats
- 8.1.2. Frozen Pet Food
- 8.1.3. Frozen Vegetables
- 8.1.4. Frozen Fruit
- 8.1.5. Bakery Products
- 8.1.6. Others
- 8.2. Market Analysis, Insights and Forecast - by Types
- 8.2.1. Coated Paper
- 8.2.2. Synthetic Paper
- 8.2.3. Kraft Paper
- 8.2.4. Others
- 8.1. Market Analysis, Insights and Forecast - by Application
- 9. Europe Frozen Food Labels Analysis, Insights and Forecast, 2020-2032
- 9.1. Market Analysis, Insights and Forecast - by Application
- 9.1.1. Fresh and Frozen Meats
- 9.1.2. Frozen Pet Food
- 9.1.3. Frozen Vegetables
- 9.1.4. Frozen Fruit
- 9.1.5. Bakery Products
- 9.1.6. Others
- 9.2. Market Analysis, Insights and Forecast - by Types
- 9.2.1. Coated Paper
- 9.2.2. Synthetic Paper
- 9.2.3. Kraft Paper
- 9.2.4. Others
- 9.1. Market Analysis, Insights and Forecast - by Application
- 10. Middle East & Africa Frozen Food Labels Analysis, Insights and Forecast, 2020-2032
- 10.1. Market Analysis, Insights and Forecast - by Application
- 10.1.1. Fresh and Frozen Meats
- 10.1.2. Frozen Pet Food
- 10.1.3. Frozen Vegetables
- 10.1.4. Frozen Fruit
- 10.1.5. Bakery Products
- 10.1.6. Others
- 10.2. Market Analysis, Insights and Forecast - by Types
- 10.2.1. Coated Paper
- 10.2.2. Synthetic Paper
- 10.2.3. Kraft Paper
- 10.2.4. Others
- 10.1. Market Analysis, Insights and Forecast - by Application
- 11. Asia Pacific Frozen Food Labels Analysis, Insights and Forecast, 2020-2032
- 11.1. Market Analysis, Insights and Forecast - by Application
- 11.1.1. Fresh and Frozen Meats
- 11.1.2. Frozen Pet Food
- 11.1.3. Frozen Vegetables
- 11.1.4. Frozen Fruit
- 11.1.5. Bakery Products
- 11.1.6. Others
- 11.2. Market Analysis, Insights and Forecast - by Types
- 11.2.1. Coated Paper
- 11.2.2. Synthetic Paper
- 11.2.3. Kraft Paper
- 11.2.4. Others
- 11.1. Market Analysis, Insights and Forecast - by Application
- 12. Competitive Analysis
- 12.1. Company Profiles
- 12.1.1 LLT Labels
- 12.1.1.1. Company Overview
- 12.1.1.2. Products
- 12.1.1.3. Company Financials
- 12.1.1.4. SWOT Analysis
- 12.1.2 Labelnet
- 12.1.2.1. Company Overview
- 12.1.2.2. Products
- 12.1.2.3. Company Financials
- 12.1.2.4. SWOT Analysis
- 12.1.3 Freezerlabels.net
- 12.1.3.1. Company Overview
- 12.1.3.2. Products
- 12.1.3.3. Company Financials
- 12.1.3.4. SWOT Analysis
- 12.1.4 AstroNova Product Identificatio
- 12.1.4.1. Company Overview
- 12.1.4.2. Products
- 12.1.4.3. Company Financials
- 12.1.4.4. SWOT Analysis
- 12.1.5 Alpine Packaging
- 12.1.5.1. Company Overview
- 12.1.5.2. Products
- 12.1.5.3. Company Financials
- 12.1.5.4. SWOT Analysis
- 12.1.6 Harfield Components
- 12.1.6.1. Company Overview
- 12.1.6.2. Products
- 12.1.6.3. Company Financials
- 12.1.6.4. SWOT Analysis
- 12.1.7 OnlineLabels
- 12.1.7.1. Company Overview
- 12.1.7.2. Products
- 12.1.7.3. Company Financials
- 12.1.7.4. SWOT Analysis
- 12.1.8 Dot It Nation
- 12.1.8.1. Company Overview
- 12.1.8.2. Products
- 12.1.8.3. Company Financials
- 12.1.8.4. SWOT Analysis
- 12.1.9 Cloud Labels
- 12.1.9.1. Company Overview
- 12.1.9.2. Products
- 12.1.9.3. Company Financials
- 12.1.9.4. SWOT Analysis
- 12.1.10 GA International
- 12.1.10.1. Company Overview
- 12.1.10.2. Products
- 12.1.10.3. Company Financials
- 12.1.10.4. SWOT Analysis
- 12.1.11 UPM Specialty Papers
- 12.1.11.1. Company Overview
- 12.1.11.2. Products
- 12.1.11.3. Company Financials
- 12.1.11.4. SWOT Analysis
- 12.1.12 Windmill Tapes&Labels
- 12.1.12.1. Company Overview
- 12.1.12.2. Products
- 12.1.12.3. Company Financials
- 12.1.12.4. SWOT Analysis
- 12.1.1 LLT Labels
- 12.2. Market Entropy
- 12.2.1 Company's Key Areas Served
- 12.2.2 Recent Developments
- 12.3. Company Market Share Analysis 2025
- 12.3.1 Top 5 Companies Market Share Analysis
- 12.3.2 Top 3 Companies Market Share Analysis
- 12.4. List of Potential Customers
- 13. Research Methodology
List of Figures
- Figure 1: Global Frozen Food Labels Revenue Breakdown (billion, %) by Region 2025 & 2033
- Figure 2: Global Frozen Food Labels Volume Breakdown (K, %) by Region 2025 & 2033
- Figure 3: North America Frozen Food Labels Revenue (billion), by Application 2025 & 2033
- Figure 4: North America Frozen Food Labels Volume (K), by Application 2025 & 2033
- Figure 5: North America Frozen Food Labels Revenue Share (%), by Application 2025 & 2033
- Figure 6: North America Frozen Food Labels Volume Share (%), by Application 2025 & 2033
- Figure 7: North America Frozen Food Labels Revenue (billion), by Types 2025 & 2033
- Figure 8: North America Frozen Food Labels Volume (K), by Types 2025 & 2033
- Figure 9: North America Frozen Food Labels Revenue Share (%), by Types 2025 & 2033
- Figure 10: North America Frozen Food Labels Volume Share (%), by Types 2025 & 2033
- Figure 11: North America Frozen Food Labels Revenue (billion), by Country 2025 & 2033
- Figure 12: North America Frozen Food Labels Volume (K), by Country 2025 & 2033
- Figure 13: North America Frozen Food Labels Revenue Share (%), by Country 2025 & 2033
- Figure 14: North America Frozen Food Labels Volume Share (%), by Country 2025 & 2033
- Figure 15: South America Frozen Food Labels Revenue (billion), by Application 2025 & 2033
- Figure 16: South America Frozen Food Labels Volume (K), by Application 2025 & 2033
- Figure 17: South America Frozen Food Labels Revenue Share (%), by Application 2025 & 2033
- Figure 18: South America Frozen Food Labels Volume Share (%), by Application 2025 & 2033
- Figure 19: South America Frozen Food Labels Revenue (billion), by Types 2025 & 2033
- Figure 20: South America Frozen Food Labels Volume (K), by Types 2025 & 2033
- Figure 21: South America Frozen Food Labels Revenue Share (%), by Types 2025 & 2033
- Figure 22: South America Frozen Food Labels Volume Share (%), by Types 2025 & 2033
- Figure 23: South America Frozen Food Labels Revenue (billion), by Country 2025 & 2033
- Figure 24: South America Frozen Food Labels Volume (K), by Country 2025 & 2033
- Figure 25: South America Frozen Food Labels Revenue Share (%), by Country 2025 & 2033
- Figure 26: South America Frozen Food Labels Volume Share (%), by Country 2025 & 2033
- Figure 27: Europe Frozen Food Labels Revenue (billion), by Application 2025 & 2033
- Figure 28: Europe Frozen Food Labels Volume (K), by Application 2025 & 2033
- Figure 29: Europe Frozen Food Labels Revenue Share (%), by Application 2025 & 2033
- Figure 30: Europe Frozen Food Labels Volume Share (%), by Application 2025 & 2033
- Figure 31: Europe Frozen Food Labels Revenue (billion), by Types 2025 & 2033
- Figure 32: Europe Frozen Food Labels Volume (K), by Types 2025 & 2033
- Figure 33: Europe Frozen Food Labels Revenue Share (%), by Types 2025 & 2033
- Figure 34: Europe Frozen Food Labels Volume Share (%), by Types 2025 & 2033
- Figure 35: Europe Frozen Food Labels Revenue (billion), by Country 2025 & 2033
- Figure 36: Europe Frozen Food Labels Volume (K), by Country 2025 & 2033
- Figure 37: Europe Frozen Food Labels Revenue Share (%), by Country 2025 & 2033
- Figure 38: Europe Frozen Food Labels Volume Share (%), by Country 2025 & 2033
- Figure 39: Middle East & Africa Frozen Food Labels Revenue (billion), by Application 2025 & 2033
- Figure 40: Middle East & Africa Frozen Food Labels Volume (K), by Application 2025 & 2033
- Figure 41: Middle East & Africa Frozen Food Labels Revenue Share (%), by Application 2025 & 2033
- Figure 42: Middle East & Africa Frozen Food Labels Volume Share (%), by Application 2025 & 2033
- Figure 43: Middle East & Africa Frozen Food Labels Revenue (billion), by Types 2025 & 2033
- Figure 44: Middle East & Africa Frozen Food Labels Volume (K), by Types 2025 & 2033
- Figure 45: Middle East & Africa Frozen Food Labels Revenue Share (%), by Types 2025 & 2033
- Figure 46: Middle East & Africa Frozen Food Labels Volume Share (%), by Types 2025 & 2033
- Figure 47: Middle East & Africa Frozen Food Labels Revenue (billion), by Country 2025 & 2033
- Figure 48: Middle East & Africa Frozen Food Labels Volume (K), by Country 2025 & 2033
- Figure 49: Middle East & Africa Frozen Food Labels Revenue Share (%), by Country 2025 & 2033
- Figure 50: Middle East & Africa Frozen Food Labels Volume Share (%), by Country 2025 & 2033
- Figure 51: Asia Pacific Frozen Food Labels Revenue (billion), by Application 2025 & 2033
- Figure 52: Asia Pacific Frozen Food Labels Volume (K), by Application 2025 & 2033
- Figure 53: Asia Pacific Frozen Food Labels Revenue Share (%), by Application 2025 & 2033
- Figure 54: Asia Pacific Frozen Food Labels Volume Share (%), by Application 2025 & 2033
- Figure 55: Asia Pacific Frozen Food Labels Revenue (billion), by Types 2025 & 2033
- Figure 56: Asia Pacific Frozen Food Labels Volume (K), by Types 2025 & 2033
- Figure 57: Asia Pacific Frozen Food Labels Revenue Share (%), by Types 2025 & 2033
- Figure 58: Asia Pacific Frozen Food Labels Volume Share (%), by Types 2025 & 2033
- Figure 59: Asia Pacific Frozen Food Labels Revenue (billion), by Country 2025 & 2033
- Figure 60: Asia Pacific Frozen Food Labels Volume (K), by Country 2025 & 2033
- Figure 61: Asia Pacific Frozen Food Labels Revenue Share (%), by Country 2025 & 2033
- Figure 62: Asia Pacific Frozen Food Labels Volume Share (%), by Country 2025 & 2033
List of Tables
- Table 1: Global Frozen Food Labels Revenue billion Forecast, by Application 2020 & 2033
- Table 2: Global Frozen Food Labels Volume K Forecast, by Application 2020 & 2033
- Table 3: Global Frozen Food Labels Revenue billion Forecast, by Types 2020 & 2033
- Table 4: Global Frozen Food Labels Volume K Forecast, by Types 2020 & 2033
- Table 5: Global Frozen Food Labels Revenue billion Forecast, by Region 2020 & 2033
- Table 6: Global Frozen Food Labels Volume K Forecast, by Region 2020 & 2033
- Table 7: Global Frozen Food Labels Revenue billion Forecast, by Application 2020 & 2033
- Table 8: Global Frozen Food Labels Volume K Forecast, by Application 2020 & 2033
- Table 9: Global Frozen Food Labels Revenue billion Forecast, by Types 2020 & 2033
- Table 10: Global Frozen Food Labels Volume K Forecast, by Types 2020 & 2033
- Table 11: Global Frozen Food Labels Revenue billion Forecast, by Country 2020 & 2033
- Table 12: Global Frozen Food Labels Volume K Forecast, by Country 2020 & 2033
- Table 13: United States Frozen Food Labels Revenue (billion) Forecast, by Application 2020 & 2033
- Table 14: United States Frozen Food Labels Volume (K) Forecast, by Application 2020 & 2033
- Table 15: Canada Frozen Food Labels Revenue (billion) Forecast, by Application 2020 & 2033
- Table 16: Canada Frozen Food Labels Volume (K) Forecast, by Application 2020 & 2033
- Table 17: Mexico Frozen Food Labels Revenue (billion) Forecast, by Application 2020 & 2033
- Table 18: Mexico Frozen Food Labels Volume (K) Forecast, by Application 2020 & 2033
- Table 19: Global Frozen Food Labels Revenue billion Forecast, by Application 2020 & 2033
- Table 20: Global Frozen Food Labels Volume K Forecast, by Application 2020 & 2033
- Table 21: Global Frozen Food Labels Revenue billion Forecast, by Types 2020 & 2033
- Table 22: Global Frozen Food Labels Volume K Forecast, by Types 2020 & 2033
- Table 23: Global Frozen Food Labels Revenue billion Forecast, by Country 2020 & 2033
- Table 24: Global Frozen Food Labels Volume K Forecast, by Country 2020 & 2033
- Table 25: Brazil Frozen Food Labels Revenue (billion) Forecast, by Application 2020 & 2033
- Table 26: Brazil Frozen Food Labels Volume (K) Forecast, by Application 2020 & 2033
- Table 27: Argentina Frozen Food Labels Revenue (billion) Forecast, by Application 2020 & 2033
- Table 28: Argentina Frozen Food Labels Volume (K) Forecast, by Application 2020 & 2033
- Table 29: Rest of South America Frozen Food Labels Revenue (billion) Forecast, by Application 2020 & 2033
- Table 30: Rest of South America Frozen Food Labels Volume (K) Forecast, by Application 2020 & 2033
- Table 31: Global Frozen Food Labels Revenue billion Forecast, by Application 2020 & 2033
- Table 32: Global Frozen Food Labels Volume K Forecast, by Application 2020 & 2033
- Table 33: Global Frozen Food Labels Revenue billion Forecast, by Types 2020 & 2033
- Table 34: Global Frozen Food Labels Volume K Forecast, by Types 2020 & 2033
- Table 35: Global Frozen Food Labels Revenue billion Forecast, by Country 2020 & 2033
- Table 36: Global Frozen Food Labels Volume K Forecast, by Country 2020 & 2033
- Table 37: United Kingdom Frozen Food Labels Revenue (billion) Forecast, by Application 2020 & 2033
- Table 38: United Kingdom Frozen Food Labels Volume (K) Forecast, by Application 2020 & 2033
- Table 39: Germany Frozen Food Labels Revenue (billion) Forecast, by Application 2020 & 2033
- Table 40: Germany Frozen Food Labels Volume (K) Forecast, by Application 2020 & 2033
- Table 41: France Frozen Food Labels Revenue (billion) Forecast, by Application 2020 & 2033
- Table 42: France Frozen Food Labels Volume (K) Forecast, by Application 2020 & 2033
- Table 43: Italy Frozen Food Labels Revenue (billion) Forecast, by Application 2020 & 2033
- Table 44: Italy Frozen Food Labels Volume (K) Forecast, by Application 2020 & 2033
- Table 45: Spain Frozen Food Labels Revenue (billion) Forecast, by Application 2020 & 2033
- Table 46: Spain Frozen Food Labels Volume (K) Forecast, by Application 2020 & 2033
- Table 47: Russia Frozen Food Labels Revenue (billion) Forecast, by Application 2020 & 2033
- Table 48: Russia Frozen Food Labels Volume (K) Forecast, by Application 2020 & 2033
- Table 49: Benelux Frozen Food Labels Revenue (billion) Forecast, by Application 2020 & 2033
- Table 50: Benelux Frozen Food Labels Volume (K) Forecast, by Application 2020 & 2033
- Table 51: Nordics Frozen Food Labels Revenue (billion) Forecast, by Application 2020 & 2033
- Table 52: Nordics Frozen Food Labels Volume (K) Forecast, by Application 2020 & 2033
- Table 53: Rest of Europe Frozen Food Labels Revenue (billion) Forecast, by Application 2020 & 2033
- Table 54: Rest of Europe Frozen Food Labels Volume (K) Forecast, by Application 2020 & 2033
- Table 55: Global Frozen Food Labels Revenue billion Forecast, by Application 2020 & 2033
- Table 56: Global Frozen Food Labels Volume K Forecast, by Application 2020 & 2033
- Table 57: Global Frozen Food Labels Revenue billion Forecast, by Types 2020 & 2033
- Table 58: Global Frozen Food Labels Volume K Forecast, by Types 2020 & 2033
- Table 59: Global Frozen Food Labels Revenue billion Forecast, by Country 2020 & 2033
- Table 60: Global Frozen Food Labels Volume K Forecast, by Country 2020 & 2033
- Table 61: Turkey Frozen Food Labels Revenue (billion) Forecast, by Application 2020 & 2033
- Table 62: Turkey Frozen Food Labels Volume (K) Forecast, by Application 2020 & 2033
- Table 63: Israel Frozen Food Labels Revenue (billion) Forecast, by Application 2020 & 2033
- Table 64: Israel Frozen Food Labels Volume (K) Forecast, by Application 2020 & 2033
- Table 65: GCC Frozen Food Labels Revenue (billion) Forecast, by Application 2020 & 2033
- Table 66: GCC Frozen Food Labels Volume (K) Forecast, by Application 2020 & 2033
- Table 67: North Africa Frozen Food Labels Revenue (billion) Forecast, by Application 2020 & 2033
- Table 68: North Africa Frozen Food Labels Volume (K) Forecast, by Application 2020 & 2033
- Table 69: South Africa Frozen Food Labels Revenue (billion) Forecast, by Application 2020 & 2033
- Table 70: South Africa Frozen Food Labels Volume (K) Forecast, by Application 2020 & 2033
- Table 71: Rest of Middle East & Africa Frozen Food Labels Revenue (billion) Forecast, by Application 2020 & 2033
- Table 72: Rest of Middle East & Africa Frozen Food Labels Volume (K) Forecast, by Application 2020 & 2033
- Table 73: Global Frozen Food Labels Revenue billion Forecast, by Application 2020 & 2033
- Table 74: Global Frozen Food Labels Volume K Forecast, by Application 2020 & 2033
- Table 75: Global Frozen Food Labels Revenue billion Forecast, by Types 2020 & 2033
- Table 76: Global Frozen Food Labels Volume K Forecast, by Types 2020 & 2033
- Table 77: Global Frozen Food Labels Revenue billion Forecast, by Country 2020 & 2033
- Table 78: Global Frozen Food Labels Volume K Forecast, by Country 2020 & 2033
- Table 79: China Frozen Food Labels Revenue (billion) Forecast, by Application 2020 & 2033
- Table 80: China Frozen Food Labels Volume (K) Forecast, by Application 2020 & 2033
- Table 81: India Frozen Food Labels Revenue (billion) Forecast, by Application 2020 & 2033
- Table 82: India Frozen Food Labels Volume (K) Forecast, by Application 2020 & 2033
- Table 83: Japan Frozen Food Labels Revenue (billion) Forecast, by Application 2020 & 2033
- Table 84: Japan Frozen Food Labels Volume (K) Forecast, by Application 2020 & 2033
- Table 85: South Korea Frozen Food Labels Revenue (billion) Forecast, by Application 2020 & 2033
- Table 86: South Korea Frozen Food Labels Volume (K) Forecast, by Application 2020 & 2033
- Table 87: ASEAN Frozen Food Labels Revenue (billion) Forecast, by Application 2020 & 2033
- Table 88: ASEAN Frozen Food Labels Volume (K) Forecast, by Application 2020 & 2033
- Table 89: Oceania Frozen Food Labels Revenue (billion) Forecast, by Application 2020 & 2033
- Table 90: Oceania Frozen Food Labels Volume (K) Forecast, by Application 2020 & 2033
- Table 91: Rest of Asia Pacific Frozen Food Labels Revenue (billion) Forecast, by Application 2020 & 2033
- Table 92: Rest of Asia Pacific Frozen Food Labels Volume (K) Forecast, by Application 2020 & 2033
Frequently Asked Questions
1. What is the projected Compound Annual Growth Rate (CAGR) of the Frozen Food Labels?
The projected CAGR is approximately 4.12%.
2. Which companies are prominent players in the Frozen Food Labels?
Key companies in the market include LLT Labels, Labelnet, Freezerlabels.net, AstroNova Product Identificatio, Alpine Packaging, Harfield Components, OnlineLabels, Dot It Nation, Cloud Labels, GA International, UPM Specialty Papers, Windmill Tapes&Labels.
3. What are the main segments of the Frozen Food Labels?
The market segments include Application, Types.
4. Can you provide details about the market size?
The market size is estimated to be USD 335.58 billion as of 2022.
5. What are some drivers contributing to market growth?
N/A
6. What are the notable trends driving market growth?
N/A
7. Are there any restraints impacting market growth?
N/A
8. Can you provide examples of recent developments in the market?
N/A
9. What pricing options are available for accessing the report?
Pricing options include single-user, multi-user, and enterprise licenses priced at USD 3350.00, USD 5025.00, and USD 6700.00 respectively.
10. Is the market size provided in terms of value or volume?
The market size is provided in terms of value, measured in billion and volume, measured in K.
11. Are there any specific market keywords associated with the report?
Yes, the market keyword associated with the report is "Frozen Food Labels," which aids in identifying and referencing the specific market segment covered.
12. How do I determine which pricing option suits my needs best?
The pricing options vary based on user requirements and access needs. Individual users may opt for single-user licenses, while businesses requiring broader access may choose multi-user or enterprise licenses for cost-effective access to the report.
13. Are there any additional resources or data provided in the Frozen Food Labels report?
While the report offers comprehensive insights, it's advisable to review the specific contents or supplementary materials provided to ascertain if additional resources or data are available.
14. How can I stay updated on further developments or reports in the Frozen Food Labels?
To stay informed about further developments, trends, and reports in the Frozen Food Labels, consider subscribing to industry newsletters, following relevant companies and organizations, or regularly checking reputable industry news sources and publications.
Methodology
Step 1 - Identification of Relevant Samples Size from Population Database


Step 2 - Approaches for Defining Global Market Size (Value, Volume* & Price*)

Note*: In applicable scenarios
Step 3 - Data Sources
Primary Research
- Web Analytics
- Survey Reports
- Research Institute
- Latest Research Reports
- Opinion Leaders
Secondary Research
- Annual Reports
- White Paper
- Latest Press Release
- Industry Association
- Paid Database
- Investor Presentations

Step 4 - Data Triangulation
Involves using different sources of information in order to increase the validity of a study
These sources are likely to be stakeholders in a program - participants, other researchers, program staff, other community members, and so on.
Then we put all data in single framework & apply various statistical tools to find out the dynamic on the market.
During the analysis stage, feedback from the stakeholder groups would be compared to determine areas of agreement as well as areas of divergence