

Key Insights
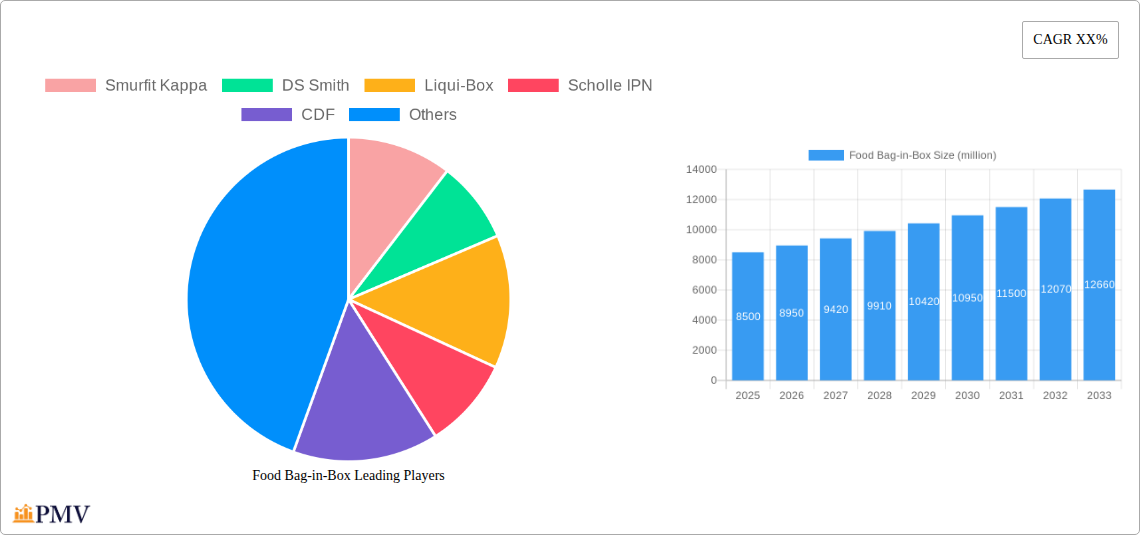
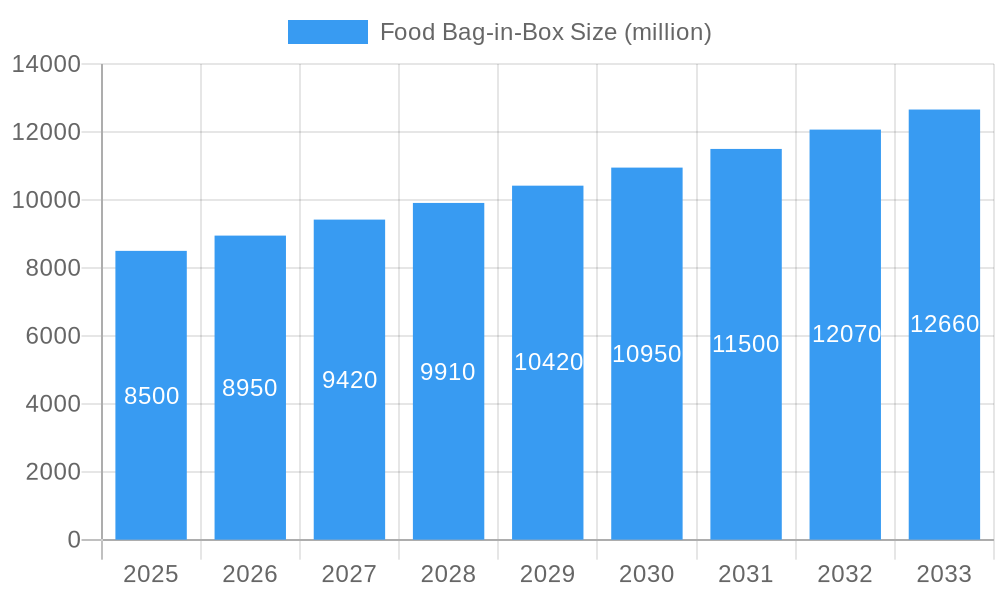
The global Food Bag-in-Box market is poised for substantial growth, estimated to reach approximately $8.5 billion by 2025. This expansion is driven by a projected Compound Annual Growth Rate (CAGR) of around 5.8% over the forecast period of 2025-2033. The value unit is in millions, indicating a significant market value. Key drivers fueling this growth include the increasing demand for convenient, sustainable, and cost-effective packaging solutions across various food applications. The bag-in-box format offers superior product protection, extended shelf life, and reduced waste compared to traditional packaging, making it highly attractive to both manufacturers and consumers. Emerging economies, particularly in the Asia Pacific region, are expected to be significant contributors to market expansion due to rising disposable incomes and a growing preference for packaged food products. The versatility of bag-in-box packaging across diverse applications like dairy products, sauces, vinegar, and liquid egg products further solidifies its market position.
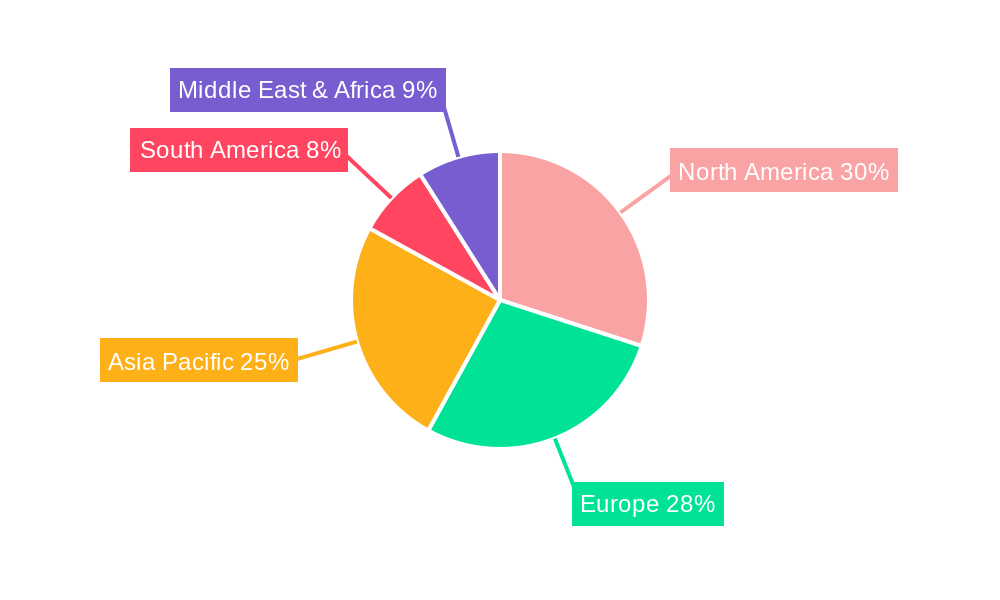
Food Bag-in-Box Market Size (In Billion)
Further analysis of the market reveals distinct trends and restraints that will shape its trajectory. The growing consumer awareness regarding environmental sustainability is a major trend, favoring the recyclability and reduced carbon footprint associated with bag-in-box packaging. Innovations in bag-in-box technology, such as improved barrier films and dispensing systems, are enhancing product integrity and user experience. The market is segmented by volume, with "Less than 5 liters" and "5 to 10 liters" likely dominating due to their suitability for household consumption and smaller commercial uses. However, the market faces restraints such as initial investment costs for filling machinery and the need for consumer education regarding the benefits of this packaging format. Geographically, North America and Europe currently lead in market share, owing to established adoption rates and strong regulatory support for sustainable packaging. The Asia Pacific region is anticipated to witness the fastest growth, driven by rapid industrialization and evolving consumer preferences. Key players are focusing on strategic collaborations and product development to capture market share and address evolving consumer and industry demands.
Food Bag-in-Box Company Market Share
This in-depth market research report provides a granular analysis of the global Food Bag-in-Box market, encompassing a detailed exploration of its structure, competitive landscape, emerging trends, and future outlook. Covering the historical period from 2019 to 2024, with a base year of 2025 and a forecast extending to 2033, this report is an indispensable resource for industry stakeholders seeking strategic insights and actionable intelligence. We delve into market dynamics, segmentation, key growth drivers, challenges, and product innovations, offering a robust understanding of this rapidly evolving sector.
Food Bag-in-Box Market Structure & Competitive Dynamics
The global Food Bag-in-Box market exhibits a moderately concentrated structure, with several key players holding significant market share. Dominant companies like Smurfit Kappa, DS Smith, and Liqui-Box lead innovation and market penetration through strategic investments in advanced packaging technologies and sustainable solutions. The innovation ecosystem is driven by a continuous pursuit of enhanced barrier properties, improved dispensing mechanisms, and reduced environmental impact. Regulatory frameworks, particularly those pertaining to food safety and sustainability standards, play a crucial role in shaping market entry and product development. Product substitutes, such as rigid containers and other flexible packaging formats, present a competitive challenge, although the bag-in-box solution's inherent advantages in terms of shelf-life extension, reduced waste, and cost-effectiveness continue to drive adoption. End-user trends are increasingly favoring convenience, portion control, and sustainable packaging options, directly influencing the demand for bag-in-box solutions across various food applications. Mergers and acquisitions (M&A) activities are a notable feature, with deal values in the hundreds of millions of dollars, aimed at consolidating market presence, expanding product portfolios, and acquiring innovative technologies. For instance, Liqui-Box's acquisition of DS Smith’s flexible packaging business underscored the consolidation trend, bolstering its global footprint and technological capabilities. The market share of the top five players is estimated to be over 60% in 2025.
Food Bag-in-Box Industry Trends & Insights
The Food Bag-in-Box industry is poised for robust growth, fueled by several interconnected trends and insights. A primary growth driver is the escalating demand for extended shelf-life solutions for perishable food items, particularly in the dairy, sauces, and liquid egg product segments. This is directly linked to reducing food waste and improving supply chain efficiency, a growing concern for both consumers and businesses. Technological disruptions are at the forefront, with advancements in film extrusion, barrier coatings, and dispensing tap technology enhancing product performance and consumer experience. Innovations focus on lighter-weight materials, improved puncture resistance, and more user-friendly dispensing systems, contributing to a projected Compound Annual Growth Rate (CAGR) of approximately 7.5% for the forecast period. Consumer preferences are increasingly aligning with the sustainability narrative of bag-in-box packaging. Its lightweight nature, reduced material usage compared to rigid alternatives, and the potential for high-recycled content in outer packaging resonate with environmentally conscious consumers. Furthermore, the convenience factor of bag-in-box, especially for larger format products and foodservice applications, continues to drive market penetration, which is expected to reach over 35% in major developed markets by 2033. Competitive dynamics are intensifying, with companies differentiating themselves through product innovation, sustainable offerings, and strategic partnerships. The rise of e-commerce and direct-to-consumer models also presents opportunities for bag-in-box solutions due to their efficient shipping and storage characteristics. The growing adoption in emerging economies, driven by increasing disposable incomes and a demand for more convenient and safe food packaging, further propels the industry forward. The market size is projected to exceed $35,000 million by 2033.
Dominant Markets & Segments in Food Bag-in-Box
The global Food Bag-in-Box market is characterized by the dominance of specific regions and application segments, driven by a confluence of economic, regulatory, and consumer-driven factors.
Leading Region:
North America and Europe currently dominate the Food Bag-in-Box market, accounting for an estimated 70% of the global market share in 2025.
- Economic Policies: Favorable economic conditions, high disposable incomes, and well-established food processing industries in these regions support substantial demand for innovative packaging solutions. Government initiatives promoting food safety and waste reduction further bolster the adoption of bag-in-box systems.
- Infrastructure: Robust cold chain logistics and efficient distribution networks ensure the integrity of sensitive food products packaged in bag-in-box formats, facilitating wider market penetration.
- Consumer Preferences: A strong consumer preference for convenience, extended shelf-life, and sustainable packaging solutions drives the demand for bag-in-box in both household and foodservice sectors.
Dominant Application Segments:
- Dairy Products: This segment is a significant contributor to the market, with bag-in-box solutions effectively preserving milk, yogurt drinks, and other dairy-based beverages. The ability to maintain product freshness and reduce spoilage is a key driver. The market size for dairy products is estimated to be over $8,000 million in 2025.
- Sauces: Bag-in-box packaging is ideal for a wide range of sauces, including ketchup, mayonnaise, cooking sauces, and dressings. The dispensing tap allows for controlled portioning and reduced contamination, making it a preferred choice for both retail and foodservice. The sauces segment is expected to reach over $10,000 million by 2033.
- Vinegar & Flavoring: The chemical stability and long shelf-life of vinegar and flavoring agents make them well-suited for bag-in-box packaging, offering cost-effectiveness and ease of use for bulk applications.
- Liquid Egg Products: Bag-in-box plays a crucial role in maintaining the hygiene and freshness of liquid egg products, essential for the baking and food processing industries. Its contribution to food safety is paramount.
- Others: This broad category includes edible oils, wines, concentrates, and liquid sweeteners, all of which benefit from the protective and convenient nature of bag-in-box solutions.
Dominant Type Segments:
- 5 to 10 Liters: This size range is particularly dominant in foodservice and for larger households, offering a balance of convenience and value. The market for this segment is estimated at over $7,000 million in 2025.
- More than 20 Liters: These larger formats are prevalent in industrial kitchens, catering, and bulk food processing, where efficiency and reduced packaging waste are critical.
- 10 to 15 Liters: This segment also sees considerable traction, bridging the gap between smaller and larger bulk formats, serving diverse institutional needs.
The market share of the "More than 20 liters" segment is projected to grow at a CAGR of 8.2% due to increasing demand in foodservice and industrial applications. The "Less than 5 liters" segment is driven by consumer convenience and single-serve options, with a CAGR of 6.8%.
Food Bag-in-Box Product Innovations
Product innovations in the Food Bag-in-Box sector are primarily focused on enhancing sustainability, improving barrier properties, and optimizing dispensing. Developments include the introduction of multilayer films with advanced oxygen and moisture barriers, extending product shelf-life significantly and reducing the need for preservatives. New tap designs offer improved tamper-evidence, reduced drip, and easier portion control, enhancing user convenience. Furthermore, research into bio-based and recycled content for both the inner bag and outer box is gaining momentum, aligning with increasing environmental consciousness and regulatory pressures. These innovations provide competitive advantages by offering superior product protection, reduced material usage, and a more appealing, eco-friendly packaging solution.
Report Segmentation & Scope
This report segments the global Food Bag-in-Box market by Application and Type, providing detailed insights into each sub-segment.
- Application: The market is analyzed across Dairy Products, Sauces, Vinegar & Flavoring, Liquid Egg Products, and Others. Each application segment is assessed for its market size, growth projections, and the specific drivers influencing its adoption of bag-in-box solutions. The dairy segment is projected to grow at a CAGR of 7.2%, while the sauces segment is expected to see a CAGR of 7.8% through 2033.
- Type: The report further categorizes the market by volume, including Less than 5 liters, 5 to 10 liters, 10 to 15 liters, 15 to 20 liters, and More than 20 liters. Growth projections and competitive dynamics within each type segment are detailed, highlighting the demand for various pack sizes across different end-user industries. The "More than 20 liters" segment is projected to exhibit the highest growth rate, driven by bulk food service needs.
Key Drivers of Food Bag-in-Box Growth
Several key factors are driving the expansion of the Food Bag-in-Box market. Technologically, advancements in barrier films and dispensing systems are enhancing product protection and usability. Economically, the demand for cost-effective and efficient packaging solutions, coupled with growing disposable incomes in emerging markets, is propelling adoption. Regulatory drivers, such as stricter food safety standards and a global push towards sustainable packaging, favor the inherent benefits of bag-in-box. For example, the reduced carbon footprint associated with lighter-weight bag-in-box compared to rigid alternatives makes it an attractive option for companies seeking to meet sustainability targets. The convenience offered by easy-to-dispense formats also aligns with evolving consumer lifestyles.
Challenges in the Food Bag-in-Box Sector
Despite significant growth, the Food Bag-in-Box sector faces several challenges. Regulatory hurdles related to food contact materials and end-of-life disposal can vary across regions, creating complexities for global manufacturers. Supply chain disruptions, such as raw material price volatility and logistical bottlenecks, can impact production costs and delivery timelines. Competitive pressures from alternative packaging solutions, including advanced flexible pouches and recyclable rigid containers, necessitate continuous innovation and cost optimization. Furthermore, ensuring adequate infrastructure for recycling and waste management of bag-in-box components in all markets remains a critical challenge. The cost of initial investment in specialized filling machinery can also be a barrier for smaller players.
Leading Players in the Food Bag-in-Box Market
- Smurfit Kappa
- DS Smith
- Liqui-Box
- Scholle IPN
- CDF
- Aran Group
- Fujimori Kogyo
- Goglio
- Amcor
- Vine Valley Ventures
- Parish Manufacturing
- TPS Rental Systems
- Optopack
- Accurate Box
- CENTRAL PACKAGE & DISPLAY
- Arlington Packaging (Rental)
- BiBP SP. z O.O
- Hangzhou Hansin New Packing
Key Developments in Food Bag-in-Box Sector
- 2023: Liqui-Box acquires Schur Flexibles' barrier film business, enhancing its upstream integration and material science capabilities.
- 2023: Smurfit Kappa launches a new range of high-barrier films for bag-in-box applications, improving product preservation for sensitive foods.
- 2022: DS Smith invests in new bag-in-box filling lines to expand its capacity and meet growing demand in the European market.
- 2022: Scholle IPN announces significant advancements in their aseptic bag-in-box solutions, catering to the extended shelf-life requirements of liquid foods.
- 2021: Fujimori Kogyo introduces a novel, more sustainable inner bag material for bag-in-box, aiming to reduce its environmental footprint.
- 2021: Goglio partners with a major beverage producer to develop customized bag-in-box solutions for aseptic juice distribution.
- 2020: Amcor expands its global manufacturing footprint for bag-in-box packaging, strategically positioning itself to serve key markets more efficiently.
Strategic Food Bag-in-Box Market Outlook
The strategic outlook for the Food Bag-in-Box market is exceptionally positive, driven by a sustained demand for efficient, safe, and sustainable packaging. Growth accelerators include the increasing adoption of bag-in-box in emerging economies, where it addresses the need for improved food safety and extended shelf-life in developing supply chains. The ongoing innovation in materials science and dispensing technology will continue to enhance product performance and appeal. Strategic opportunities lie in expanding into new food categories, such as plant-based alternatives and ready-to-eat meals, and in developing advanced recycling solutions to address end-of-life concerns. The market's inherent ability to reduce waste and carbon emissions positions it favorably to capitalize on evolving consumer and regulatory landscapes, ensuring its continued growth and strategic importance.
Food Bag-in-Box Segmentation
-
1. Application
- 1.1. Dairy Products
- 1.2. Sauces, Vinegar & Flavoring
- 1.3. Liquid Egg Products
- 1.4. Others
-
2. Types
- 2.1. Less than 5 liters
- 2.2. 5 to 10 liters
- 2.3. 10 to 15 liters
- 2.4. 15 to 20 liters
- 2.5. More than 20 liters
Food Bag-in-Box Segmentation By Geography
-
1. North America
- 1.1. United States
- 1.2. Canada
- 1.3. Mexico
-
2. South America
- 2.1. Brazil
- 2.2. Argentina
- 2.3. Rest of South America
-
3. Europe
- 3.1. United Kingdom
- 3.2. Germany
- 3.3. France
- 3.4. Italy
- 3.5. Spain
- 3.6. Russia
- 3.7. Benelux
- 3.8. Nordics
- 3.9. Rest of Europe
-
4. Middle East & Africa
- 4.1. Turkey
- 4.2. Israel
- 4.3. GCC
- 4.4. North Africa
- 4.5. South Africa
- 4.6. Rest of Middle East & Africa
-
5. Asia Pacific
- 5.1. China
- 5.2. India
- 5.3. Japan
- 5.4. South Korea
- 5.5. ASEAN
- 5.6. Oceania
- 5.7. Rest of Asia Pacific
Food Bag-in-Box Regional Market Share
Geographic Coverage of Food Bag-in-Box
Food Bag-in-Box REPORT HIGHLIGHTS
| Aspects | Details |
|---|---|
| Study Period | 2020-2034 |
| Base Year | 2025 |
| Estimated Year | 2026 |
| Forecast Period | 2026-2034 |
| Historical Period | 2020-2025 |
| Growth Rate | CAGR of 6.5% from 2020-2034 |
| Segmentation |
|
Table of Contents
- 1. Introduction
- 1.1. Research Scope
- 1.2. Market Segmentation
- 1.3. Research Objective
- 1.4. Definitions and Assumptions
- 2. Executive Summary
- 2.1. Market Snapshot
- 3. Market Dynamics
- 3.1. Market Drivers
- 3.2. Market Restrains
- 3.3. Market Trends
- 3.4. Market Opportunities
- 4. Market Factor Analysis
- 4.1. Porters Five Forces
- 4.1.1. Bargaining Power of Suppliers
- 4.1.2. Bargaining Power of Buyers
- 4.1.3. Threat of New Entrants
- 4.1.4. Threat of Substitutes
- 4.1.5. Competitive Rivalry
- 4.2. PESTEL analysis
- 4.3. BCG Analysis
- 4.3.1. Stars (High Growth, High Market Share)
- 4.3.2. Cash Cows (Low Growth, High Market Share)
- 4.3.3. Question Mark (High Growth, Low Market Share)
- 4.3.4. Dogs (Low Growth, Low Market Share)
- 4.4. Ansoff Matrix Analysis
- 4.5. Supply Chain Analysis
- 4.6. Regulatory Landscape
- 4.7. Current Market Potential and Opportunity Assessment (TAM–SAM–SOM Framework)
- 4.8. PMV Analyst Note
- 4.1. Porters Five Forces
- 5. Market Analysis, Insights and Forecast 2021-2033
- 5.1. Market Analysis, Insights and Forecast - by Application
- 5.1.1. Dairy Products
- 5.1.2. Sauces, Vinegar & Flavoring
- 5.1.3. Liquid Egg Products
- 5.1.4. Others
- 5.2. Market Analysis, Insights and Forecast - by Types
- 5.2.1. Less than 5 liters
- 5.2.2. 5 to 10 liters
- 5.2.3. 10 to 15 liters
- 5.2.4. 15 to 20 liters
- 5.2.5. More than 20 liters
- 5.3. Market Analysis, Insights and Forecast - by Region
- 5.3.1. North America
- 5.3.2. South America
- 5.3.3. Europe
- 5.3.4. Middle East & Africa
- 5.3.5. Asia Pacific
- 5.1. Market Analysis, Insights and Forecast - by Application
- 6. Global Food Bag-in-Box Analysis, Insights and Forecast, 2021-2033
- 6.1. Market Analysis, Insights and Forecast - by Application
- 6.1.1. Dairy Products
- 6.1.2. Sauces, Vinegar & Flavoring
- 6.1.3. Liquid Egg Products
- 6.1.4. Others
- 6.2. Market Analysis, Insights and Forecast - by Types
- 6.2.1. Less than 5 liters
- 6.2.2. 5 to 10 liters
- 6.2.3. 10 to 15 liters
- 6.2.4. 15 to 20 liters
- 6.2.5. More than 20 liters
- 6.1. Market Analysis, Insights and Forecast - by Application
- 7. North America Food Bag-in-Box Analysis, Insights and Forecast, 2020-2032
- 7.1. Market Analysis, Insights and Forecast - by Application
- 7.1.1. Dairy Products
- 7.1.2. Sauces, Vinegar & Flavoring
- 7.1.3. Liquid Egg Products
- 7.1.4. Others
- 7.2. Market Analysis, Insights and Forecast - by Types
- 7.2.1. Less than 5 liters
- 7.2.2. 5 to 10 liters
- 7.2.3. 10 to 15 liters
- 7.2.4. 15 to 20 liters
- 7.2.5. More than 20 liters
- 7.1. Market Analysis, Insights and Forecast - by Application
- 8. South America Food Bag-in-Box Analysis, Insights and Forecast, 2020-2032
- 8.1. Market Analysis, Insights and Forecast - by Application
- 8.1.1. Dairy Products
- 8.1.2. Sauces, Vinegar & Flavoring
- 8.1.3. Liquid Egg Products
- 8.1.4. Others
- 8.2. Market Analysis, Insights and Forecast - by Types
- 8.2.1. Less than 5 liters
- 8.2.2. 5 to 10 liters
- 8.2.3. 10 to 15 liters
- 8.2.4. 15 to 20 liters
- 8.2.5. More than 20 liters
- 8.1. Market Analysis, Insights and Forecast - by Application
- 9. Europe Food Bag-in-Box Analysis, Insights and Forecast, 2020-2032
- 9.1. Market Analysis, Insights and Forecast - by Application
- 9.1.1. Dairy Products
- 9.1.2. Sauces, Vinegar & Flavoring
- 9.1.3. Liquid Egg Products
- 9.1.4. Others
- 9.2. Market Analysis, Insights and Forecast - by Types
- 9.2.1. Less than 5 liters
- 9.2.2. 5 to 10 liters
- 9.2.3. 10 to 15 liters
- 9.2.4. 15 to 20 liters
- 9.2.5. More than 20 liters
- 9.1. Market Analysis, Insights and Forecast - by Application
- 10. Middle East & Africa Food Bag-in-Box Analysis, Insights and Forecast, 2020-2032
- 10.1. Market Analysis, Insights and Forecast - by Application
- 10.1.1. Dairy Products
- 10.1.2. Sauces, Vinegar & Flavoring
- 10.1.3. Liquid Egg Products
- 10.1.4. Others
- 10.2. Market Analysis, Insights and Forecast - by Types
- 10.2.1. Less than 5 liters
- 10.2.2. 5 to 10 liters
- 10.2.3. 10 to 15 liters
- 10.2.4. 15 to 20 liters
- 10.2.5. More than 20 liters
- 10.1. Market Analysis, Insights and Forecast - by Application
- 11. Asia Pacific Food Bag-in-Box Analysis, Insights and Forecast, 2020-2032
- 11.1. Market Analysis, Insights and Forecast - by Application
- 11.1.1. Dairy Products
- 11.1.2. Sauces, Vinegar & Flavoring
- 11.1.3. Liquid Egg Products
- 11.1.4. Others
- 11.2. Market Analysis, Insights and Forecast - by Types
- 11.2.1. Less than 5 liters
- 11.2.2. 5 to 10 liters
- 11.2.3. 10 to 15 liters
- 11.2.4. 15 to 20 liters
- 11.2.5. More than 20 liters
- 11.1. Market Analysis, Insights and Forecast - by Application
- 12. Competitive Analysis
- 12.1. Company Profiles
- 12.1.1 Smurfit Kappa
- 12.1.1.1. Company Overview
- 12.1.1.2. Products
- 12.1.1.3. Company Financials
- 12.1.1.4. SWOT Analysis
- 12.1.2 DS Smith
- 12.1.2.1. Company Overview
- 12.1.2.2. Products
- 12.1.2.3. Company Financials
- 12.1.2.4. SWOT Analysis
- 12.1.3 Liqui-Box
- 12.1.3.1. Company Overview
- 12.1.3.2. Products
- 12.1.3.3. Company Financials
- 12.1.3.4. SWOT Analysis
- 12.1.4 Scholle IPN
- 12.1.4.1. Company Overview
- 12.1.4.2. Products
- 12.1.4.3. Company Financials
- 12.1.4.4. SWOT Analysis
- 12.1.5 CDF
- 12.1.5.1. Company Overview
- 12.1.5.2. Products
- 12.1.5.3. Company Financials
- 12.1.5.4. SWOT Analysis
- 12.1.6 Aran Group
- 12.1.6.1. Company Overview
- 12.1.6.2. Products
- 12.1.6.3. Company Financials
- 12.1.6.4. SWOT Analysis
- 12.1.7 Fujimori Kogyo
- 12.1.7.1. Company Overview
- 12.1.7.2. Products
- 12.1.7.3. Company Financials
- 12.1.7.4. SWOT Analysis
- 12.1.8 Goglio
- 12.1.8.1. Company Overview
- 12.1.8.2. Products
- 12.1.8.3. Company Financials
- 12.1.8.4. SWOT Analysis
- 12.1.9 Amcor
- 12.1.9.1. Company Overview
- 12.1.9.2. Products
- 12.1.9.3. Company Financials
- 12.1.9.4. SWOT Analysis
- 12.1.10 Vine Valley Ventures
- 12.1.10.1. Company Overview
- 12.1.10.2. Products
- 12.1.10.3. Company Financials
- 12.1.10.4. SWOT Analysis
- 12.1.11 Parish Manufacturing
- 12.1.11.1. Company Overview
- 12.1.11.2. Products
- 12.1.11.3. Company Financials
- 12.1.11.4. SWOT Analysis
- 12.1.12 TPS Rental Systems
- 12.1.12.1. Company Overview
- 12.1.12.2. Products
- 12.1.12.3. Company Financials
- 12.1.12.4. SWOT Analysis
- 12.1.13 Optopack
- 12.1.13.1. Company Overview
- 12.1.13.2. Products
- 12.1.13.3. Company Financials
- 12.1.13.4. SWOT Analysis
- 12.1.14 Accurate Box
- 12.1.14.1. Company Overview
- 12.1.14.2. Products
- 12.1.14.3. Company Financials
- 12.1.14.4. SWOT Analysis
- 12.1.15 CENTRAL PACKAGE & DISPLAY
- 12.1.15.1. Company Overview
- 12.1.15.2. Products
- 12.1.15.3. Company Financials
- 12.1.15.4. SWOT Analysis
- 12.1.16 Arlington Packaging (Rental)
- 12.1.16.1. Company Overview
- 12.1.16.2. Products
- 12.1.16.3. Company Financials
- 12.1.16.4. SWOT Analysis
- 12.1.17 BiBP SP. z O.O
- 12.1.17.1. Company Overview
- 12.1.17.2. Products
- 12.1.17.3. Company Financials
- 12.1.17.4. SWOT Analysis
- 12.1.18 Hangzhou Hansin New Packing
- 12.1.18.1. Company Overview
- 12.1.18.2. Products
- 12.1.18.3. Company Financials
- 12.1.18.4. SWOT Analysis
- 12.1.1 Smurfit Kappa
- 12.2. Market Entropy
- 12.2.1 Company's Key Areas Served
- 12.2.2 Recent Developments
- 12.3. Company Market Share Analysis 2025
- 12.3.1 Top 5 Companies Market Share Analysis
- 12.3.2 Top 3 Companies Market Share Analysis
- 12.4. List of Potential Customers
- 13. Research Methodology
List of Figures
- Figure 1: Global Food Bag-in-Box Revenue Breakdown (undefined, %) by Region 2025 & 2033
- Figure 2: Global Food Bag-in-Box Volume Breakdown (K, %) by Region 2025 & 2033
- Figure 3: North America Food Bag-in-Box Revenue (undefined), by Application 2025 & 2033
- Figure 4: North America Food Bag-in-Box Volume (K), by Application 2025 & 2033
- Figure 5: North America Food Bag-in-Box Revenue Share (%), by Application 2025 & 2033
- Figure 6: North America Food Bag-in-Box Volume Share (%), by Application 2025 & 2033
- Figure 7: North America Food Bag-in-Box Revenue (undefined), by Types 2025 & 2033
- Figure 8: North America Food Bag-in-Box Volume (K), by Types 2025 & 2033
- Figure 9: North America Food Bag-in-Box Revenue Share (%), by Types 2025 & 2033
- Figure 10: North America Food Bag-in-Box Volume Share (%), by Types 2025 & 2033
- Figure 11: North America Food Bag-in-Box Revenue (undefined), by Country 2025 & 2033
- Figure 12: North America Food Bag-in-Box Volume (K), by Country 2025 & 2033
- Figure 13: North America Food Bag-in-Box Revenue Share (%), by Country 2025 & 2033
- Figure 14: North America Food Bag-in-Box Volume Share (%), by Country 2025 & 2033
- Figure 15: South America Food Bag-in-Box Revenue (undefined), by Application 2025 & 2033
- Figure 16: South America Food Bag-in-Box Volume (K), by Application 2025 & 2033
- Figure 17: South America Food Bag-in-Box Revenue Share (%), by Application 2025 & 2033
- Figure 18: South America Food Bag-in-Box Volume Share (%), by Application 2025 & 2033
- Figure 19: South America Food Bag-in-Box Revenue (undefined), by Types 2025 & 2033
- Figure 20: South America Food Bag-in-Box Volume (K), by Types 2025 & 2033
- Figure 21: South America Food Bag-in-Box Revenue Share (%), by Types 2025 & 2033
- Figure 22: South America Food Bag-in-Box Volume Share (%), by Types 2025 & 2033
- Figure 23: South America Food Bag-in-Box Revenue (undefined), by Country 2025 & 2033
- Figure 24: South America Food Bag-in-Box Volume (K), by Country 2025 & 2033
- Figure 25: South America Food Bag-in-Box Revenue Share (%), by Country 2025 & 2033
- Figure 26: South America Food Bag-in-Box Volume Share (%), by Country 2025 & 2033
- Figure 27: Europe Food Bag-in-Box Revenue (undefined), by Application 2025 & 2033
- Figure 28: Europe Food Bag-in-Box Volume (K), by Application 2025 & 2033
- Figure 29: Europe Food Bag-in-Box Revenue Share (%), by Application 2025 & 2033
- Figure 30: Europe Food Bag-in-Box Volume Share (%), by Application 2025 & 2033
- Figure 31: Europe Food Bag-in-Box Revenue (undefined), by Types 2025 & 2033
- Figure 32: Europe Food Bag-in-Box Volume (K), by Types 2025 & 2033
- Figure 33: Europe Food Bag-in-Box Revenue Share (%), by Types 2025 & 2033
- Figure 34: Europe Food Bag-in-Box Volume Share (%), by Types 2025 & 2033
- Figure 35: Europe Food Bag-in-Box Revenue (undefined), by Country 2025 & 2033
- Figure 36: Europe Food Bag-in-Box Volume (K), by Country 2025 & 2033
- Figure 37: Europe Food Bag-in-Box Revenue Share (%), by Country 2025 & 2033
- Figure 38: Europe Food Bag-in-Box Volume Share (%), by Country 2025 & 2033
- Figure 39: Middle East & Africa Food Bag-in-Box Revenue (undefined), by Application 2025 & 2033
- Figure 40: Middle East & Africa Food Bag-in-Box Volume (K), by Application 2025 & 2033
- Figure 41: Middle East & Africa Food Bag-in-Box Revenue Share (%), by Application 2025 & 2033
- Figure 42: Middle East & Africa Food Bag-in-Box Volume Share (%), by Application 2025 & 2033
- Figure 43: Middle East & Africa Food Bag-in-Box Revenue (undefined), by Types 2025 & 2033
- Figure 44: Middle East & Africa Food Bag-in-Box Volume (K), by Types 2025 & 2033
- Figure 45: Middle East & Africa Food Bag-in-Box Revenue Share (%), by Types 2025 & 2033
- Figure 46: Middle East & Africa Food Bag-in-Box Volume Share (%), by Types 2025 & 2033
- Figure 47: Middle East & Africa Food Bag-in-Box Revenue (undefined), by Country 2025 & 2033
- Figure 48: Middle East & Africa Food Bag-in-Box Volume (K), by Country 2025 & 2033
- Figure 49: Middle East & Africa Food Bag-in-Box Revenue Share (%), by Country 2025 & 2033
- Figure 50: Middle East & Africa Food Bag-in-Box Volume Share (%), by Country 2025 & 2033
- Figure 51: Asia Pacific Food Bag-in-Box Revenue (undefined), by Application 2025 & 2033
- Figure 52: Asia Pacific Food Bag-in-Box Volume (K), by Application 2025 & 2033
- Figure 53: Asia Pacific Food Bag-in-Box Revenue Share (%), by Application 2025 & 2033
- Figure 54: Asia Pacific Food Bag-in-Box Volume Share (%), by Application 2025 & 2033
- Figure 55: Asia Pacific Food Bag-in-Box Revenue (undefined), by Types 2025 & 2033
- Figure 56: Asia Pacific Food Bag-in-Box Volume (K), by Types 2025 & 2033
- Figure 57: Asia Pacific Food Bag-in-Box Revenue Share (%), by Types 2025 & 2033
- Figure 58: Asia Pacific Food Bag-in-Box Volume Share (%), by Types 2025 & 2033
- Figure 59: Asia Pacific Food Bag-in-Box Revenue (undefined), by Country 2025 & 2033
- Figure 60: Asia Pacific Food Bag-in-Box Volume (K), by Country 2025 & 2033
- Figure 61: Asia Pacific Food Bag-in-Box Revenue Share (%), by Country 2025 & 2033
- Figure 62: Asia Pacific Food Bag-in-Box Volume Share (%), by Country 2025 & 2033
List of Tables
- Table 1: Global Food Bag-in-Box Revenue undefined Forecast, by Application 2020 & 2033
- Table 2: Global Food Bag-in-Box Volume K Forecast, by Application 2020 & 2033
- Table 3: Global Food Bag-in-Box Revenue undefined Forecast, by Types 2020 & 2033
- Table 4: Global Food Bag-in-Box Volume K Forecast, by Types 2020 & 2033
- Table 5: Global Food Bag-in-Box Revenue undefined Forecast, by Region 2020 & 2033
- Table 6: Global Food Bag-in-Box Volume K Forecast, by Region 2020 & 2033
- Table 7: Global Food Bag-in-Box Revenue undefined Forecast, by Application 2020 & 2033
- Table 8: Global Food Bag-in-Box Volume K Forecast, by Application 2020 & 2033
- Table 9: Global Food Bag-in-Box Revenue undefined Forecast, by Types 2020 & 2033
- Table 10: Global Food Bag-in-Box Volume K Forecast, by Types 2020 & 2033
- Table 11: Global Food Bag-in-Box Revenue undefined Forecast, by Country 2020 & 2033
- Table 12: Global Food Bag-in-Box Volume K Forecast, by Country 2020 & 2033
- Table 13: United States Food Bag-in-Box Revenue (undefined) Forecast, by Application 2020 & 2033
- Table 14: United States Food Bag-in-Box Volume (K) Forecast, by Application 2020 & 2033
- Table 15: Canada Food Bag-in-Box Revenue (undefined) Forecast, by Application 2020 & 2033
- Table 16: Canada Food Bag-in-Box Volume (K) Forecast, by Application 2020 & 2033
- Table 17: Mexico Food Bag-in-Box Revenue (undefined) Forecast, by Application 2020 & 2033
- Table 18: Mexico Food Bag-in-Box Volume (K) Forecast, by Application 2020 & 2033
- Table 19: Global Food Bag-in-Box Revenue undefined Forecast, by Application 2020 & 2033
- Table 20: Global Food Bag-in-Box Volume K Forecast, by Application 2020 & 2033
- Table 21: Global Food Bag-in-Box Revenue undefined Forecast, by Types 2020 & 2033
- Table 22: Global Food Bag-in-Box Volume K Forecast, by Types 2020 & 2033
- Table 23: Global Food Bag-in-Box Revenue undefined Forecast, by Country 2020 & 2033
- Table 24: Global Food Bag-in-Box Volume K Forecast, by Country 2020 & 2033
- Table 25: Brazil Food Bag-in-Box Revenue (undefined) Forecast, by Application 2020 & 2033
- Table 26: Brazil Food Bag-in-Box Volume (K) Forecast, by Application 2020 & 2033
- Table 27: Argentina Food Bag-in-Box Revenue (undefined) Forecast, by Application 2020 & 2033
- Table 28: Argentina Food Bag-in-Box Volume (K) Forecast, by Application 2020 & 2033
- Table 29: Rest of South America Food Bag-in-Box Revenue (undefined) Forecast, by Application 2020 & 2033
- Table 30: Rest of South America Food Bag-in-Box Volume (K) Forecast, by Application 2020 & 2033
- Table 31: Global Food Bag-in-Box Revenue undefined Forecast, by Application 2020 & 2033
- Table 32: Global Food Bag-in-Box Volume K Forecast, by Application 2020 & 2033
- Table 33: Global Food Bag-in-Box Revenue undefined Forecast, by Types 2020 & 2033
- Table 34: Global Food Bag-in-Box Volume K Forecast, by Types 2020 & 2033
- Table 35: Global Food Bag-in-Box Revenue undefined Forecast, by Country 2020 & 2033
- Table 36: Global Food Bag-in-Box Volume K Forecast, by Country 2020 & 2033
- Table 37: United Kingdom Food Bag-in-Box Revenue (undefined) Forecast, by Application 2020 & 2033
- Table 38: United Kingdom Food Bag-in-Box Volume (K) Forecast, by Application 2020 & 2033
- Table 39: Germany Food Bag-in-Box Revenue (undefined) Forecast, by Application 2020 & 2033
- Table 40: Germany Food Bag-in-Box Volume (K) Forecast, by Application 2020 & 2033
- Table 41: France Food Bag-in-Box Revenue (undefined) Forecast, by Application 2020 & 2033
- Table 42: France Food Bag-in-Box Volume (K) Forecast, by Application 2020 & 2033
- Table 43: Italy Food Bag-in-Box Revenue (undefined) Forecast, by Application 2020 & 2033
- Table 44: Italy Food Bag-in-Box Volume (K) Forecast, by Application 2020 & 2033
- Table 45: Spain Food Bag-in-Box Revenue (undefined) Forecast, by Application 2020 & 2033
- Table 46: Spain Food Bag-in-Box Volume (K) Forecast, by Application 2020 & 2033
- Table 47: Russia Food Bag-in-Box Revenue (undefined) Forecast, by Application 2020 & 2033
- Table 48: Russia Food Bag-in-Box Volume (K) Forecast, by Application 2020 & 2033
- Table 49: Benelux Food Bag-in-Box Revenue (undefined) Forecast, by Application 2020 & 2033
- Table 50: Benelux Food Bag-in-Box Volume (K) Forecast, by Application 2020 & 2033
- Table 51: Nordics Food Bag-in-Box Revenue (undefined) Forecast, by Application 2020 & 2033
- Table 52: Nordics Food Bag-in-Box Volume (K) Forecast, by Application 2020 & 2033
- Table 53: Rest of Europe Food Bag-in-Box Revenue (undefined) Forecast, by Application 2020 & 2033
- Table 54: Rest of Europe Food Bag-in-Box Volume (K) Forecast, by Application 2020 & 2033
- Table 55: Global Food Bag-in-Box Revenue undefined Forecast, by Application 2020 & 2033
- Table 56: Global Food Bag-in-Box Volume K Forecast, by Application 2020 & 2033
- Table 57: Global Food Bag-in-Box Revenue undefined Forecast, by Types 2020 & 2033
- Table 58: Global Food Bag-in-Box Volume K Forecast, by Types 2020 & 2033
- Table 59: Global Food Bag-in-Box Revenue undefined Forecast, by Country 2020 & 2033
- Table 60: Global Food Bag-in-Box Volume K Forecast, by Country 2020 & 2033
- Table 61: Turkey Food Bag-in-Box Revenue (undefined) Forecast, by Application 2020 & 2033
- Table 62: Turkey Food Bag-in-Box Volume (K) Forecast, by Application 2020 & 2033
- Table 63: Israel Food Bag-in-Box Revenue (undefined) Forecast, by Application 2020 & 2033
- Table 64: Israel Food Bag-in-Box Volume (K) Forecast, by Application 2020 & 2033
- Table 65: GCC Food Bag-in-Box Revenue (undefined) Forecast, by Application 2020 & 2033
- Table 66: GCC Food Bag-in-Box Volume (K) Forecast, by Application 2020 & 2033
- Table 67: North Africa Food Bag-in-Box Revenue (undefined) Forecast, by Application 2020 & 2033
- Table 68: North Africa Food Bag-in-Box Volume (K) Forecast, by Application 2020 & 2033
- Table 69: South Africa Food Bag-in-Box Revenue (undefined) Forecast, by Application 2020 & 2033
- Table 70: South Africa Food Bag-in-Box Volume (K) Forecast, by Application 2020 & 2033
- Table 71: Rest of Middle East & Africa Food Bag-in-Box Revenue (undefined) Forecast, by Application 2020 & 2033
- Table 72: Rest of Middle East & Africa Food Bag-in-Box Volume (K) Forecast, by Application 2020 & 2033
- Table 73: Global Food Bag-in-Box Revenue undefined Forecast, by Application 2020 & 2033
- Table 74: Global Food Bag-in-Box Volume K Forecast, by Application 2020 & 2033
- Table 75: Global Food Bag-in-Box Revenue undefined Forecast, by Types 2020 & 2033
- Table 76: Global Food Bag-in-Box Volume K Forecast, by Types 2020 & 2033
- Table 77: Global Food Bag-in-Box Revenue undefined Forecast, by Country 2020 & 2033
- Table 78: Global Food Bag-in-Box Volume K Forecast, by Country 2020 & 2033
- Table 79: China Food Bag-in-Box Revenue (undefined) Forecast, by Application 2020 & 2033
- Table 80: China Food Bag-in-Box Volume (K) Forecast, by Application 2020 & 2033
- Table 81: India Food Bag-in-Box Revenue (undefined) Forecast, by Application 2020 & 2033
- Table 82: India Food Bag-in-Box Volume (K) Forecast, by Application 2020 & 2033
- Table 83: Japan Food Bag-in-Box Revenue (undefined) Forecast, by Application 2020 & 2033
- Table 84: Japan Food Bag-in-Box Volume (K) Forecast, by Application 2020 & 2033
- Table 85: South Korea Food Bag-in-Box Revenue (undefined) Forecast, by Application 2020 & 2033
- Table 86: South Korea Food Bag-in-Box Volume (K) Forecast, by Application 2020 & 2033
- Table 87: ASEAN Food Bag-in-Box Revenue (undefined) Forecast, by Application 2020 & 2033
- Table 88: ASEAN Food Bag-in-Box Volume (K) Forecast, by Application 2020 & 2033
- Table 89: Oceania Food Bag-in-Box Revenue (undefined) Forecast, by Application 2020 & 2033
- Table 90: Oceania Food Bag-in-Box Volume (K) Forecast, by Application 2020 & 2033
- Table 91: Rest of Asia Pacific Food Bag-in-Box Revenue (undefined) Forecast, by Application 2020 & 2033
- Table 92: Rest of Asia Pacific Food Bag-in-Box Volume (K) Forecast, by Application 2020 & 2033
Frequently Asked Questions
1. What is the projected Compound Annual Growth Rate (CAGR) of the Food Bag-in-Box?
The projected CAGR is approximately 6.5%.
2. Which companies are prominent players in the Food Bag-in-Box?
Key companies in the market include Smurfit Kappa, DS Smith, Liqui-Box, Scholle IPN, CDF, Aran Group, Fujimori Kogyo, Goglio, Amcor, Vine Valley Ventures, Parish Manufacturing, TPS Rental Systems, Optopack, Accurate Box, CENTRAL PACKAGE & DISPLAY, Arlington Packaging (Rental), BiBP SP. z O.O, Hangzhou Hansin New Packing.
3. What are the main segments of the Food Bag-in-Box?
The market segments include Application, Types.
4. Can you provide details about the market size?
The market size is estimated to be USD XXX N/A as of 2022.
5. What are some drivers contributing to market growth?
N/A
6. What are the notable trends driving market growth?
N/A
7. Are there any restraints impacting market growth?
N/A
8. Can you provide examples of recent developments in the market?
N/A
9. What pricing options are available for accessing the report?
Pricing options include single-user, multi-user, and enterprise licenses priced at USD 3950.00, USD 5925.00, and USD 7900.00 respectively.
10. Is the market size provided in terms of value or volume?
The market size is provided in terms of value, measured in N/A and volume, measured in K.
11. Are there any specific market keywords associated with the report?
Yes, the market keyword associated with the report is "Food Bag-in-Box," which aids in identifying and referencing the specific market segment covered.
12. How do I determine which pricing option suits my needs best?
The pricing options vary based on user requirements and access needs. Individual users may opt for single-user licenses, while businesses requiring broader access may choose multi-user or enterprise licenses for cost-effective access to the report.
13. Are there any additional resources or data provided in the Food Bag-in-Box report?
While the report offers comprehensive insights, it's advisable to review the specific contents or supplementary materials provided to ascertain if additional resources or data are available.
14. How can I stay updated on further developments or reports in the Food Bag-in-Box?
To stay informed about further developments, trends, and reports in the Food Bag-in-Box, consider subscribing to industry newsletters, following relevant companies and organizations, or regularly checking reputable industry news sources and publications.
Methodology
Step 1 - Identification of Relevant Samples Size from Population Database


Step 2 - Approaches for Defining Global Market Size (Value, Volume* & Price*)

Note*: In applicable scenarios
Step 3 - Data Sources
Primary Research
- Web Analytics
- Survey Reports
- Research Institute
- Latest Research Reports
- Opinion Leaders
Secondary Research
- Annual Reports
- White Paper
- Latest Press Release
- Industry Association
- Paid Database
- Investor Presentations

Step 4 - Data Triangulation
Involves using different sources of information in order to increase the validity of a study
These sources are likely to be stakeholders in a program - participants, other researchers, program staff, other community members, and so on.
Then we put all data in single framework & apply various statistical tools to find out the dynamic on the market.
During the analysis stage, feedback from the stakeholder groups would be compared to determine areas of agreement as well as areas of divergence