
Key Insights
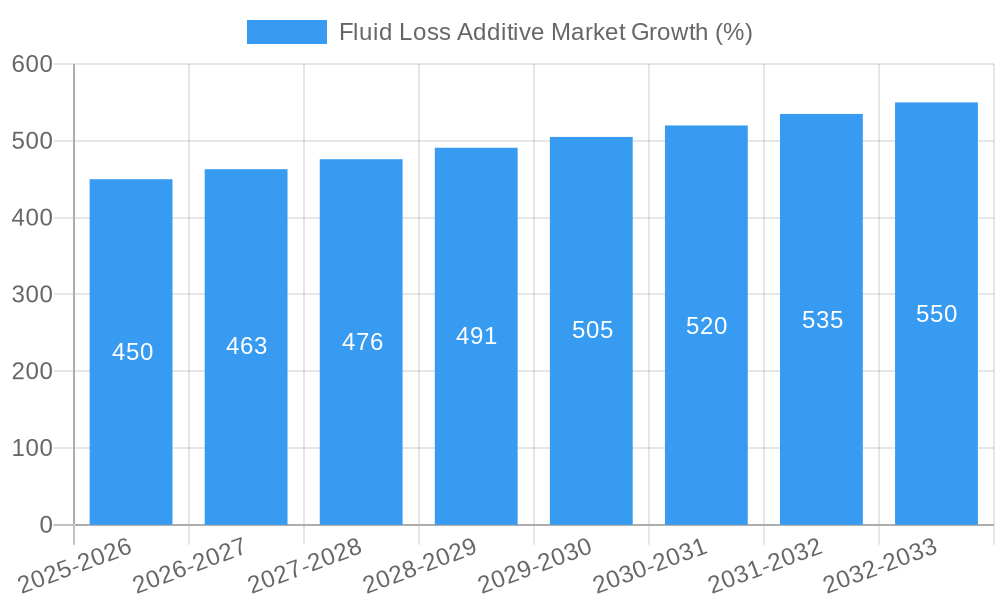
The global fluid loss additive market is experiencing robust growth, driven by the increasing demand for enhanced oil and gas recovery techniques and the expanding construction industry. The market's Compound Annual Growth Rate (CAGR) exceeding 3.0% signifies a consistent upward trajectory projected through 2033. Key drivers include the rising need for efficient drilling fluids in shale gas exploration and the growing adoption of environmentally friendly, natural and synthetically modified natural additives. The market is segmented by additive type (synthetic, natural, synthetically modified natural) and application (drilling fluid, cement slurry), each exhibiting unique growth patterns. Synthetic additives currently dominate due to their superior performance characteristics, but the demand for environmentally sustainable natural and modified natural additives is steadily increasing, presenting a significant opportunity for market expansion. Regional variations exist, with Asia Pacific, particularly China and India, exhibiting strong growth due to substantial infrastructure development and energy exploration activities. North America and Europe also contribute significantly, fueled by ongoing oil and gas operations and construction projects. While factors like fluctuating raw material prices and stringent environmental regulations pose challenges, the overall market outlook remains positive, anticipating a substantial increase in market value over the forecast period. The competitive landscape is characterized by the presence of both large multinational corporations and specialized smaller companies, leading to innovation and diversification of product offerings.
The continued expansion of the global energy sector and infrastructure development projects will remain a crucial catalyst for growth. The increasing focus on sustainability and environmental regulations is shaping the market towards the adoption of eco-friendly fluid loss additives. Furthermore, technological advancements in additive formulation and performance enhancement are expected to contribute to market growth. Companies are strategically investing in research and development to improve product efficiency and reduce environmental impact. This focus on sustainability combined with the ongoing demand for effective drilling and cementing solutions positions the fluid loss additive market for continued expansion in the coming years. Competitive pressures will likely drive innovation and price optimization, further shaping the market dynamics.

Fluid Loss Additive Market: A Comprehensive Report (2019-2033)
This comprehensive report provides an in-depth analysis of the global Fluid Loss Additive market, offering invaluable insights for stakeholders across the value chain. The study period spans from 2019 to 2033, with 2025 serving as the base and estimated year. The forecast period extends from 2025 to 2033, covering historical data from 2019 to 2024. The report meticulously segments the market by additive type (Synthetic, Natural, Synthetically Modified Natural) and application (Drilling Fluid, Cement Slurry), providing a granular understanding of market dynamics. Key players such as Clariant, Nouryon, Global Drilling Fluids and Chemicals Limited, Solvay, Newpark Resources Inc, Kemira OYJ, BASF SE, Tytan Organics Pvt Ltd, Halliburton, and Schlumberger Limited are extensively profiled. The report quantifies market size in Millions and offers crucial CAGR projections to guide strategic decision-making.
Fluid Loss Additive Market Market Structure & Competitive Dynamics
The Fluid Loss Additive market exhibits a moderately consolidated structure, with the top 10 players holding an estimated xx% market share in 2025. Innovation ecosystems are primarily driven by the need for environmentally friendly and high-performance additives, leading to significant R&D investments. Regulatory frameworks, particularly concerning environmental protection and worker safety, significantly influence product development and market access. Product substitutes, such as alternative drilling fluids, pose a moderate threat, while end-user trends towards sustainable practices are reshaping market demand. M&A activities have been relatively frequent in recent years, with deal values exceeding xx Million in the last five years, primarily focused on expanding product portfolios and geographic reach. Market share fluctuations among key players are primarily driven by product innovation cycles and successful M&A strategies.
- Market Concentration: Moderately consolidated; Top 10 players hold approximately xx% market share (2025).
- Innovation Ecosystems: Focused on eco-friendly and high-performance additives.
- Regulatory Frameworks: Stringent environmental and safety regulations influence product development.
- M&A Activity: Significant activity in recent years, with deal values exceeding xx Million.
Fluid Loss Additive Market Industry Trends & Insights
The global Fluid Loss Additive market is projected to witness robust growth, with a CAGR of xx% during the forecast period (2025-2033). This growth is fueled by several key factors, including the increasing demand for oil and gas exploration and production, particularly in emerging economies. Technological advancements in additive formulations are leading to improved performance characteristics and enhanced sustainability. Consumer preferences are increasingly shifting towards environmentally responsible solutions, driving demand for bio-based and biodegradable additives. Intense competition among major players is promoting innovation and driving down prices, benefiting end-users. Market penetration of synthetic additives is steadily increasing due to their superior performance compared to natural counterparts.
Dominant Markets & Segments in Fluid Loss Additive Market
The North American region is currently the dominant market for Fluid Loss Additives, driven by robust oil and gas exploration activities and a well-established infrastructure. However, the Asia-Pacific region is expected to exhibit the highest growth rate during the forecast period, fueled by rapid industrialization and infrastructure development. Within additive types, the synthetic segment holds the largest market share, owing to its superior performance and versatility. In terms of applications, the drilling fluid segment constitutes the majority of market demand.
Key Drivers:
- North America: Strong oil and gas exploration, developed infrastructure.
- Asia-Pacific: Rapid industrialization and infrastructure development, rising energy demand.
- Synthetic Additives: Superior performance, versatility.
- Drilling Fluid Application: Dominates market demand due to higher volume usage.
Fluid Loss Additive Market Product Innovations
Recent product innovations focus on developing environmentally friendly, high-performance additives with improved rheological properties and reduced environmental impact. These include bio-based additives derived from renewable resources and synthetic additives formulated to minimize toxicity and enhance biodegradability. These innovations aim to address growing environmental concerns and comply with stringent regulatory requirements while enhancing drilling efficiency and reducing costs. Competitive advantages stem from superior performance, cost-effectiveness, and environmental friendliness.
Report Segmentation & Scope
The report segments the Fluid Loss Additive market by additive type (Synthetic, Natural, Synthetically Modified Natural) and application (Drilling Fluid, Cement Slurry). Each segment provides detailed analysis, including market size, growth projections, and competitive dynamics. The Synthetic segment is projected to experience significant growth due to its superior properties. The Natural segment holds a niche market share, with limited growth expected. The Synthetically Modified Natural segment presents moderate growth potential. In terms of application, the Drilling Fluid segment is dominant, while the Cement Slurry segment demonstrates consistent yet slower growth.
Key Drivers of Fluid Loss Additive Market Growth
Several factors drive the growth of the Fluid Loss Additive market. These include the increasing demand for oil and gas extraction, coupled with ongoing investments in infrastructure development, particularly in emerging economies. Technological advancements lead to the development of enhanced additives with better performance and environmental profiles. Favorable government policies promoting sustainable practices in the energy sector further support market expansion.
Challenges in the Fluid Loss Additive Market Sector
The Fluid Loss Additive market faces several challenges, including fluctuating crude oil prices impacting exploration and production activity. Stringent environmental regulations necessitate compliance, adding to production costs. Supply chain disruptions and price volatility of raw materials also pose significant challenges. Intense competition among major players necessitates continuous innovation and cost optimization to maintain market share.
Leading Players in the Fluid Loss Additive Market Market
- Clariant
- Nouryon
- Global Drilling Fluids and Chemicals Limited
- Solvay
- Newpark Resources Inc
- Kemira OYJ
- BASF SE
- Tytan Organics Pvt Ltd
- Halliburton
- Schlumberger Limited
Key Developments in Fluid Loss Additive Market Sector
- 2023 Q3: Clariant launched a new generation of bio-based fluid loss additive.
- 2022 Q4: Nouryon and a smaller competitor announced a merger.
- 2021 Q2: BASF SE introduced a novel synthetic additive with enhanced performance characteristics.
- 2020 Q1: New regulations concerning the use of certain additives came into effect in the EU.
Strategic Fluid Loss Additive Market Market Outlook
The Fluid Loss Additive market presents significant growth potential, driven by sustained demand for oil and gas, ongoing infrastructure development, and increasing focus on sustainable practices. Strategic opportunities lie in developing innovative, eco-friendly additives that meet stringent environmental regulations. Companies can gain a competitive edge by focusing on R&D, strategic partnerships, and expanding into high-growth regions, particularly in Asia-Pacific.
Fluid Loss Additive Market Segmentation
-
1. Additive Type
- 1.1. Synthetic
- 1.2. Natural
- 1.3. Synthetically Modified Natural
-
2. Application
- 2.1. Drilling Fluid
- 2.2. Cement Slurry
Fluid Loss Additive Market Segmentation By Geography
-
1. Asia Pacific
- 1.1. China
- 1.2. India
- 1.3. Japan
- 1.4. South Korea
- 1.5. Rest of Asia Pacific
-
2. North America
- 2.1. United States
- 2.2. Canada
- 2.3. Mexico
-
3. Europe
- 3.1. Germany
- 3.2. United Kingdom
- 3.3. France
- 3.4. Italy
- 3.5. Rest of Europe
-
4. South America
- 4.1. Brazil
- 4.2. Argentina
- 4.3. Rest of South America
-
5. Middle East and Africa
- 5.1. Saudi Arabia
- 5.2. South Africa
- 5.3. Rest of Middle East and Africa

Fluid Loss Additive Market REPORT HIGHLIGHTS
| Aspects | Details |
|---|---|
| Study Period | 2019-2033 |
| Base Year | 2024 |
| Estimated Year | 2025 |
| Forecast Period | 2025-2033 |
| Historical Period | 2019-2024 |
| Growth Rate | CAGR of > 3.00% from 2019-2033 |
| Segmentation |
|
Table of Contents
- 1. Introduction
- 1.1. Research Scope
- 1.2. Market Segmentation
- 1.3. Research Methodology
- 1.4. Definitions and Assumptions
- 2. Executive Summary
- 2.1. Introduction
- 3. Market Dynamics
- 3.1. Introduction
- 3.2. Market Drivers
- 3.2.1. ; Increase in Shale Gas Exploration; Increasing Investments in the Latest and Unconventional Drilling Technologies
- 3.3. Market Restrains
- 3.3.1. ; Growing Demand for Electric Vehicles; Harmful Impact on Environment
- 3.4. Market Trends
- 3.4.1. Drilling Fluid Application to Dominate the Market
- 4. Market Factor Analysis
- 4.1. Porters Five Forces
- 4.2. Supply/Value Chain
- 4.3. PESTEL analysis
- 4.4. Market Entropy
- 4.5. Patent/Trademark Analysis
- 5. Global Fluid Loss Additive Market Analysis, Insights and Forecast, 2019-2031
- 5.1. Market Analysis, Insights and Forecast - by Additive Type
- 5.1.1. Synthetic
- 5.1.2. Natural
- 5.1.3. Synthetically Modified Natural
- 5.2. Market Analysis, Insights and Forecast - by Application
- 5.2.1. Drilling Fluid
- 5.2.2. Cement Slurry
- 5.3. Market Analysis, Insights and Forecast - by Region
- 5.3.1. Asia Pacific
- 5.3.2. North America
- 5.3.3. Europe
- 5.3.4. South America
- 5.3.5. Middle East and Africa
- 5.1. Market Analysis, Insights and Forecast - by Additive Type
- 6. Asia Pacific Fluid Loss Additive Market Analysis, Insights and Forecast, 2019-2031
- 6.1. Market Analysis, Insights and Forecast - by Additive Type
- 6.1.1. Synthetic
- 6.1.2. Natural
- 6.1.3. Synthetically Modified Natural
- 6.2. Market Analysis, Insights and Forecast - by Application
- 6.2.1. Drilling Fluid
- 6.2.2. Cement Slurry
- 6.1. Market Analysis, Insights and Forecast - by Additive Type
- 7. North America Fluid Loss Additive Market Analysis, Insights and Forecast, 2019-2031
- 7.1. Market Analysis, Insights and Forecast - by Additive Type
- 7.1.1. Synthetic
- 7.1.2. Natural
- 7.1.3. Synthetically Modified Natural
- 7.2. Market Analysis, Insights and Forecast - by Application
- 7.2.1. Drilling Fluid
- 7.2.2. Cement Slurry
- 7.1. Market Analysis, Insights and Forecast - by Additive Type
- 8. Europe Fluid Loss Additive Market Analysis, Insights and Forecast, 2019-2031
- 8.1. Market Analysis, Insights and Forecast - by Additive Type
- 8.1.1. Synthetic
- 8.1.2. Natural
- 8.1.3. Synthetically Modified Natural
- 8.2. Market Analysis, Insights and Forecast - by Application
- 8.2.1. Drilling Fluid
- 8.2.2. Cement Slurry
- 8.1. Market Analysis, Insights and Forecast - by Additive Type
- 9. South America Fluid Loss Additive Market Analysis, Insights and Forecast, 2019-2031
- 9.1. Market Analysis, Insights and Forecast - by Additive Type
- 9.1.1. Synthetic
- 9.1.2. Natural
- 9.1.3. Synthetically Modified Natural
- 9.2. Market Analysis, Insights and Forecast - by Application
- 9.2.1. Drilling Fluid
- 9.2.2. Cement Slurry
- 9.1. Market Analysis, Insights and Forecast - by Additive Type
- 10. Middle East and Africa Fluid Loss Additive Market Analysis, Insights and Forecast, 2019-2031
- 10.1. Market Analysis, Insights and Forecast - by Additive Type
- 10.1.1. Synthetic
- 10.1.2. Natural
- 10.1.3. Synthetically Modified Natural
- 10.2. Market Analysis, Insights and Forecast - by Application
- 10.2.1. Drilling Fluid
- 10.2.2. Cement Slurry
- 10.1. Market Analysis, Insights and Forecast - by Additive Type
- 11. Asia Pacific Fluid Loss Additive Market Analysis, Insights and Forecast, 2019-2031
- 11.1. Market Analysis, Insights and Forecast - By Country/Sub-region
- 11.1.1 China
- 11.1.2 India
- 11.1.3 Japan
- 11.1.4 South Korea
- 11.1.5 Rest of Asia Pacific
- 12. North America Fluid Loss Additive Market Analysis, Insights and Forecast, 2019-2031
- 12.1. Market Analysis, Insights and Forecast - By Country/Sub-region
- 12.1.1 United States
- 12.1.2 Canada
- 12.1.3 Mexico
- 13. Europe Fluid Loss Additive Market Analysis, Insights and Forecast, 2019-2031
- 13.1. Market Analysis, Insights and Forecast - By Country/Sub-region
- 13.1.1 Germany
- 13.1.2 United Kingdom
- 13.1.3 France
- 13.1.4 Italy
- 13.1.5 Rest of Europe
- 14. South America Fluid Loss Additive Market Analysis, Insights and Forecast, 2019-2031
- 14.1. Market Analysis, Insights and Forecast - By Country/Sub-region
- 14.1.1 Brazil
- 14.1.2 Argentina
- 14.1.3 Rest of South America
- 15. Middle East and Africa Fluid Loss Additive Market Analysis, Insights and Forecast, 2019-2031
- 15.1. Market Analysis, Insights and Forecast - By Country/Sub-region
- 15.1.1 Saudi Arabia
- 15.1.2 South Africa
- 15.1.3 Rest of Middle East and Africa
- 16. Competitive Analysis
- 16.1. Global Market Share Analysis 2024
- 16.2. Company Profiles
- 16.2.1 Clariant
- 16.2.1.1. Overview
- 16.2.1.2. Products
- 16.2.1.3. SWOT Analysis
- 16.2.1.4. Recent Developments
- 16.2.1.5. Financials (Based on Availability)
- 16.2.2 Nouryon
- 16.2.2.1. Overview
- 16.2.2.2. Products
- 16.2.2.3. SWOT Analysis
- 16.2.2.4. Recent Developments
- 16.2.2.5. Financials (Based on Availability)
- 16.2.3 Global Drilling Fluids and Chemicals Limited
- 16.2.3.1. Overview
- 16.2.3.2. Products
- 16.2.3.3. SWOT Analysis
- 16.2.3.4. Recent Developments
- 16.2.3.5. Financials (Based on Availability)
- 16.2.4 Solvay
- 16.2.4.1. Overview
- 16.2.4.2. Products
- 16.2.4.3. SWOT Analysis
- 16.2.4.4. Recent Developments
- 16.2.4.5. Financials (Based on Availability)
- 16.2.5 Newpark Resources Inc
- 16.2.5.1. Overview
- 16.2.5.2. Products
- 16.2.5.3. SWOT Analysis
- 16.2.5.4. Recent Developments
- 16.2.5.5. Financials (Based on Availability)
- 16.2.6 Kemira OYJ
- 16.2.6.1. Overview
- 16.2.6.2. Products
- 16.2.6.3. SWOT Analysis
- 16.2.6.4. Recent Developments
- 16.2.6.5. Financials (Based on Availability)
- 16.2.7 BASF SE
- 16.2.7.1. Overview
- 16.2.7.2. Products
- 16.2.7.3. SWOT Analysis
- 16.2.7.4. Recent Developments
- 16.2.7.5. Financials (Based on Availability)
- 16.2.8 Tytan Organics Pvt Ltd
- 16.2.8.1. Overview
- 16.2.8.2. Products
- 16.2.8.3. SWOT Analysis
- 16.2.8.4. Recent Developments
- 16.2.8.5. Financials (Based on Availability)
- 16.2.9 Halliburton
- 16.2.9.1. Overview
- 16.2.9.2. Products
- 16.2.9.3. SWOT Analysis
- 16.2.9.4. Recent Developments
- 16.2.9.5. Financials (Based on Availability)
- 16.2.10 Schlumberger Limited
- 16.2.10.1. Overview
- 16.2.10.2. Products
- 16.2.10.3. SWOT Analysis
- 16.2.10.4. Recent Developments
- 16.2.10.5. Financials (Based on Availability)
- 16.2.1 Clariant
List of Figures
- Figure 1: Global Fluid Loss Additive Market Revenue Breakdown (Million, %) by Region 2024 & 2032
- Figure 2: Global Fluid Loss Additive Market Volume Breakdown (kg/m3, %) by Region 2024 & 2032
- Figure 3: Asia Pacific Fluid Loss Additive Market Revenue (Million), by Country 2024 & 2032
- Figure 4: Asia Pacific Fluid Loss Additive Market Volume (kg/m3), by Country 2024 & 2032
- Figure 5: Asia Pacific Fluid Loss Additive Market Revenue Share (%), by Country 2024 & 2032
- Figure 6: Asia Pacific Fluid Loss Additive Market Volume Share (%), by Country 2024 & 2032
- Figure 7: North America Fluid Loss Additive Market Revenue (Million), by Country 2024 & 2032
- Figure 8: North America Fluid Loss Additive Market Volume (kg/m3), by Country 2024 & 2032
- Figure 9: North America Fluid Loss Additive Market Revenue Share (%), by Country 2024 & 2032
- Figure 10: North America Fluid Loss Additive Market Volume Share (%), by Country 2024 & 2032
- Figure 11: Europe Fluid Loss Additive Market Revenue (Million), by Country 2024 & 2032
- Figure 12: Europe Fluid Loss Additive Market Volume (kg/m3), by Country 2024 & 2032
- Figure 13: Europe Fluid Loss Additive Market Revenue Share (%), by Country 2024 & 2032
- Figure 14: Europe Fluid Loss Additive Market Volume Share (%), by Country 2024 & 2032
- Figure 15: South America Fluid Loss Additive Market Revenue (Million), by Country 2024 & 2032
- Figure 16: South America Fluid Loss Additive Market Volume (kg/m3), by Country 2024 & 2032
- Figure 17: South America Fluid Loss Additive Market Revenue Share (%), by Country 2024 & 2032
- Figure 18: South America Fluid Loss Additive Market Volume Share (%), by Country 2024 & 2032
- Figure 19: Middle East and Africa Fluid Loss Additive Market Revenue (Million), by Country 2024 & 2032
- Figure 20: Middle East and Africa Fluid Loss Additive Market Volume (kg/m3), by Country 2024 & 2032
- Figure 21: Middle East and Africa Fluid Loss Additive Market Revenue Share (%), by Country 2024 & 2032
- Figure 22: Middle East and Africa Fluid Loss Additive Market Volume Share (%), by Country 2024 & 2032
- Figure 23: Asia Pacific Fluid Loss Additive Market Revenue (Million), by Additive Type 2024 & 2032
- Figure 24: Asia Pacific Fluid Loss Additive Market Volume (kg/m3), by Additive Type 2024 & 2032
- Figure 25: Asia Pacific Fluid Loss Additive Market Revenue Share (%), by Additive Type 2024 & 2032
- Figure 26: Asia Pacific Fluid Loss Additive Market Volume Share (%), by Additive Type 2024 & 2032
- Figure 27: Asia Pacific Fluid Loss Additive Market Revenue (Million), by Application 2024 & 2032
- Figure 28: Asia Pacific Fluid Loss Additive Market Volume (kg/m3), by Application 2024 & 2032
- Figure 29: Asia Pacific Fluid Loss Additive Market Revenue Share (%), by Application 2024 & 2032
- Figure 30: Asia Pacific Fluid Loss Additive Market Volume Share (%), by Application 2024 & 2032
- Figure 31: Asia Pacific Fluid Loss Additive Market Revenue (Million), by Country 2024 & 2032
- Figure 32: Asia Pacific Fluid Loss Additive Market Volume (kg/m3), by Country 2024 & 2032
- Figure 33: Asia Pacific Fluid Loss Additive Market Revenue Share (%), by Country 2024 & 2032
- Figure 34: Asia Pacific Fluid Loss Additive Market Volume Share (%), by Country 2024 & 2032
- Figure 35: North America Fluid Loss Additive Market Revenue (Million), by Additive Type 2024 & 2032
- Figure 36: North America Fluid Loss Additive Market Volume (kg/m3), by Additive Type 2024 & 2032
- Figure 37: North America Fluid Loss Additive Market Revenue Share (%), by Additive Type 2024 & 2032
- Figure 38: North America Fluid Loss Additive Market Volume Share (%), by Additive Type 2024 & 2032
- Figure 39: North America Fluid Loss Additive Market Revenue (Million), by Application 2024 & 2032
- Figure 40: North America Fluid Loss Additive Market Volume (kg/m3), by Application 2024 & 2032
- Figure 41: North America Fluid Loss Additive Market Revenue Share (%), by Application 2024 & 2032
- Figure 42: North America Fluid Loss Additive Market Volume Share (%), by Application 2024 & 2032
- Figure 43: North America Fluid Loss Additive Market Revenue (Million), by Country 2024 & 2032
- Figure 44: North America Fluid Loss Additive Market Volume (kg/m3), by Country 2024 & 2032
- Figure 45: North America Fluid Loss Additive Market Revenue Share (%), by Country 2024 & 2032
- Figure 46: North America Fluid Loss Additive Market Volume Share (%), by Country 2024 & 2032
- Figure 47: Europe Fluid Loss Additive Market Revenue (Million), by Additive Type 2024 & 2032
- Figure 48: Europe Fluid Loss Additive Market Volume (kg/m3), by Additive Type 2024 & 2032
- Figure 49: Europe Fluid Loss Additive Market Revenue Share (%), by Additive Type 2024 & 2032
- Figure 50: Europe Fluid Loss Additive Market Volume Share (%), by Additive Type 2024 & 2032
- Figure 51: Europe Fluid Loss Additive Market Revenue (Million), by Application 2024 & 2032
- Figure 52: Europe Fluid Loss Additive Market Volume (kg/m3), by Application 2024 & 2032
- Figure 53: Europe Fluid Loss Additive Market Revenue Share (%), by Application 2024 & 2032
- Figure 54: Europe Fluid Loss Additive Market Volume Share (%), by Application 2024 & 2032
- Figure 55: Europe Fluid Loss Additive Market Revenue (Million), by Country 2024 & 2032
- Figure 56: Europe Fluid Loss Additive Market Volume (kg/m3), by Country 2024 & 2032
- Figure 57: Europe Fluid Loss Additive Market Revenue Share (%), by Country 2024 & 2032
- Figure 58: Europe Fluid Loss Additive Market Volume Share (%), by Country 2024 & 2032
- Figure 59: South America Fluid Loss Additive Market Revenue (Million), by Additive Type 2024 & 2032
- Figure 60: South America Fluid Loss Additive Market Volume (kg/m3), by Additive Type 2024 & 2032
- Figure 61: South America Fluid Loss Additive Market Revenue Share (%), by Additive Type 2024 & 2032
- Figure 62: South America Fluid Loss Additive Market Volume Share (%), by Additive Type 2024 & 2032
- Figure 63: South America Fluid Loss Additive Market Revenue (Million), by Application 2024 & 2032
- Figure 64: South America Fluid Loss Additive Market Volume (kg/m3), by Application 2024 & 2032
- Figure 65: South America Fluid Loss Additive Market Revenue Share (%), by Application 2024 & 2032
- Figure 66: South America Fluid Loss Additive Market Volume Share (%), by Application 2024 & 2032
- Figure 67: South America Fluid Loss Additive Market Revenue (Million), by Country 2024 & 2032
- Figure 68: South America Fluid Loss Additive Market Volume (kg/m3), by Country 2024 & 2032
- Figure 69: South America Fluid Loss Additive Market Revenue Share (%), by Country 2024 & 2032
- Figure 70: South America Fluid Loss Additive Market Volume Share (%), by Country 2024 & 2032
- Figure 71: Middle East and Africa Fluid Loss Additive Market Revenue (Million), by Additive Type 2024 & 2032
- Figure 72: Middle East and Africa Fluid Loss Additive Market Volume (kg/m3), by Additive Type 2024 & 2032
- Figure 73: Middle East and Africa Fluid Loss Additive Market Revenue Share (%), by Additive Type 2024 & 2032
- Figure 74: Middle East and Africa Fluid Loss Additive Market Volume Share (%), by Additive Type 2024 & 2032
- Figure 75: Middle East and Africa Fluid Loss Additive Market Revenue (Million), by Application 2024 & 2032
- Figure 76: Middle East and Africa Fluid Loss Additive Market Volume (kg/m3), by Application 2024 & 2032
- Figure 77: Middle East and Africa Fluid Loss Additive Market Revenue Share (%), by Application 2024 & 2032
- Figure 78: Middle East and Africa Fluid Loss Additive Market Volume Share (%), by Application 2024 & 2032
- Figure 79: Middle East and Africa Fluid Loss Additive Market Revenue (Million), by Country 2024 & 2032
- Figure 80: Middle East and Africa Fluid Loss Additive Market Volume (kg/m3), by Country 2024 & 2032
- Figure 81: Middle East and Africa Fluid Loss Additive Market Revenue Share (%), by Country 2024 & 2032
- Figure 82: Middle East and Africa Fluid Loss Additive Market Volume Share (%), by Country 2024 & 2032
List of Tables
- Table 1: Global Fluid Loss Additive Market Revenue Million Forecast, by Region 2019 & 2032
- Table 2: Global Fluid Loss Additive Market Volume kg/m3 Forecast, by Region 2019 & 2032
- Table 3: Global Fluid Loss Additive Market Revenue Million Forecast, by Additive Type 2019 & 2032
- Table 4: Global Fluid Loss Additive Market Volume kg/m3 Forecast, by Additive Type 2019 & 2032
- Table 5: Global Fluid Loss Additive Market Revenue Million Forecast, by Application 2019 & 2032
- Table 6: Global Fluid Loss Additive Market Volume kg/m3 Forecast, by Application 2019 & 2032
- Table 7: Global Fluid Loss Additive Market Revenue Million Forecast, by Region 2019 & 2032
- Table 8: Global Fluid Loss Additive Market Volume kg/m3 Forecast, by Region 2019 & 2032
- Table 9: Global Fluid Loss Additive Market Revenue Million Forecast, by Country 2019 & 2032
- Table 10: Global Fluid Loss Additive Market Volume kg/m3 Forecast, by Country 2019 & 2032
- Table 11: China Fluid Loss Additive Market Revenue (Million) Forecast, by Application 2019 & 2032
- Table 12: China Fluid Loss Additive Market Volume (kg/m3) Forecast, by Application 2019 & 2032
- Table 13: India Fluid Loss Additive Market Revenue (Million) Forecast, by Application 2019 & 2032
- Table 14: India Fluid Loss Additive Market Volume (kg/m3) Forecast, by Application 2019 & 2032
- Table 15: Japan Fluid Loss Additive Market Revenue (Million) Forecast, by Application 2019 & 2032
- Table 16: Japan Fluid Loss Additive Market Volume (kg/m3) Forecast, by Application 2019 & 2032
- Table 17: South Korea Fluid Loss Additive Market Revenue (Million) Forecast, by Application 2019 & 2032
- Table 18: South Korea Fluid Loss Additive Market Volume (kg/m3) Forecast, by Application 2019 & 2032
- Table 19: Rest of Asia Pacific Fluid Loss Additive Market Revenue (Million) Forecast, by Application 2019 & 2032
- Table 20: Rest of Asia Pacific Fluid Loss Additive Market Volume (kg/m3) Forecast, by Application 2019 & 2032
- Table 21: Global Fluid Loss Additive Market Revenue Million Forecast, by Country 2019 & 2032
- Table 22: Global Fluid Loss Additive Market Volume kg/m3 Forecast, by Country 2019 & 2032
- Table 23: United States Fluid Loss Additive Market Revenue (Million) Forecast, by Application 2019 & 2032
- Table 24: United States Fluid Loss Additive Market Volume (kg/m3) Forecast, by Application 2019 & 2032
- Table 25: Canada Fluid Loss Additive Market Revenue (Million) Forecast, by Application 2019 & 2032
- Table 26: Canada Fluid Loss Additive Market Volume (kg/m3) Forecast, by Application 2019 & 2032
- Table 27: Mexico Fluid Loss Additive Market Revenue (Million) Forecast, by Application 2019 & 2032
- Table 28: Mexico Fluid Loss Additive Market Volume (kg/m3) Forecast, by Application 2019 & 2032
- Table 29: Global Fluid Loss Additive Market Revenue Million Forecast, by Country 2019 & 2032
- Table 30: Global Fluid Loss Additive Market Volume kg/m3 Forecast, by Country 2019 & 2032
- Table 31: Germany Fluid Loss Additive Market Revenue (Million) Forecast, by Application 2019 & 2032
- Table 32: Germany Fluid Loss Additive Market Volume (kg/m3) Forecast, by Application 2019 & 2032
- Table 33: United Kingdom Fluid Loss Additive Market Revenue (Million) Forecast, by Application 2019 & 2032
- Table 34: United Kingdom Fluid Loss Additive Market Volume (kg/m3) Forecast, by Application 2019 & 2032
- Table 35: France Fluid Loss Additive Market Revenue (Million) Forecast, by Application 2019 & 2032
- Table 36: France Fluid Loss Additive Market Volume (kg/m3) Forecast, by Application 2019 & 2032
- Table 37: Italy Fluid Loss Additive Market Revenue (Million) Forecast, by Application 2019 & 2032
- Table 38: Italy Fluid Loss Additive Market Volume (kg/m3) Forecast, by Application 2019 & 2032
- Table 39: Rest of Europe Fluid Loss Additive Market Revenue (Million) Forecast, by Application 2019 & 2032
- Table 40: Rest of Europe Fluid Loss Additive Market Volume (kg/m3) Forecast, by Application 2019 & 2032
- Table 41: Global Fluid Loss Additive Market Revenue Million Forecast, by Country 2019 & 2032
- Table 42: Global Fluid Loss Additive Market Volume kg/m3 Forecast, by Country 2019 & 2032
- Table 43: Brazil Fluid Loss Additive Market Revenue (Million) Forecast, by Application 2019 & 2032
- Table 44: Brazil Fluid Loss Additive Market Volume (kg/m3) Forecast, by Application 2019 & 2032
- Table 45: Argentina Fluid Loss Additive Market Revenue (Million) Forecast, by Application 2019 & 2032
- Table 46: Argentina Fluid Loss Additive Market Volume (kg/m3) Forecast, by Application 2019 & 2032
- Table 47: Rest of South America Fluid Loss Additive Market Revenue (Million) Forecast, by Application 2019 & 2032
- Table 48: Rest of South America Fluid Loss Additive Market Volume (kg/m3) Forecast, by Application 2019 & 2032
- Table 49: Global Fluid Loss Additive Market Revenue Million Forecast, by Country 2019 & 2032
- Table 50: Global Fluid Loss Additive Market Volume kg/m3 Forecast, by Country 2019 & 2032
- Table 51: Saudi Arabia Fluid Loss Additive Market Revenue (Million) Forecast, by Application 2019 & 2032
- Table 52: Saudi Arabia Fluid Loss Additive Market Volume (kg/m3) Forecast, by Application 2019 & 2032
- Table 53: South Africa Fluid Loss Additive Market Revenue (Million) Forecast, by Application 2019 & 2032
- Table 54: South Africa Fluid Loss Additive Market Volume (kg/m3) Forecast, by Application 2019 & 2032
- Table 55: Rest of Middle East and Africa Fluid Loss Additive Market Revenue (Million) Forecast, by Application 2019 & 2032
- Table 56: Rest of Middle East and Africa Fluid Loss Additive Market Volume (kg/m3) Forecast, by Application 2019 & 2032
- Table 57: Global Fluid Loss Additive Market Revenue Million Forecast, by Additive Type 2019 & 2032
- Table 58: Global Fluid Loss Additive Market Volume kg/m3 Forecast, by Additive Type 2019 & 2032
- Table 59: Global Fluid Loss Additive Market Revenue Million Forecast, by Application 2019 & 2032
- Table 60: Global Fluid Loss Additive Market Volume kg/m3 Forecast, by Application 2019 & 2032
- Table 61: Global Fluid Loss Additive Market Revenue Million Forecast, by Country 2019 & 2032
- Table 62: Global Fluid Loss Additive Market Volume kg/m3 Forecast, by Country 2019 & 2032
- Table 63: China Fluid Loss Additive Market Revenue (Million) Forecast, by Application 2019 & 2032
- Table 64: China Fluid Loss Additive Market Volume (kg/m3) Forecast, by Application 2019 & 2032
- Table 65: India Fluid Loss Additive Market Revenue (Million) Forecast, by Application 2019 & 2032
- Table 66: India Fluid Loss Additive Market Volume (kg/m3) Forecast, by Application 2019 & 2032
- Table 67: Japan Fluid Loss Additive Market Revenue (Million) Forecast, by Application 2019 & 2032
- Table 68: Japan Fluid Loss Additive Market Volume (kg/m3) Forecast, by Application 2019 & 2032
- Table 69: South Korea Fluid Loss Additive Market Revenue (Million) Forecast, by Application 2019 & 2032
- Table 70: South Korea Fluid Loss Additive Market Volume (kg/m3) Forecast, by Application 2019 & 2032
- Table 71: Rest of Asia Pacific Fluid Loss Additive Market Revenue (Million) Forecast, by Application 2019 & 2032
- Table 72: Rest of Asia Pacific Fluid Loss Additive Market Volume (kg/m3) Forecast, by Application 2019 & 2032
- Table 73: Global Fluid Loss Additive Market Revenue Million Forecast, by Additive Type 2019 & 2032
- Table 74: Global Fluid Loss Additive Market Volume kg/m3 Forecast, by Additive Type 2019 & 2032
- Table 75: Global Fluid Loss Additive Market Revenue Million Forecast, by Application 2019 & 2032
- Table 76: Global Fluid Loss Additive Market Volume kg/m3 Forecast, by Application 2019 & 2032
- Table 77: Global Fluid Loss Additive Market Revenue Million Forecast, by Country 2019 & 2032
- Table 78: Global Fluid Loss Additive Market Volume kg/m3 Forecast, by Country 2019 & 2032
- Table 79: United States Fluid Loss Additive Market Revenue (Million) Forecast, by Application 2019 & 2032
- Table 80: United States Fluid Loss Additive Market Volume (kg/m3) Forecast, by Application 2019 & 2032
- Table 81: Canada Fluid Loss Additive Market Revenue (Million) Forecast, by Application 2019 & 2032
- Table 82: Canada Fluid Loss Additive Market Volume (kg/m3) Forecast, by Application 2019 & 2032
- Table 83: Mexico Fluid Loss Additive Market Revenue (Million) Forecast, by Application 2019 & 2032
- Table 84: Mexico Fluid Loss Additive Market Volume (kg/m3) Forecast, by Application 2019 & 2032
- Table 85: Global Fluid Loss Additive Market Revenue Million Forecast, by Additive Type 2019 & 2032
- Table 86: Global Fluid Loss Additive Market Volume kg/m3 Forecast, by Additive Type 2019 & 2032
- Table 87: Global Fluid Loss Additive Market Revenue Million Forecast, by Application 2019 & 2032
- Table 88: Global Fluid Loss Additive Market Volume kg/m3 Forecast, by Application 2019 & 2032
- Table 89: Global Fluid Loss Additive Market Revenue Million Forecast, by Country 2019 & 2032
- Table 90: Global Fluid Loss Additive Market Volume kg/m3 Forecast, by Country 2019 & 2032
- Table 91: Germany Fluid Loss Additive Market Revenue (Million) Forecast, by Application 2019 & 2032
- Table 92: Germany Fluid Loss Additive Market Volume (kg/m3) Forecast, by Application 2019 & 2032
- Table 93: United Kingdom Fluid Loss Additive Market Revenue (Million) Forecast, by Application 2019 & 2032
- Table 94: United Kingdom Fluid Loss Additive Market Volume (kg/m3) Forecast, by Application 2019 & 2032
- Table 95: France Fluid Loss Additive Market Revenue (Million) Forecast, by Application 2019 & 2032
- Table 96: France Fluid Loss Additive Market Volume (kg/m3) Forecast, by Application 2019 & 2032
- Table 97: Italy Fluid Loss Additive Market Revenue (Million) Forecast, by Application 2019 & 2032
- Table 98: Italy Fluid Loss Additive Market Volume (kg/m3) Forecast, by Application 2019 & 2032
- Table 99: Rest of Europe Fluid Loss Additive Market Revenue (Million) Forecast, by Application 2019 & 2032
- Table 100: Rest of Europe Fluid Loss Additive Market Volume (kg/m3) Forecast, by Application 2019 & 2032
- Table 101: Global Fluid Loss Additive Market Revenue Million Forecast, by Additive Type 2019 & 2032
- Table 102: Global Fluid Loss Additive Market Volume kg/m3 Forecast, by Additive Type 2019 & 2032
- Table 103: Global Fluid Loss Additive Market Revenue Million Forecast, by Application 2019 & 2032
- Table 104: Global Fluid Loss Additive Market Volume kg/m3 Forecast, by Application 2019 & 2032
- Table 105: Global Fluid Loss Additive Market Revenue Million Forecast, by Country 2019 & 2032
- Table 106: Global Fluid Loss Additive Market Volume kg/m3 Forecast, by Country 2019 & 2032
- Table 107: Brazil Fluid Loss Additive Market Revenue (Million) Forecast, by Application 2019 & 2032
- Table 108: Brazil Fluid Loss Additive Market Volume (kg/m3) Forecast, by Application 2019 & 2032
- Table 109: Argentina Fluid Loss Additive Market Revenue (Million) Forecast, by Application 2019 & 2032
- Table 110: Argentina Fluid Loss Additive Market Volume (kg/m3) Forecast, by Application 2019 & 2032
- Table 111: Rest of South America Fluid Loss Additive Market Revenue (Million) Forecast, by Application 2019 & 2032
- Table 112: Rest of South America Fluid Loss Additive Market Volume (kg/m3) Forecast, by Application 2019 & 2032
- Table 113: Global Fluid Loss Additive Market Revenue Million Forecast, by Additive Type 2019 & 2032
- Table 114: Global Fluid Loss Additive Market Volume kg/m3 Forecast, by Additive Type 2019 & 2032
- Table 115: Global Fluid Loss Additive Market Revenue Million Forecast, by Application 2019 & 2032
- Table 116: Global Fluid Loss Additive Market Volume kg/m3 Forecast, by Application 2019 & 2032
- Table 117: Global Fluid Loss Additive Market Revenue Million Forecast, by Country 2019 & 2032
- Table 118: Global Fluid Loss Additive Market Volume kg/m3 Forecast, by Country 2019 & 2032
- Table 119: Saudi Arabia Fluid Loss Additive Market Revenue (Million) Forecast, by Application 2019 & 2032
- Table 120: Saudi Arabia Fluid Loss Additive Market Volume (kg/m3) Forecast, by Application 2019 & 2032
- Table 121: South Africa Fluid Loss Additive Market Revenue (Million) Forecast, by Application 2019 & 2032
- Table 122: South Africa Fluid Loss Additive Market Volume (kg/m3) Forecast, by Application 2019 & 2032
- Table 123: Rest of Middle East and Africa Fluid Loss Additive Market Revenue (Million) Forecast, by Application 2019 & 2032
- Table 124: Rest of Middle East and Africa Fluid Loss Additive Market Volume (kg/m3) Forecast, by Application 2019 & 2032
Frequently Asked Questions
1. What is the projected Compound Annual Growth Rate (CAGR) of the Fluid Loss Additive Market?
The projected CAGR is approximately > 3.00%.
2. Which companies are prominent players in the Fluid Loss Additive Market?
Key companies in the market include Clariant, Nouryon, Global Drilling Fluids and Chemicals Limited, Solvay, Newpark Resources Inc, Kemira OYJ, BASF SE, Tytan Organics Pvt Ltd, Halliburton, Schlumberger Limited.
3. What are the main segments of the Fluid Loss Additive Market?
The market segments include Additive Type, Application.
4. Can you provide details about the market size?
The market size is estimated to be USD XX Million as of 2022.
5. What are some drivers contributing to market growth?
; Increase in Shale Gas Exploration; Increasing Investments in the Latest and Unconventional Drilling Technologies.
6. What are the notable trends driving market growth?
Drilling Fluid Application to Dominate the Market.
7. Are there any restraints impacting market growth?
; Growing Demand for Electric Vehicles; Harmful Impact on Environment.
8. Can you provide examples of recent developments in the market?
N/A
9. What pricing options are available for accessing the report?
Pricing options include single-user, multi-user, and enterprise licenses priced at USD 4750, USD 5250, and USD 8750 respectively.
10. Is the market size provided in terms of value or volume?
The market size is provided in terms of value, measured in Million and volume, measured in kg/m3.
11. Are there any specific market keywords associated with the report?
Yes, the market keyword associated with the report is "Fluid Loss Additive Market," which aids in identifying and referencing the specific market segment covered.
12. How do I determine which pricing option suits my needs best?
The pricing options vary based on user requirements and access needs. Individual users may opt for single-user licenses, while businesses requiring broader access may choose multi-user or enterprise licenses for cost-effective access to the report.
13. Are there any additional resources or data provided in the Fluid Loss Additive Market report?
While the report offers comprehensive insights, it's advisable to review the specific contents or supplementary materials provided to ascertain if additional resources or data are available.
14. How can I stay updated on further developments or reports in the Fluid Loss Additive Market?
To stay informed about further developments, trends, and reports in the Fluid Loss Additive Market, consider subscribing to industry newsletters, following relevant companies and organizations, or regularly checking reputable industry news sources and publications.
Methodology
Step 1 - Identification of Relevant Samples Size from Population Database


Step 2 - Approaches for Defining Global Market Size (Value, Volume* & Price*)

Note*: In applicable scenarios
Step 3 - Data Sources
Primary Research
- Web Analytics
- Survey Reports
- Research Institute
- Latest Research Reports
- Opinion Leaders
Secondary Research
- Annual Reports
- White Paper
- Latest Press Release
- Industry Association
- Paid Database
- Investor Presentations

Step 4 - Data Triangulation
Involves using different sources of information in order to increase the validity of a study
These sources are likely to be stakeholders in a program - participants, other researchers, program staff, other community members, and so on.
Then we put all data in single framework & apply various statistical tools to find out the dynamic on the market.
During the analysis stage, feedback from the stakeholder groups would be compared to determine areas of agreement as well as areas of divergence


