

Key Insights
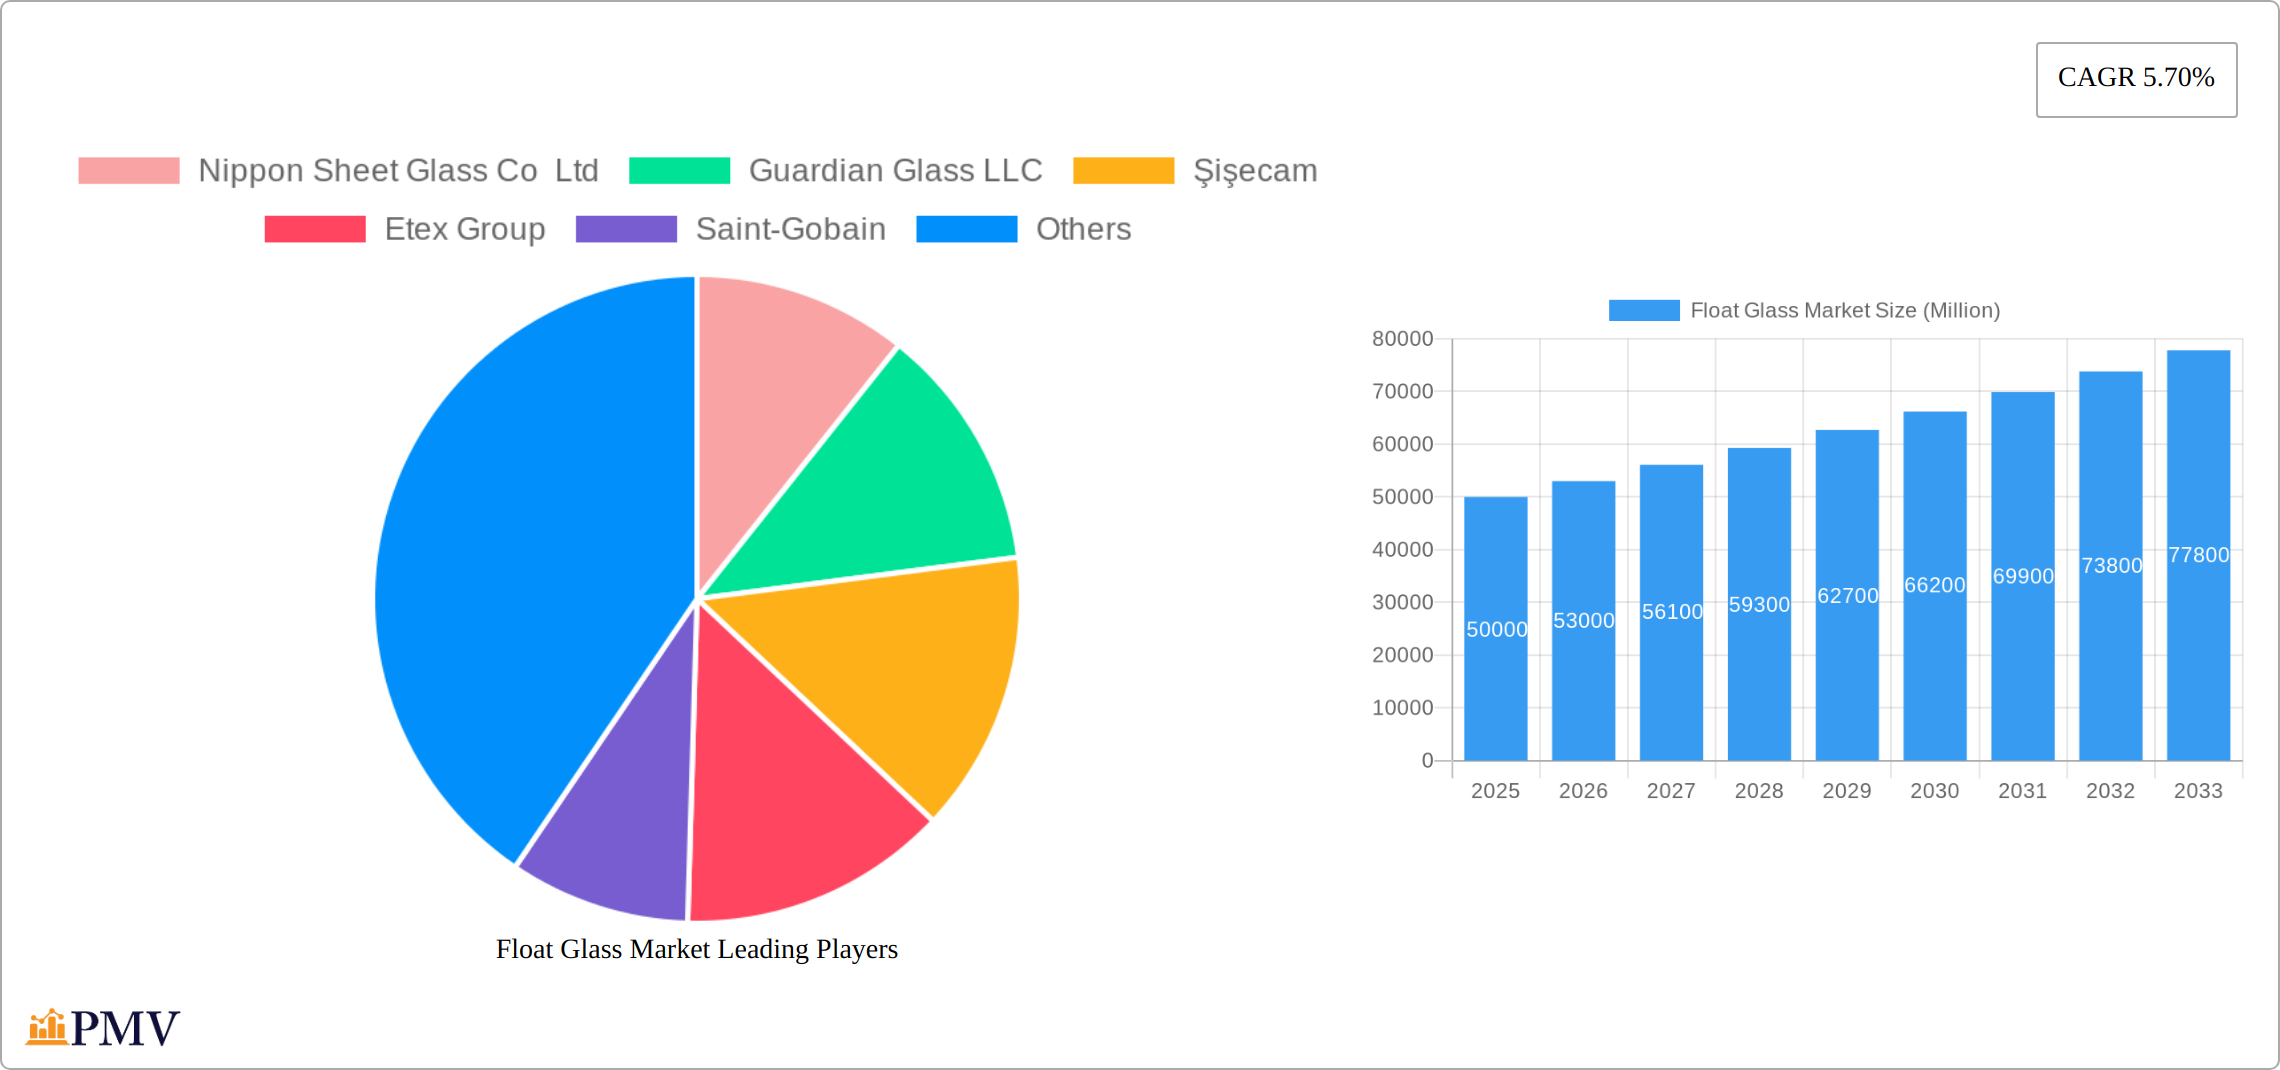
The global float glass market, projected to reach $42.7 billion by 2025, is forecast for significant expansion with a Compound Annual Growth Rate (CAGR) of 4.53% from 2025 to 2033. Key growth drivers include the booming construction sector, especially in Asia-Pacific's developing economies, fueling demand for architectural applications. The automotive industry's sustained innovation and increased production also contribute, as float glass is essential for vehicle components. The growing adoption of solar energy, leading to increased solar panel manufacturing, presents a substantial market opportunity. Furthermore, technological advancements, such as energy-efficient and self-cleaning glass, are broadening float glass applications. The market is segmented by raw materials (sand, limestone, soda ash, dolomite), type (clear, tinted, patterned, wired, extra clear), and application (building and construction, automotive, solar glass). Major industry players like Nippon Sheet Glass, Guardian Glass, Şişecam, and Saint-Gobain are driving competitive dynamics through innovation and strategic initiatives.
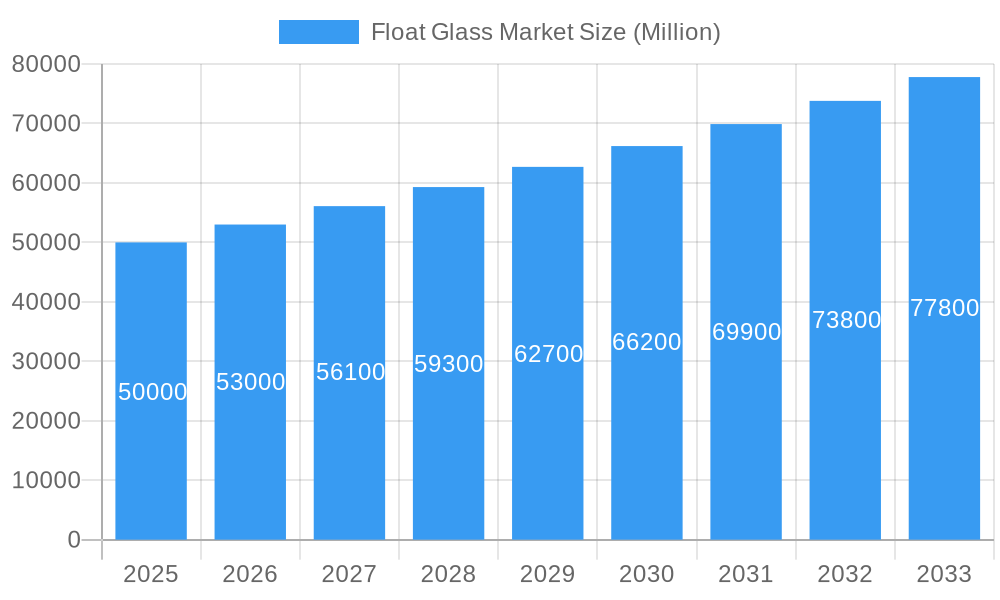
Float Glass Market Market Size (In Billion)
Market restraints include raw material price volatility, impacting production costs. Stringent environmental regulations for glass manufacturing and waste management also pose challenges. Economic slowdowns or disruptions in the construction and automotive sectors can negatively affect demand. Despite these obstacles, the long-term outlook for the float glass market remains positive, supported by ongoing urbanization, infrastructure development, and technological progress. The market's diverse applications and float glass's crucial role in various industries ensure its enduring relevance and growth. Asia-Pacific is expected to lead regional growth due to its strong construction activity and expanding manufacturing base.
Float Glass Market Company Market Share
This comprehensive report analyzes the global float glass market, offering historical data (2019-2024), base year insights (2025), and a detailed forecast (2025-2033). It provides critical intelligence for stakeholders, investors, and researchers to understand market dynamics, growth drivers, competitive landscapes, and emerging trends for informed strategic decision-making.
Float Glass Market Structure & Competitive Dynamics
The global float glass market is characterized by a moderately concentrated structure with several major players holding significant market share. The industry's competitive dynamics are shaped by factors such as economies of scale, technological advancements, and access to raw materials. Market concentration is influenced by mergers and acquisitions (M&A) activities, with larger companies strategically acquiring smaller players to expand their geographical reach and product portfolios. Innovation ecosystems play a crucial role, driving the development of new products like extra clear/low ferrous floated glass and specialized coatings. Regulatory frameworks concerning environmental regulations and safety standards significantly impact production costs and processes. Product substitutes, such as plastics and other building materials, present competitive pressure. End-user trends, particularly in the building and construction sector, heavily influence market demand. Recent M&A deals have involved significant investments, with some transactions exceeding xx Million.
- Market Concentration: The top five players account for approximately xx% of the global market share in 2025.
- M&A Activity: The past five years have seen an average of xx M&A deals annually, with a total deal value exceeding xx Million.
- Innovation Ecosystems: Focus areas include energy-efficient glass, self-cleaning glass, and smart glass technologies.
- Regulatory Frameworks: Environmental regulations regarding greenhouse gas emissions and waste management are increasingly stringent.
Float Glass Market Industry Trends & Insights
The global float glass market is experiencing a dynamic period of expansion, fueled by a confluence of robust demand from key end-use industries and significant technological advancements. The relentless growth of the construction sector, particularly in emerging economies across Asia-Pacific, the Middle East, and Africa, continues to be a primary driver, creating substantial need for both structural and aesthetic glass applications. Simultaneously, rapid urbanization and increasing disposable incomes are spurring demand for modern infrastructure and residential buildings. Technological innovations are at the forefront of market evolution, with a strong emphasis on developing glass products that offer superior energy efficiency, enhanced safety, and improved aesthetic qualities. This includes the proliferation of low-emissivity (low-E) coatings, advanced insulation solutions, and aesthetically pleasing tinted and patterned glass. Consumer preferences are increasingly aligning with sustainable and eco-friendly building materials, pushing manufacturers to innovate in areas like recycled glass content and energy-efficient production processes. The automotive industry is also a significant contributor, with a growing demand for lightweight, durable, and sophisticated glass solutions, including advanced driver-assistance systems (ADAS) integration. The solar energy sector's expansion, driven by global decarbonization efforts, is also creating a niche but rapidly growing demand for specialized solar glass. The competitive landscape is characterized by both established global players and agile new entrants, fostering innovation and driving market efficiencies. The Compound Annual Growth Rate (CAGR) is projected to be approximately 6.5% during the forecast period (2025-2033), indicating sustained and healthy growth.
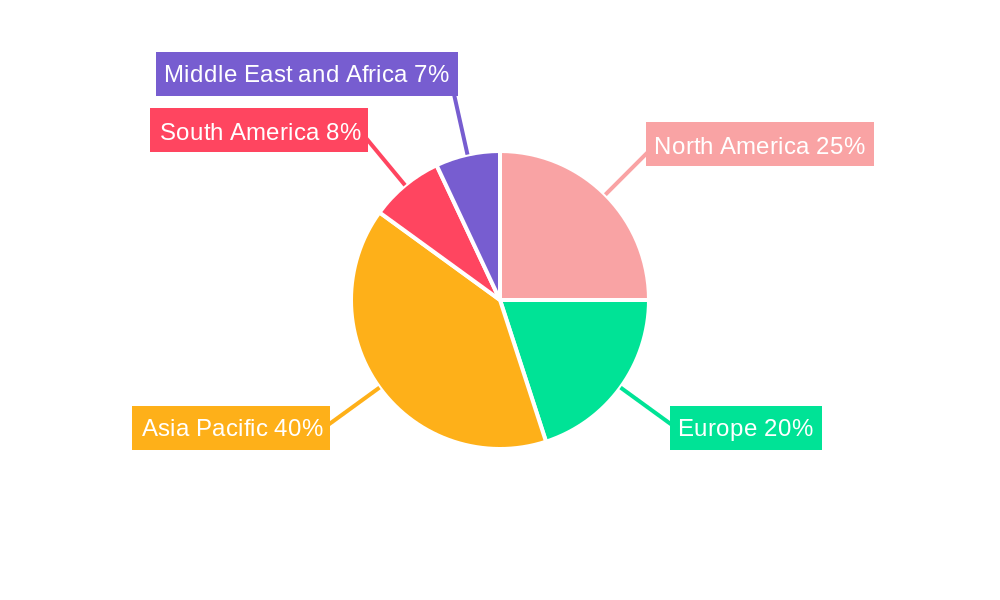
Dominant Markets & Segments in Float Glass Market
The Asia-Pacific region is expected to dominate the global float glass market throughout the forecast period. China, in particular, holds a commanding position due to its robust construction activity and expanding automotive sector.
Key Drivers by Segment:
- Raw Materials: Sand remains the dominant raw material, followed by Soda Ash and Limestone. The abundance and cost-effectiveness of these materials influence production costs.
- Type: Clear float glass maintains the largest market share, but demand for Tinted, Patterned, and Extra Clear/Low Ferrous Floated Glass is increasing.
- Application: Building and Construction remains the leading application segment, followed by Automotive and Solar Glass. Growth in these sectors directly translates to market expansion.
Dominance Analysis: The dominance of the Asia-Pacific region is primarily attributable to rapid urbanization, infrastructure development, and increasing disposable incomes driving construction projects. China's contribution to this regional dominance is substantial due to its extensive manufacturing base, favorable government policies, and massive domestic demand.
Float Glass Market Product Innovations
Product innovation in the float glass market is primarily centered on addressing critical industry needs for sustainability, performance, and advanced functionality. A significant area of development is in high-performance energy-efficient glass. This includes the widespread adoption and refinement of low-emissivity (low-E) coatings, which significantly reduce heat transfer, leading to lower energy consumption for heating and cooling in buildings. Self-cleaning glass technologies, utilizing photocatalytic and hydrophilic properties, are gaining traction, reducing maintenance requirements and enhancing aesthetic longevity. Smart glass, also known as switchable or electrochromic glass, is emerging as a key innovation, offering adjustable tinting capabilities to control light and heat transmission, thereby improving occupant comfort and reducing reliance on artificial lighting and HVAC systems. Furthermore, advancements in tempered, laminated, and security glass are enhancing safety and durability for applications in construction and automotive sectors. The development of ultra-clear and colored float glass is also expanding design possibilities for architects and designers. These innovations are not only meeting regulatory requirements for energy efficiency but also catering to a discerning consumer base that values both performance and aesthetics, thereby driving market penetration and providing competitive differentiation.
Report Segmentation & Scope
This report segments the float glass market across various parameters:
- Raw Materials: Sand, Limestone, Soda Ash, Dolomite, Other Raw Materials (Growth projections and market sizes vary significantly across these materials, reflecting their relative importance and price dynamics).
- Type: Clear, Tinted, Patterned, Wired, Extra Clear/Low Ferrous Floated Glass (Each type exhibits unique growth patterns influenced by specific applications and technological advancements).
- Application: Building and Construction, Automotive, Solar Glass, Other Applications (Market size and growth are heavily driven by construction trends, automotive production, and renewable energy adoption). Each segment offers unique opportunities and challenges for competitors.
Key Drivers of Float Glass Market Growth
The float glass market's growth is underpinned by several powerful and interconnected drivers. The most significant is the booming global construction industry, fueled by rapid urbanization, infrastructure development projects, and increasing residential and commercial building activities, especially in emerging economies. The automotive sector is another major contributor, with an escalating demand for advanced glass solutions, including those designed for enhanced safety, lightweighting, and the integration of sophisticated sensor technologies for autonomous driving. The rapidly expanding solar energy industry, driven by global commitments to renewable energy and a reduction in carbon emissions, is creating substantial demand for specialized solar glass used in photovoltaic panels. Technological advancements continue to be a critical catalyst, particularly in the development of energy-efficient glass (e.g., low-E coatings, double/triple glazing) and value-added products like self-cleaning and smart glass. Supportive government policies and initiatives aimed at promoting sustainable building practices, energy conservation, and the adoption of renewable energy sources further bolster demand. Increased consumer awareness regarding energy efficiency and aesthetic appeal in buildings also plays a vital role in driving the uptake of innovative float glass products.
Challenges in the Float Glass Market Sector
Despite its promising growth trajectory, the float glass market faces several persistent challenges that can impact its expansion and profitability. Fluctuations in the prices of key raw materials, such as silica sand, soda ash, and limestone, directly influence production costs and can lead to price volatility in the finished product. Stringent environmental regulations concerning emissions and waste management require significant investment in advanced technologies and compliance measures, adding to operational expenses. The market is highly competitive, with both established global manufacturers and emerging regional players vying for market share. This intense competition can lead to pricing pressures and squeezed profit margins. Supply chain disruptions, as highlighted by recent global events, can significantly affect the availability of raw materials and the timely delivery of finished products, leading to production delays and increased logistics costs. Furthermore, the energy-intensive nature of float glass production makes it vulnerable to energy price hikes and shifts in energy policy. Finally, the cyclical nature of the construction and automotive industries can also introduce demand variability.
Leading Players in the Float Glass Market Market
- Nippon Sheet Glass Co Ltd
- Guardian Glass LLC
- Şişecam
- Etex Group
- Saint-Gobain
- Cardinal Glass Industries Inc
- Xinyi Glass Holdings Limited
- PT Mulia Industrindo Tbk
- China Luoyang Float Glass Group Co Ltd
- Kibing Group
- China Glass Holdings Limited
- Taiwan Glass Ind Corp
- AGC Inc
- BG
- Press Glass Holding SA
- SCHOTT AG
Key Developments in Float Glass Market Sector
- January 2022: China Glass Holdings Limited (CNG) acquired the Orda float glass manufacturing facility in Kazakhstan, aiming to establish a state-of-the-art facility.
- April 2022: AGC Glass Europe partnered with E.ON for waste heat recovery and green power generation at its Seingbouse plant, promoting sustainable practices.
- September 2022: SCHOTT collaborated with Emirates Glass LLC to enhance Middle Eastern architectural designs.
Strategic Float Glass Market Outlook
The float glass market presents significant growth potential driven by urbanization, infrastructure development, and technological innovations. Strategic opportunities exist for companies investing in energy-efficient glass technologies, self-cleaning glass, and smart glass solutions. Expanding into high-growth regions and focusing on niche applications within the automotive and solar sectors will be crucial for market leadership. Companies focusing on sustainability and innovation will be best positioned for future success.
Float Glass Market Segmentation
-
1. Type
- 1.1. Clear
- 1.2. Tinted
- 1.3. Patterned
- 1.4. Wired
- 1.5. Extra Clear/Low Ferrous Floated Glass
-
2. Application
- 2.1. Building and Construction
- 2.2. Automotive
- 2.3. Solar Glass
- 2.4. Other Applications
Float Glass Market Segmentation By Geography
-
1. Asia Pacific
- 1.1. China
- 1.2. India
- 1.3. Japan
- 1.4. South Korea
- 1.5. Vietnam
- 1.6. Thailand
- 1.7. Indonesia
- 1.8. Malaysia
- 1.9. Rest of Asia Pacific
-
2. North America
- 2.1. United States
- 2.2. Canada
- 2.3. Mexico
-
3. Europe
- 3.1. Germany
- 3.2. United Kingdom
- 3.3. France
- 3.4. Italy
- 3.5. Russia
- 3.6. NORDIC
- 3.7. Turkey
- 3.8. Spain
- 3.9. Rest of Europe
-
4. South America
- 4.1. Brazil
- 4.2. Colombia
- 4.3. Argentina
- 4.4. Rest of South America
-
5. Middle East and Africa
- 5.1. Saudi Arabia
- 5.2. Nigeria
- 5.3. Qatar
- 5.4. United Arab Emirates
- 5.5. Egypt
- 5.6. South Africa
- 5.7. Rest of Middle East and Africa
Float Glass Market Regional Market Share
Geographic Coverage of Float Glass Market
Float Glass Market REPORT HIGHLIGHTS
| Aspects | Details |
|---|---|
| Study Period | 2020-2034 |
| Base Year | 2025 |
| Estimated Year | 2026 |
| Forecast Period | 2026-2034 |
| Historical Period | 2020-2025 |
| Growth Rate | CAGR of 4.53% from 2020-2034 |
| Segmentation |
|
Table of Contents
- 1. Introduction
- 1.1. Research Scope
- 1.2. Market Segmentation
- 1.3. Research Objective
- 1.4. Definitions and Assumptions
- 2. Executive Summary
- 2.1. Market Snapshot
- 3. Market Dynamics
- 3.1. Market Drivers
- 3.2. Market Restrains
- 3.3. Market Trends
- 3.4. Market Opportunities
- 4. Market Factor Analysis
- 4.1. Porters Five Forces
- 4.1.1. Bargaining Power of Suppliers
- 4.1.2. Bargaining Power of Buyers
- 4.1.3. Threat of New Entrants
- 4.1.4. Threat of Substitutes
- 4.1.5. Competitive Rivalry
- 4.2. PESTEL analysis
- 4.3. BCG Analysis
- 4.3.1. Stars (High Growth, High Market Share)
- 4.3.2. Cash Cows (Low Growth, High Market Share)
- 4.3.3. Question Mark (High Growth, Low Market Share)
- 4.3.4. Dogs (Low Growth, Low Market Share)
- 4.4. Ansoff Matrix Analysis
- 4.5. Supply Chain Analysis
- 4.6. Regulatory Landscape
- 4.7. Current Market Potential and Opportunity Assessment (TAM–SAM–SOM Framework)
- 4.8. PMV Analyst Note
- 4.1. Porters Five Forces
- 5. Market Analysis, Insights and Forecast 2021-2033
- 5.1. Market Analysis, Insights and Forecast - by Type
- 5.1.1. Clear
- 5.1.2. Tinted
- 5.1.3. Patterned
- 5.1.4. Wired
- 5.1.5. Extra Clear/Low Ferrous Floated Glass
- 5.2. Market Analysis, Insights and Forecast - by Application
- 5.2.1. Building and Construction
- 5.2.2. Automotive
- 5.2.3. Solar Glass
- 5.2.4. Other Applications
- 5.3. Market Analysis, Insights and Forecast - by Region
- 5.3.1. Asia Pacific
- 5.3.2. North America
- 5.3.3. Europe
- 5.3.4. South America
- 5.3.5. Middle East and Africa
- 5.1. Market Analysis, Insights and Forecast - by Type
- 6. Global Float Glass Market Analysis, Insights and Forecast, 2021-2033
- 6.1. Market Analysis, Insights and Forecast - by Type
- 6.1.1. Clear
- 6.1.2. Tinted
- 6.1.3. Patterned
- 6.1.4. Wired
- 6.1.5. Extra Clear/Low Ferrous Floated Glass
- 6.2. Market Analysis, Insights and Forecast - by Application
- 6.2.1. Building and Construction
- 6.2.2. Automotive
- 6.2.3. Solar Glass
- 6.2.4. Other Applications
- 6.1. Market Analysis, Insights and Forecast - by Type
- 7. Asia Pacific Float Glass Market Analysis, Insights and Forecast, 2020-2032
- 7.1. Market Analysis, Insights and Forecast - by Type
- 7.1.1. Clear
- 7.1.2. Tinted
- 7.1.3. Patterned
- 7.1.4. Wired
- 7.1.5. Extra Clear/Low Ferrous Floated Glass
- 7.2. Market Analysis, Insights and Forecast - by Application
- 7.2.1. Building and Construction
- 7.2.2. Automotive
- 7.2.3. Solar Glass
- 7.2.4. Other Applications
- 7.1. Market Analysis, Insights and Forecast - by Type
- 8. North America Float Glass Market Analysis, Insights and Forecast, 2020-2032
- 8.1. Market Analysis, Insights and Forecast - by Type
- 8.1.1. Clear
- 8.1.2. Tinted
- 8.1.3. Patterned
- 8.1.4. Wired
- 8.1.5. Extra Clear/Low Ferrous Floated Glass
- 8.2. Market Analysis, Insights and Forecast - by Application
- 8.2.1. Building and Construction
- 8.2.2. Automotive
- 8.2.3. Solar Glass
- 8.2.4. Other Applications
- 8.1. Market Analysis, Insights and Forecast - by Type
- 9. Europe Float Glass Market Analysis, Insights and Forecast, 2020-2032
- 9.1. Market Analysis, Insights and Forecast - by Type
- 9.1.1. Clear
- 9.1.2. Tinted
- 9.1.3. Patterned
- 9.1.4. Wired
- 9.1.5. Extra Clear/Low Ferrous Floated Glass
- 9.2. Market Analysis, Insights and Forecast - by Application
- 9.2.1. Building and Construction
- 9.2.2. Automotive
- 9.2.3. Solar Glass
- 9.2.4. Other Applications
- 9.1. Market Analysis, Insights and Forecast - by Type
- 10. South America Float Glass Market Analysis, Insights and Forecast, 2020-2032
- 10.1. Market Analysis, Insights and Forecast - by Type
- 10.1.1. Clear
- 10.1.2. Tinted
- 10.1.3. Patterned
- 10.1.4. Wired
- 10.1.5. Extra Clear/Low Ferrous Floated Glass
- 10.2. Market Analysis, Insights and Forecast - by Application
- 10.2.1. Building and Construction
- 10.2.2. Automotive
- 10.2.3. Solar Glass
- 10.2.4. Other Applications
- 10.1. Market Analysis, Insights and Forecast - by Type
- 11. Middle East and Africa Float Glass Market Analysis, Insights and Forecast, 2020-2032
- 11.1. Market Analysis, Insights and Forecast - by Type
- 11.1.1. Clear
- 11.1.2. Tinted
- 11.1.3. Patterned
- 11.1.4. Wired
- 11.1.5. Extra Clear/Low Ferrous Floated Glass
- 11.2. Market Analysis, Insights and Forecast - by Application
- 11.2.1. Building and Construction
- 11.2.2. Automotive
- 11.2.3. Solar Glass
- 11.2.4. Other Applications
- 11.1. Market Analysis, Insights and Forecast - by Type
- 12. Competitive Analysis
- 12.1. Company Profiles
- 12.1.1 Nippon Sheet Glass Co Ltd
- 12.1.1.1. Company Overview
- 12.1.1.2. Products
- 12.1.1.3. Company Financials
- 12.1.1.4. SWOT Analysis
- 12.1.2 Guardian Glass LLC
- 12.1.2.1. Company Overview
- 12.1.2.2. Products
- 12.1.2.3. Company Financials
- 12.1.2.4. SWOT Analysis
- 12.1.3 Şişecam
- 12.1.3.1. Company Overview
- 12.1.3.2. Products
- 12.1.3.3. Company Financials
- 12.1.3.4. SWOT Analysis
- 12.1.4 Etex Group
- 12.1.4.1. Company Overview
- 12.1.4.2. Products
- 12.1.4.3. Company Financials
- 12.1.4.4. SWOT Analysis
- 12.1.5 Saint-Gobain
- 12.1.5.1. Company Overview
- 12.1.5.2. Products
- 12.1.5.3. Company Financials
- 12.1.5.4. SWOT Analysis
- 12.1.6 Cardinal Glass Industries Inc
- 12.1.6.1. Company Overview
- 12.1.6.2. Products
- 12.1.6.3. Company Financials
- 12.1.6.4. SWOT Analysis
- 12.1.7 Xinyi Glass Holdings Limited*List Not Exhaustive
- 12.1.7.1. Company Overview
- 12.1.7.2. Products
- 12.1.7.3. Company Financials
- 12.1.7.4. SWOT Analysis
- 12.1.8 PT Mulia Industrindo Tbk
- 12.1.8.1. Company Overview
- 12.1.8.2. Products
- 12.1.8.3. Company Financials
- 12.1.8.4. SWOT Analysis
- 12.1.9 China Luoyang Float Glass Group Co Ltd
- 12.1.9.1. Company Overview
- 12.1.9.2. Products
- 12.1.9.3. Company Financials
- 12.1.9.4. SWOT Analysis
- 12.1.10 Kibing Group
- 12.1.10.1. Company Overview
- 12.1.10.2. Products
- 12.1.10.3. Company Financials
- 12.1.10.4. SWOT Analysis
- 12.1.11 China Glass Holdings Limited
- 12.1.11.1. Company Overview
- 12.1.11.2. Products
- 12.1.11.3. Company Financials
- 12.1.11.4. SWOT Analysis
- 12.1.12 Taiwan Glass Ind Corp
- 12.1.12.1. Company Overview
- 12.1.12.2. Products
- 12.1.12.3. Company Financials
- 12.1.12.4. SWOT Analysis
- 12.1.13 AGC Inc
- 12.1.13.1. Company Overview
- 12.1.13.2. Products
- 12.1.13.3. Company Financials
- 12.1.13.4. SWOT Analysis
- 12.1.14 BG
- 12.1.14.1. Company Overview
- 12.1.14.2. Products
- 12.1.14.3. Company Financials
- 12.1.14.4. SWOT Analysis
- 12.1.15 Press Glass Holding SA
- 12.1.15.1. Company Overview
- 12.1.15.2. Products
- 12.1.15.3. Company Financials
- 12.1.15.4. SWOT Analysis
- 12.1.16 SCHOTT AG
- 12.1.16.1. Company Overview
- 12.1.16.2. Products
- 12.1.16.3. Company Financials
- 12.1.16.4. SWOT Analysis
- 12.1.1 Nippon Sheet Glass Co Ltd
- 12.2. Market Entropy
- 12.2.1 Company's Key Areas Served
- 12.2.2 Recent Developments
- 12.3. Company Market Share Analysis 2025
- 12.3.1 Top 5 Companies Market Share Analysis
- 12.3.2 Top 3 Companies Market Share Analysis
- 12.4. List of Potential Customers
- 13. Research Methodology
List of Figures
- Figure 1: Global Float Glass Market Revenue Breakdown (billion, %) by Region 2025 & 2033
- Figure 2: Global Float Glass Market Volume Breakdown (Million, %) by Region 2025 & 2033
- Figure 3: Asia Pacific Float Glass Market Revenue (billion), by Type 2025 & 2033
- Figure 4: Asia Pacific Float Glass Market Volume (Million), by Type 2025 & 2033
- Figure 5: Asia Pacific Float Glass Market Revenue Share (%), by Type 2025 & 2033
- Figure 6: Asia Pacific Float Glass Market Volume Share (%), by Type 2025 & 2033
- Figure 7: Asia Pacific Float Glass Market Revenue (billion), by Application 2025 & 2033
- Figure 8: Asia Pacific Float Glass Market Volume (Million), by Application 2025 & 2033
- Figure 9: Asia Pacific Float Glass Market Revenue Share (%), by Application 2025 & 2033
- Figure 10: Asia Pacific Float Glass Market Volume Share (%), by Application 2025 & 2033
- Figure 11: Asia Pacific Float Glass Market Revenue (billion), by Country 2025 & 2033
- Figure 12: Asia Pacific Float Glass Market Volume (Million), by Country 2025 & 2033
- Figure 13: Asia Pacific Float Glass Market Revenue Share (%), by Country 2025 & 2033
- Figure 14: Asia Pacific Float Glass Market Volume Share (%), by Country 2025 & 2033
- Figure 15: North America Float Glass Market Revenue (billion), by Type 2025 & 2033
- Figure 16: North America Float Glass Market Volume (Million), by Type 2025 & 2033
- Figure 17: North America Float Glass Market Revenue Share (%), by Type 2025 & 2033
- Figure 18: North America Float Glass Market Volume Share (%), by Type 2025 & 2033
- Figure 19: North America Float Glass Market Revenue (billion), by Application 2025 & 2033
- Figure 20: North America Float Glass Market Volume (Million), by Application 2025 & 2033
- Figure 21: North America Float Glass Market Revenue Share (%), by Application 2025 & 2033
- Figure 22: North America Float Glass Market Volume Share (%), by Application 2025 & 2033
- Figure 23: North America Float Glass Market Revenue (billion), by Country 2025 & 2033
- Figure 24: North America Float Glass Market Volume (Million), by Country 2025 & 2033
- Figure 25: North America Float Glass Market Revenue Share (%), by Country 2025 & 2033
- Figure 26: North America Float Glass Market Volume Share (%), by Country 2025 & 2033
- Figure 27: Europe Float Glass Market Revenue (billion), by Type 2025 & 2033
- Figure 28: Europe Float Glass Market Volume (Million), by Type 2025 & 2033
- Figure 29: Europe Float Glass Market Revenue Share (%), by Type 2025 & 2033
- Figure 30: Europe Float Glass Market Volume Share (%), by Type 2025 & 2033
- Figure 31: Europe Float Glass Market Revenue (billion), by Application 2025 & 2033
- Figure 32: Europe Float Glass Market Volume (Million), by Application 2025 & 2033
- Figure 33: Europe Float Glass Market Revenue Share (%), by Application 2025 & 2033
- Figure 34: Europe Float Glass Market Volume Share (%), by Application 2025 & 2033
- Figure 35: Europe Float Glass Market Revenue (billion), by Country 2025 & 2033
- Figure 36: Europe Float Glass Market Volume (Million), by Country 2025 & 2033
- Figure 37: Europe Float Glass Market Revenue Share (%), by Country 2025 & 2033
- Figure 38: Europe Float Glass Market Volume Share (%), by Country 2025 & 2033
- Figure 39: South America Float Glass Market Revenue (billion), by Type 2025 & 2033
- Figure 40: South America Float Glass Market Volume (Million), by Type 2025 & 2033
- Figure 41: South America Float Glass Market Revenue Share (%), by Type 2025 & 2033
- Figure 42: South America Float Glass Market Volume Share (%), by Type 2025 & 2033
- Figure 43: South America Float Glass Market Revenue (billion), by Application 2025 & 2033
- Figure 44: South America Float Glass Market Volume (Million), by Application 2025 & 2033
- Figure 45: South America Float Glass Market Revenue Share (%), by Application 2025 & 2033
- Figure 46: South America Float Glass Market Volume Share (%), by Application 2025 & 2033
- Figure 47: South America Float Glass Market Revenue (billion), by Country 2025 & 2033
- Figure 48: South America Float Glass Market Volume (Million), by Country 2025 & 2033
- Figure 49: South America Float Glass Market Revenue Share (%), by Country 2025 & 2033
- Figure 50: South America Float Glass Market Volume Share (%), by Country 2025 & 2033
- Figure 51: Middle East and Africa Float Glass Market Revenue (billion), by Type 2025 & 2033
- Figure 52: Middle East and Africa Float Glass Market Volume (Million), by Type 2025 & 2033
- Figure 53: Middle East and Africa Float Glass Market Revenue Share (%), by Type 2025 & 2033
- Figure 54: Middle East and Africa Float Glass Market Volume Share (%), by Type 2025 & 2033
- Figure 55: Middle East and Africa Float Glass Market Revenue (billion), by Application 2025 & 2033
- Figure 56: Middle East and Africa Float Glass Market Volume (Million), by Application 2025 & 2033
- Figure 57: Middle East and Africa Float Glass Market Revenue Share (%), by Application 2025 & 2033
- Figure 58: Middle East and Africa Float Glass Market Volume Share (%), by Application 2025 & 2033
- Figure 59: Middle East and Africa Float Glass Market Revenue (billion), by Country 2025 & 2033
- Figure 60: Middle East and Africa Float Glass Market Volume (Million), by Country 2025 & 2033
- Figure 61: Middle East and Africa Float Glass Market Revenue Share (%), by Country 2025 & 2033
- Figure 62: Middle East and Africa Float Glass Market Volume Share (%), by Country 2025 & 2033
List of Tables
- Table 1: Global Float Glass Market Revenue billion Forecast, by Type 2020 & 2033
- Table 2: Global Float Glass Market Volume Million Forecast, by Type 2020 & 2033
- Table 3: Global Float Glass Market Revenue billion Forecast, by Application 2020 & 2033
- Table 4: Global Float Glass Market Volume Million Forecast, by Application 2020 & 2033
- Table 5: Global Float Glass Market Revenue billion Forecast, by Region 2020 & 2033
- Table 6: Global Float Glass Market Volume Million Forecast, by Region 2020 & 2033
- Table 7: Global Float Glass Market Revenue billion Forecast, by Type 2020 & 2033
- Table 8: Global Float Glass Market Volume Million Forecast, by Type 2020 & 2033
- Table 9: Global Float Glass Market Revenue billion Forecast, by Application 2020 & 2033
- Table 10: Global Float Glass Market Volume Million Forecast, by Application 2020 & 2033
- Table 11: Global Float Glass Market Revenue billion Forecast, by Country 2020 & 2033
- Table 12: Global Float Glass Market Volume Million Forecast, by Country 2020 & 2033
- Table 13: China Float Glass Market Revenue (billion) Forecast, by Application 2020 & 2033
- Table 14: China Float Glass Market Volume (Million) Forecast, by Application 2020 & 2033
- Table 15: India Float Glass Market Revenue (billion) Forecast, by Application 2020 & 2033
- Table 16: India Float Glass Market Volume (Million) Forecast, by Application 2020 & 2033
- Table 17: Japan Float Glass Market Revenue (billion) Forecast, by Application 2020 & 2033
- Table 18: Japan Float Glass Market Volume (Million) Forecast, by Application 2020 & 2033
- Table 19: South Korea Float Glass Market Revenue (billion) Forecast, by Application 2020 & 2033
- Table 20: South Korea Float Glass Market Volume (Million) Forecast, by Application 2020 & 2033
- Table 21: Vietnam Float Glass Market Revenue (billion) Forecast, by Application 2020 & 2033
- Table 22: Vietnam Float Glass Market Volume (Million) Forecast, by Application 2020 & 2033
- Table 23: Thailand Float Glass Market Revenue (billion) Forecast, by Application 2020 & 2033
- Table 24: Thailand Float Glass Market Volume (Million) Forecast, by Application 2020 & 2033
- Table 25: Indonesia Float Glass Market Revenue (billion) Forecast, by Application 2020 & 2033
- Table 26: Indonesia Float Glass Market Volume (Million) Forecast, by Application 2020 & 2033
- Table 27: Malaysia Float Glass Market Revenue (billion) Forecast, by Application 2020 & 2033
- Table 28: Malaysia Float Glass Market Volume (Million) Forecast, by Application 2020 & 2033
- Table 29: Rest of Asia Pacific Float Glass Market Revenue (billion) Forecast, by Application 2020 & 2033
- Table 30: Rest of Asia Pacific Float Glass Market Volume (Million) Forecast, by Application 2020 & 2033
- Table 31: Global Float Glass Market Revenue billion Forecast, by Type 2020 & 2033
- Table 32: Global Float Glass Market Volume Million Forecast, by Type 2020 & 2033
- Table 33: Global Float Glass Market Revenue billion Forecast, by Application 2020 & 2033
- Table 34: Global Float Glass Market Volume Million Forecast, by Application 2020 & 2033
- Table 35: Global Float Glass Market Revenue billion Forecast, by Country 2020 & 2033
- Table 36: Global Float Glass Market Volume Million Forecast, by Country 2020 & 2033
- Table 37: United States Float Glass Market Revenue (billion) Forecast, by Application 2020 & 2033
- Table 38: United States Float Glass Market Volume (Million) Forecast, by Application 2020 & 2033
- Table 39: Canada Float Glass Market Revenue (billion) Forecast, by Application 2020 & 2033
- Table 40: Canada Float Glass Market Volume (Million) Forecast, by Application 2020 & 2033
- Table 41: Mexico Float Glass Market Revenue (billion) Forecast, by Application 2020 & 2033
- Table 42: Mexico Float Glass Market Volume (Million) Forecast, by Application 2020 & 2033
- Table 43: Global Float Glass Market Revenue billion Forecast, by Type 2020 & 2033
- Table 44: Global Float Glass Market Volume Million Forecast, by Type 2020 & 2033
- Table 45: Global Float Glass Market Revenue billion Forecast, by Application 2020 & 2033
- Table 46: Global Float Glass Market Volume Million Forecast, by Application 2020 & 2033
- Table 47: Global Float Glass Market Revenue billion Forecast, by Country 2020 & 2033
- Table 48: Global Float Glass Market Volume Million Forecast, by Country 2020 & 2033
- Table 49: Germany Float Glass Market Revenue (billion) Forecast, by Application 2020 & 2033
- Table 50: Germany Float Glass Market Volume (Million) Forecast, by Application 2020 & 2033
- Table 51: United Kingdom Float Glass Market Revenue (billion) Forecast, by Application 2020 & 2033
- Table 52: United Kingdom Float Glass Market Volume (Million) Forecast, by Application 2020 & 2033
- Table 53: France Float Glass Market Revenue (billion) Forecast, by Application 2020 & 2033
- Table 54: France Float Glass Market Volume (Million) Forecast, by Application 2020 & 2033
- Table 55: Italy Float Glass Market Revenue (billion) Forecast, by Application 2020 & 2033
- Table 56: Italy Float Glass Market Volume (Million) Forecast, by Application 2020 & 2033
- Table 57: Russia Float Glass Market Revenue (billion) Forecast, by Application 2020 & 2033
- Table 58: Russia Float Glass Market Volume (Million) Forecast, by Application 2020 & 2033
- Table 59: NORDIC Float Glass Market Revenue (billion) Forecast, by Application 2020 & 2033
- Table 60: NORDIC Float Glass Market Volume (Million) Forecast, by Application 2020 & 2033
- Table 61: Turkey Float Glass Market Revenue (billion) Forecast, by Application 2020 & 2033
- Table 62: Turkey Float Glass Market Volume (Million) Forecast, by Application 2020 & 2033
- Table 63: Spain Float Glass Market Revenue (billion) Forecast, by Application 2020 & 2033
- Table 64: Spain Float Glass Market Volume (Million) Forecast, by Application 2020 & 2033
- Table 65: Rest of Europe Float Glass Market Revenue (billion) Forecast, by Application 2020 & 2033
- Table 66: Rest of Europe Float Glass Market Volume (Million) Forecast, by Application 2020 & 2033
- Table 67: Global Float Glass Market Revenue billion Forecast, by Type 2020 & 2033
- Table 68: Global Float Glass Market Volume Million Forecast, by Type 2020 & 2033
- Table 69: Global Float Glass Market Revenue billion Forecast, by Application 2020 & 2033
- Table 70: Global Float Glass Market Volume Million Forecast, by Application 2020 & 2033
- Table 71: Global Float Glass Market Revenue billion Forecast, by Country 2020 & 2033
- Table 72: Global Float Glass Market Volume Million Forecast, by Country 2020 & 2033
- Table 73: Brazil Float Glass Market Revenue (billion) Forecast, by Application 2020 & 2033
- Table 74: Brazil Float Glass Market Volume (Million) Forecast, by Application 2020 & 2033
- Table 75: Colombia Float Glass Market Revenue (billion) Forecast, by Application 2020 & 2033
- Table 76: Colombia Float Glass Market Volume (Million) Forecast, by Application 2020 & 2033
- Table 77: Argentina Float Glass Market Revenue (billion) Forecast, by Application 2020 & 2033
- Table 78: Argentina Float Glass Market Volume (Million) Forecast, by Application 2020 & 2033
- Table 79: Rest of South America Float Glass Market Revenue (billion) Forecast, by Application 2020 & 2033
- Table 80: Rest of South America Float Glass Market Volume (Million) Forecast, by Application 2020 & 2033
- Table 81: Global Float Glass Market Revenue billion Forecast, by Type 2020 & 2033
- Table 82: Global Float Glass Market Volume Million Forecast, by Type 2020 & 2033
- Table 83: Global Float Glass Market Revenue billion Forecast, by Application 2020 & 2033
- Table 84: Global Float Glass Market Volume Million Forecast, by Application 2020 & 2033
- Table 85: Global Float Glass Market Revenue billion Forecast, by Country 2020 & 2033
- Table 86: Global Float Glass Market Volume Million Forecast, by Country 2020 & 2033
- Table 87: Saudi Arabia Float Glass Market Revenue (billion) Forecast, by Application 2020 & 2033
- Table 88: Saudi Arabia Float Glass Market Volume (Million) Forecast, by Application 2020 & 2033
- Table 89: Nigeria Float Glass Market Revenue (billion) Forecast, by Application 2020 & 2033
- Table 90: Nigeria Float Glass Market Volume (Million) Forecast, by Application 2020 & 2033
- Table 91: Qatar Float Glass Market Revenue (billion) Forecast, by Application 2020 & 2033
- Table 92: Qatar Float Glass Market Volume (Million) Forecast, by Application 2020 & 2033
- Table 93: United Arab Emirates Float Glass Market Revenue (billion) Forecast, by Application 2020 & 2033
- Table 94: United Arab Emirates Float Glass Market Volume (Million) Forecast, by Application 2020 & 2033
- Table 95: Egypt Float Glass Market Revenue (billion) Forecast, by Application 2020 & 2033
- Table 96: Egypt Float Glass Market Volume (Million) Forecast, by Application 2020 & 2033
- Table 97: South Africa Float Glass Market Revenue (billion) Forecast, by Application 2020 & 2033
- Table 98: South Africa Float Glass Market Volume (Million) Forecast, by Application 2020 & 2033
- Table 99: Rest of Middle East and Africa Float Glass Market Revenue (billion) Forecast, by Application 2020 & 2033
- Table 100: Rest of Middle East and Africa Float Glass Market Volume (Million) Forecast, by Application 2020 & 2033
Frequently Asked Questions
1. What is the projected Compound Annual Growth Rate (CAGR) of the Float Glass Market?
The projected CAGR is approximately 4.53%.
2. Which companies are prominent players in the Float Glass Market?
Key companies in the market include Nippon Sheet Glass Co Ltd, Guardian Glass LLC, Şişecam, Etex Group, Saint-Gobain, Cardinal Glass Industries Inc, Xinyi Glass Holdings Limited*List Not Exhaustive, PT Mulia Industrindo Tbk, China Luoyang Float Glass Group Co Ltd, Kibing Group, China Glass Holdings Limited, Taiwan Glass Ind Corp, AGC Inc, BG, Press Glass Holding SA, SCHOTT AG.
3. What are the main segments of the Float Glass Market?
The market segments include Type, Application.
4. Can you provide details about the market size?
The market size is estimated to be USD 42.7 billion as of 2022.
5. What are some drivers contributing to market growth?
Increasing Demand from the Construction Industry; Recovering Automotive Industry.
6. What are the notable trends driving market growth?
Increasing Demand from Building and Construction Segments.
7. Are there any restraints impacting market growth?
; Unfavorable Conditions Arising Due to COVID-19 Outbreak; High Manufacturing Costs.
8. Can you provide examples of recent developments in the market?
September 2022: SCHOTT partnered with Emirates Glass LLC, one of the leading processors of architectural flat glass in the Middle East, to lift up Middle Eastern architecture.
9. What pricing options are available for accessing the report?
Pricing options include single-user, multi-user, and enterprise licenses priced at USD 4750, USD 5250, and USD 8750 respectively.
10. Is the market size provided in terms of value or volume?
The market size is provided in terms of value, measured in billion and volume, measured in Million.
11. Are there any specific market keywords associated with the report?
Yes, the market keyword associated with the report is "Float Glass Market," which aids in identifying and referencing the specific market segment covered.
12. How do I determine which pricing option suits my needs best?
The pricing options vary based on user requirements and access needs. Individual users may opt for single-user licenses, while businesses requiring broader access may choose multi-user or enterprise licenses for cost-effective access to the report.
13. Are there any additional resources or data provided in the Float Glass Market report?
While the report offers comprehensive insights, it's advisable to review the specific contents or supplementary materials provided to ascertain if additional resources or data are available.
14. How can I stay updated on further developments or reports in the Float Glass Market?
To stay informed about further developments, trends, and reports in the Float Glass Market, consider subscribing to industry newsletters, following relevant companies and organizations, or regularly checking reputable industry news sources and publications.
Methodology
Step 1 - Identification of Relevant Samples Size from Population Database


Step 2 - Approaches for Defining Global Market Size (Value, Volume* & Price*)

Note*: In applicable scenarios
Step 3 - Data Sources
Primary Research
- Web Analytics
- Survey Reports
- Research Institute
- Latest Research Reports
- Opinion Leaders
Secondary Research
- Annual Reports
- White Paper
- Latest Press Release
- Industry Association
- Paid Database
- Investor Presentations

Step 4 - Data Triangulation
Involves using different sources of information in order to increase the validity of a study
These sources are likely to be stakeholders in a program - participants, other researchers, program staff, other community members, and so on.
Then we put all data in single framework & apply various statistical tools to find out the dynamic on the market.
During the analysis stage, feedback from the stakeholder groups would be compared to determine areas of agreement as well as areas of divergence