
Key Insights
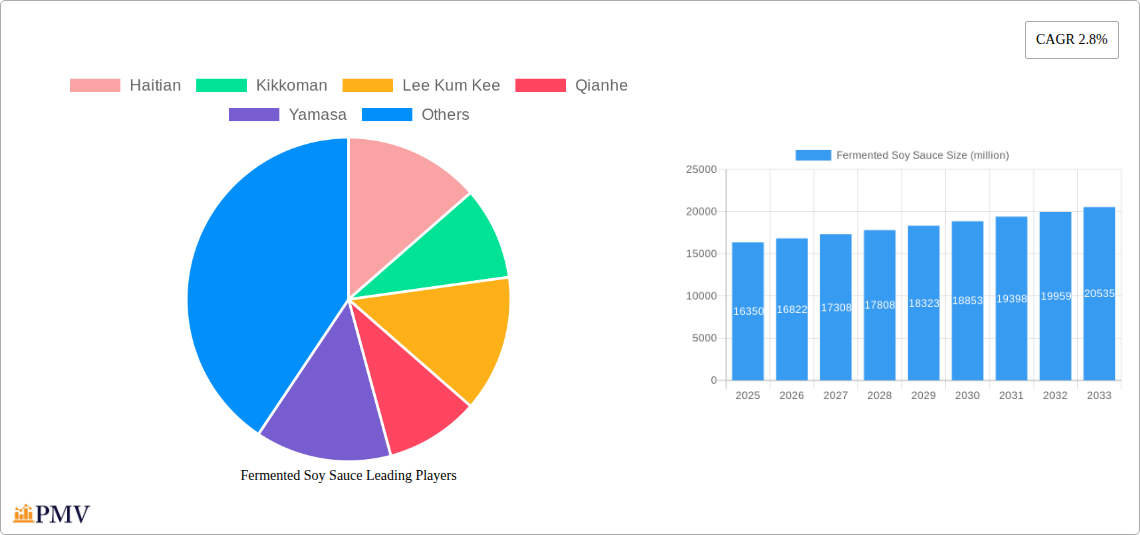
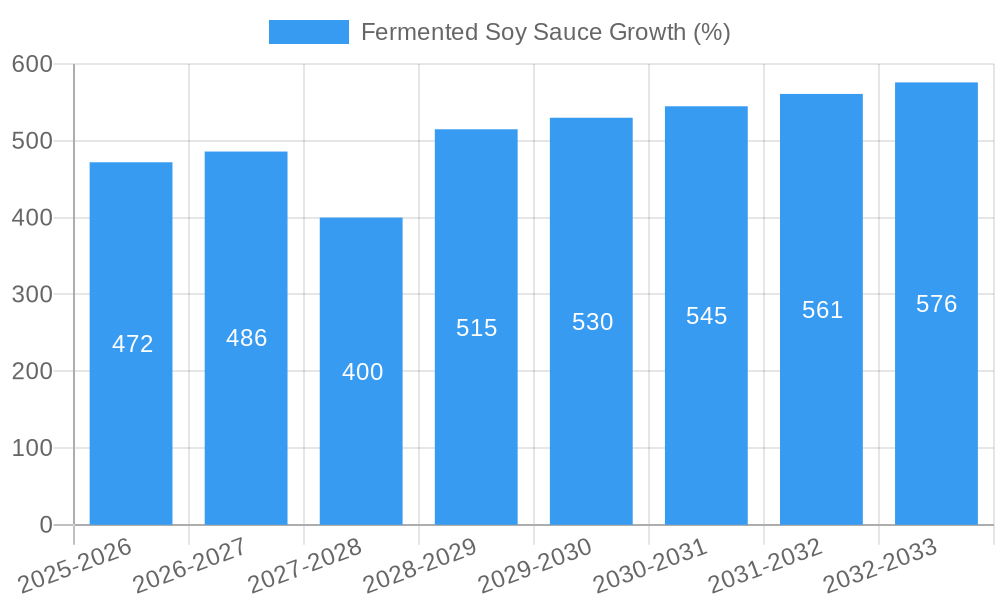
The global fermented soy sauce market, valued at approximately $16.35 billion in 2025, is projected to experience steady growth, exhibiting a compound annual growth rate (CAGR) of 2.8% from 2025 to 2033. This growth is driven by several factors. Increasing consumer demand for healthier and more flavorful food options fuels the market's expansion. The versatility of soy sauce, its use in diverse cuisines worldwide, and its role as a fundamental ingredient in numerous dishes contribute significantly to its sustained popularity. Furthermore, the growing adoption of Asian culinary traditions globally, coupled with the rising popularity of Asian fusion cuisine, positively impacts market demand. The premiumization trend within the food and beverage industry also presents opportunities for producers to offer higher-priced, specialty soy sauces with unique flavors and production methods, thereby boosting market value. While the market is robust, potential challenges such as fluctuations in raw material costs (soybeans and wheat) and increasing competition from other condiments could exert some pressure on profit margins. However, the overall outlook remains positive, fueled by consistent demand and innovative product development within the sector.
The competitive landscape is marked by a mix of established global players like Kikkoman and Lee Kum Kee, alongside regional brands like Haitian and Qianhe. These companies employ diverse strategies to maintain their market share, including product diversification, strategic partnerships, and expansion into new geographical markets. The market witnesses ongoing innovation, with manufacturers introducing organic, low-sodium, and flavored soy sauce variations to cater to evolving consumer preferences and health consciousness. The growing awareness of the health benefits associated with fermented foods further strengthens the market's position, as consumers actively seek products with probiotic properties. The market's future growth is expected to be primarily driven by continuous product innovation, targeted marketing campaigns, and expansion into emerging markets with growing purchasing power and interest in global cuisines.
Fermented Soy Sauce Market Report: A Comprehensive Analysis (2019-2033)
This comprehensive report provides an in-depth analysis of the global fermented soy sauce market, offering valuable insights for industry stakeholders, investors, and businesses seeking to understand this dynamic sector. The study period spans from 2019 to 2033, with 2025 serving as the base and estimated year. The forecast period covers 2025-2033, while the historical period encompasses 2019-2024. The report analyzes key market trends, competitive dynamics, and growth opportunities, encompassing a market valued at approximately $XX million in 2025, projected to reach $XX million by 2033, exhibiting a CAGR of XX%.
Fermented Soy Sauce Market Structure & Competitive Dynamics
The global fermented soy sauce market is characterized by a mix of established players and emerging regional brands. Market concentration is moderate, with several key players holding significant market share. Kikkoman, Lee Kum Kee, and Haitian dominate the global landscape, holding a combined market share of approximately XX%. Other significant players include Qianhe, Yamasa, and Maggi. The innovation ecosystem is robust, with ongoing research into new production methods, flavors, and packaging. Regulatory frameworks vary across regions, impacting production costs and market access. Product substitutes, such as fish sauce and tamari, exist but represent a smaller market share. End-user trends are shifting towards healthier options and convenient packaging, driving innovation in product formulations and sizes. M&A activity has been relatively moderate in recent years, with a few notable deals valued at approximately $XX million in total during the historical period. Key acquisitions focused on expanding regional presence and product portfolios.
- Market Concentration: Moderate, with top 5 players holding approximately XX% market share.
- Innovation: Focus on improved production efficiency, novel flavors, and sustainable packaging.
- Regulatory Frameworks: Vary across geographies, impacting production costs and market access.
- Substitutes: Fish sauce, tamari, and other condiments compete for market share, but to a lesser extent.
- M&A Activity: Limited but notable deals observed, totaling approximately $XX million during 2019-2024.
Fermented Soy Sauce Industry Trends & Insights
The fermented soy sauce market is experiencing robust growth, driven by several factors. Rising disposable incomes in developing economies and growing demand for Asian cuisine globally are major growth drivers. The market is also benefiting from increasing health consciousness, with consumers seeking low-sodium and organic options. Technological advancements in production processes are enhancing efficiency and reducing costs. However, fluctuating raw material prices and intense competition pose challenges. The market penetration of premium soy sauces is increasing, driven by consumer willingness to pay more for superior quality and unique flavors. The CAGR during the forecast period is projected to be XX%, exceeding the global average for condiment markets. Consumer preferences are shifting towards organic, gluten-free, and reduced-sodium varieties.
Dominant Markets & Segments in Fermented Soy Sauce
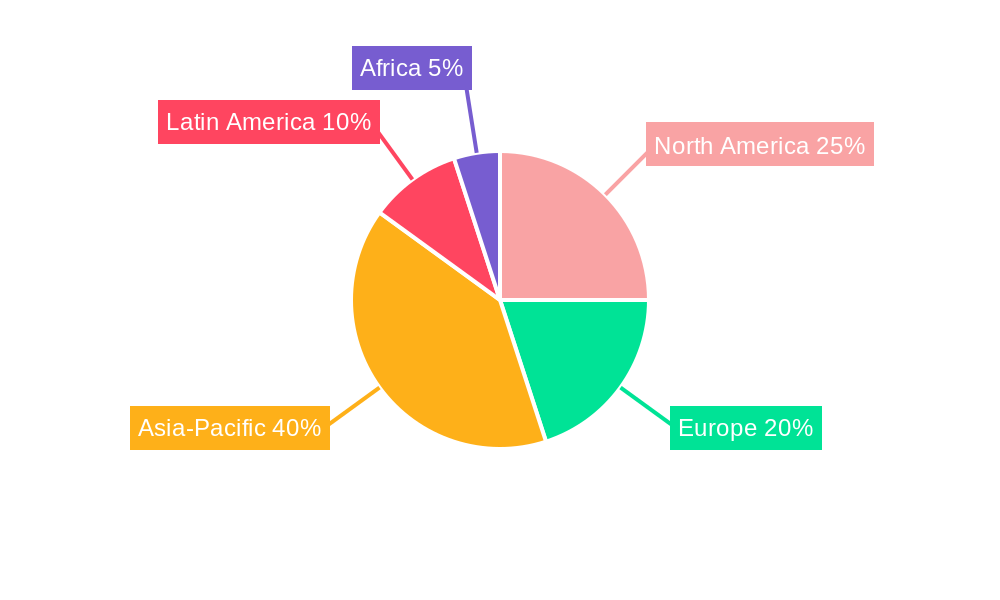
The Asia-Pacific region dominates the global fermented soy sauce market, accounting for approximately XX% of global sales. China and Japan represent the largest national markets, fueled by strong local consumption and robust food processing industries. Key drivers for dominance include:
- Established consumer base: High per capita consumption in several Asian countries.
- Extensive distribution networks: Well-developed infrastructure enabling widespread product availability.
- Favorable economic conditions: Rising disposable incomes boosting demand for premium products.
- Strong culinary tradition: Soy sauce is a staple ingredient in many Asian dishes.
The dominance of the Asia-Pacific region is expected to continue throughout the forecast period. However, growth in other regions, particularly North America and Europe, is expected to accelerate driven by increased exposure to Asian cuisine and changing consumer preferences.
Fermented Soy Sauce Product Innovations
Recent product innovations focus on healthier formulations, such as low-sodium and organic soy sauces. Convenience is another key driver, with the introduction of single-serve packages and ready-to-use blends. Technological advancements in fermentation processes are resulting in improved flavor profiles and extended shelf life. These innovations enhance product differentiation and cater to evolving consumer preferences.
Report Segmentation & Scope
This report segments the fermented soy sauce market by type (naturally brewed, chemically brewed), packaging (bottles, pouches, cans), distribution channel (supermarkets, online retail, food service), and geography. Each segment provides insights into market size, growth projections, and competitive landscape. Detailed breakdowns of each segment's market share, growth rate, and key players are included.
Key Drivers of Fermented Soy Sauce Growth
Several factors are driving the growth of the fermented soy sauce market: rising disposable incomes globally, particularly in developing economies, increasing demand for Asian cuisine, and the growing popularity of health-conscious and convenient food products. Moreover, technological advancements in production processes, allowing for efficient and cost-effective manufacturing, contribute to the market's expansion.
Challenges in the Fermented Soy Sauce Sector
The fermented soy sauce sector faces several challenges, including fluctuating raw material prices (soybeans, wheat), increased competition from substitute products, and stringent regulatory requirements regarding food safety and labeling. These factors can impact profitability and market entry barriers. Supply chain disruptions can also significantly impact production and distribution.
Leading Players in the Fermented Soy Sauce Market
- Haitian
- Kikkoman
- Lee Kum Kee
- Qianhe
- Yamasa
- Shinho
- Meiweixian
- Jiajia
- PRB BIO-TECH
- Master
- Shoda Shoyu
- ABC Sauces
- Maggi
Key Developments in Fermented Soy Sauce Sector
- 2022 Q3: Kikkoman launches a new line of organic soy sauces.
- 2023 Q1: Lee Kum Kee introduces a low-sodium soy sauce variant.
- 2024 Q2: Haitian expands its distribution network in North America.
- (Further developments with specific dates and details to be added based on available data.)
Strategic Fermented Soy Sauce Market Outlook
The fermented soy sauce market holds significant potential for future growth, fueled by increasing global demand and ongoing product innovations. Strategic opportunities lie in expanding into new markets, developing innovative product formulations (e.g., functional soy sauces with added health benefits), and enhancing supply chain efficiency. Focus on sustainable sourcing and environmentally friendly production practices will be crucial for long-term success.
Fermented Soy Sauce Segmentation
-
1. Application
- 1.1. Catering Industry
- 1.2. Household Consumption
- 1.3. Food Processing Industry
-
2. Types
- 2.1. Cooking Sauce
- 2.2. Table Soy Sauce
Fermented Soy Sauce Segmentation By Geography
-
1. North America
- 1.1. United States
- 1.2. Canada
- 1.3. Mexico
-
2. South America
- 2.1. Brazil
- 2.2. Argentina
- 2.3. Rest of South America
-
3. Europe
- 3.1. United Kingdom
- 3.2. Germany
- 3.3. France
- 3.4. Italy
- 3.5. Spain
- 3.6. Russia
- 3.7. Benelux
- 3.8. Nordics
- 3.9. Rest of Europe
-
4. Middle East & Africa
- 4.1. Turkey
- 4.2. Israel
- 4.3. GCC
- 4.4. North Africa
- 4.5. South Africa
- 4.6. Rest of Middle East & Africa
-
5. Asia Pacific
- 5.1. China
- 5.2. India
- 5.3. Japan
- 5.4. South Korea
- 5.5. ASEAN
- 5.6. Oceania
- 5.7. Rest of Asia Pacific
Fermented Soy Sauce REPORT HIGHLIGHTS
| Aspects | Details |
|---|---|
| Study Period | 2019-2033 |
| Base Year | 2024 |
| Estimated Year | 2025 |
| Forecast Period | 2025-2033 |
| Historical Period | 2019-2024 |
| Growth Rate | CAGR of 2.8% from 2019-2033 |
| Segmentation |
|
Table of Contents
- 1. Introduction
- 1.1. Research Scope
- 1.2. Market Segmentation
- 1.3. Research Methodology
- 1.4. Definitions and Assumptions
- 2. Executive Summary
- 2.1. Introduction
- 3. Market Dynamics
- 3.1. Introduction
- 3.2. Market Drivers
- 3.3. Market Restrains
- 3.4. Market Trends
- 4. Market Factor Analysis
- 4.1. Porters Five Forces
- 4.2. Supply/Value Chain
- 4.3. PESTEL analysis
- 4.4. Market Entropy
- 4.5. Patent/Trademark Analysis
- 5. Global Fermented Soy Sauce Analysis, Insights and Forecast, 2019-2031
- 5.1. Market Analysis, Insights and Forecast - by Application
- 5.1.1. Catering Industry
- 5.1.2. Household Consumption
- 5.1.3. Food Processing Industry
- 5.2. Market Analysis, Insights and Forecast - by Types
- 5.2.1. Cooking Sauce
- 5.2.2. Table Soy Sauce
- 5.3. Market Analysis, Insights and Forecast - by Region
- 5.3.1. North America
- 5.3.2. South America
- 5.3.3. Europe
- 5.3.4. Middle East & Africa
- 5.3.5. Asia Pacific
- 5.1. Market Analysis, Insights and Forecast - by Application
- 6. North America Fermented Soy Sauce Analysis, Insights and Forecast, 2019-2031
- 6.1. Market Analysis, Insights and Forecast - by Application
- 6.1.1. Catering Industry
- 6.1.2. Household Consumption
- 6.1.3. Food Processing Industry
- 6.2. Market Analysis, Insights and Forecast - by Types
- 6.2.1. Cooking Sauce
- 6.2.2. Table Soy Sauce
- 6.1. Market Analysis, Insights and Forecast - by Application
- 7. South America Fermented Soy Sauce Analysis, Insights and Forecast, 2019-2031
- 7.1. Market Analysis, Insights and Forecast - by Application
- 7.1.1. Catering Industry
- 7.1.2. Household Consumption
- 7.1.3. Food Processing Industry
- 7.2. Market Analysis, Insights and Forecast - by Types
- 7.2.1. Cooking Sauce
- 7.2.2. Table Soy Sauce
- 7.1. Market Analysis, Insights and Forecast - by Application
- 8. Europe Fermented Soy Sauce Analysis, Insights and Forecast, 2019-2031
- 8.1. Market Analysis, Insights and Forecast - by Application
- 8.1.1. Catering Industry
- 8.1.2. Household Consumption
- 8.1.3. Food Processing Industry
- 8.2. Market Analysis, Insights and Forecast - by Types
- 8.2.1. Cooking Sauce
- 8.2.2. Table Soy Sauce
- 8.1. Market Analysis, Insights and Forecast - by Application
- 9. Middle East & Africa Fermented Soy Sauce Analysis, Insights and Forecast, 2019-2031
- 9.1. Market Analysis, Insights and Forecast - by Application
- 9.1.1. Catering Industry
- 9.1.2. Household Consumption
- 9.1.3. Food Processing Industry
- 9.2. Market Analysis, Insights and Forecast - by Types
- 9.2.1. Cooking Sauce
- 9.2.2. Table Soy Sauce
- 9.1. Market Analysis, Insights and Forecast - by Application
- 10. Asia Pacific Fermented Soy Sauce Analysis, Insights and Forecast, 2019-2031
- 10.1. Market Analysis, Insights and Forecast - by Application
- 10.1.1. Catering Industry
- 10.1.2. Household Consumption
- 10.1.3. Food Processing Industry
- 10.2. Market Analysis, Insights and Forecast - by Types
- 10.2.1. Cooking Sauce
- 10.2.2. Table Soy Sauce
- 10.1. Market Analysis, Insights and Forecast - by Application
- 11. Competitive Analysis
- 11.1. Global Market Share Analysis 2024
- 11.2. Company Profiles
- 11.2.1 Haitian
- 11.2.1.1. Overview
- 11.2.1.2. Products
- 11.2.1.3. SWOT Analysis
- 11.2.1.4. Recent Developments
- 11.2.1.5. Financials (Based on Availability)
- 11.2.2 Kikkoman
- 11.2.2.1. Overview
- 11.2.2.2. Products
- 11.2.2.3. SWOT Analysis
- 11.2.2.4. Recent Developments
- 11.2.2.5. Financials (Based on Availability)
- 11.2.3 Lee Kum Kee
- 11.2.3.1. Overview
- 11.2.3.2. Products
- 11.2.3.3. SWOT Analysis
- 11.2.3.4. Recent Developments
- 11.2.3.5. Financials (Based on Availability)
- 11.2.4 Qianhe
- 11.2.4.1. Overview
- 11.2.4.2. Products
- 11.2.4.3. SWOT Analysis
- 11.2.4.4. Recent Developments
- 11.2.4.5. Financials (Based on Availability)
- 11.2.5 Yamasa
- 11.2.5.1. Overview
- 11.2.5.2. Products
- 11.2.5.3. SWOT Analysis
- 11.2.5.4. Recent Developments
- 11.2.5.5. Financials (Based on Availability)
- 11.2.6 Shinho
- 11.2.6.1. Overview
- 11.2.6.2. Products
- 11.2.6.3. SWOT Analysis
- 11.2.6.4. Recent Developments
- 11.2.6.5. Financials (Based on Availability)
- 11.2.7 Meiweixian
- 11.2.7.1. Overview
- 11.2.7.2. Products
- 11.2.7.3. SWOT Analysis
- 11.2.7.4. Recent Developments
- 11.2.7.5. Financials (Based on Availability)
- 11.2.8 Jiajia
- 11.2.8.1. Overview
- 11.2.8.2. Products
- 11.2.8.3. SWOT Analysis
- 11.2.8.4. Recent Developments
- 11.2.8.5. Financials (Based on Availability)
- 11.2.9 PRB BIO-TECH
- 11.2.9.1. Overview
- 11.2.9.2. Products
- 11.2.9.3. SWOT Analysis
- 11.2.9.4. Recent Developments
- 11.2.9.5. Financials (Based on Availability)
- 11.2.10 Master
- 11.2.10.1. Overview
- 11.2.10.2. Products
- 11.2.10.3. SWOT Analysis
- 11.2.10.4. Recent Developments
- 11.2.10.5. Financials (Based on Availability)
- 11.2.11 Shoda Shoyu
- 11.2.11.1. Overview
- 11.2.11.2. Products
- 11.2.11.3. SWOT Analysis
- 11.2.11.4. Recent Developments
- 11.2.11.5. Financials (Based on Availability)
- 11.2.12 ABC Sauces
- 11.2.12.1. Overview
- 11.2.12.2. Products
- 11.2.12.3. SWOT Analysis
- 11.2.12.4. Recent Developments
- 11.2.12.5. Financials (Based on Availability)
- 11.2.13 Maggi
- 11.2.13.1. Overview
- 11.2.13.2. Products
- 11.2.13.3. SWOT Analysis
- 11.2.13.4. Recent Developments
- 11.2.13.5. Financials (Based on Availability)
- 11.2.1 Haitian
List of Figures
- Figure 1: Global Fermented Soy Sauce Revenue Breakdown (million, %) by Region 2024 & 2032
- Figure 2: Global Fermented Soy Sauce Volume Breakdown (K, %) by Region 2024 & 2032
- Figure 3: North America Fermented Soy Sauce Revenue (million), by Application 2024 & 2032
- Figure 4: North America Fermented Soy Sauce Volume (K), by Application 2024 & 2032
- Figure 5: North America Fermented Soy Sauce Revenue Share (%), by Application 2024 & 2032
- Figure 6: North America Fermented Soy Sauce Volume Share (%), by Application 2024 & 2032
- Figure 7: North America Fermented Soy Sauce Revenue (million), by Types 2024 & 2032
- Figure 8: North America Fermented Soy Sauce Volume (K), by Types 2024 & 2032
- Figure 9: North America Fermented Soy Sauce Revenue Share (%), by Types 2024 & 2032
- Figure 10: North America Fermented Soy Sauce Volume Share (%), by Types 2024 & 2032
- Figure 11: North America Fermented Soy Sauce Revenue (million), by Country 2024 & 2032
- Figure 12: North America Fermented Soy Sauce Volume (K), by Country 2024 & 2032
- Figure 13: North America Fermented Soy Sauce Revenue Share (%), by Country 2024 & 2032
- Figure 14: North America Fermented Soy Sauce Volume Share (%), by Country 2024 & 2032
- Figure 15: South America Fermented Soy Sauce Revenue (million), by Application 2024 & 2032
- Figure 16: South America Fermented Soy Sauce Volume (K), by Application 2024 & 2032
- Figure 17: South America Fermented Soy Sauce Revenue Share (%), by Application 2024 & 2032
- Figure 18: South America Fermented Soy Sauce Volume Share (%), by Application 2024 & 2032
- Figure 19: South America Fermented Soy Sauce Revenue (million), by Types 2024 & 2032
- Figure 20: South America Fermented Soy Sauce Volume (K), by Types 2024 & 2032
- Figure 21: South America Fermented Soy Sauce Revenue Share (%), by Types 2024 & 2032
- Figure 22: South America Fermented Soy Sauce Volume Share (%), by Types 2024 & 2032
- Figure 23: South America Fermented Soy Sauce Revenue (million), by Country 2024 & 2032
- Figure 24: South America Fermented Soy Sauce Volume (K), by Country 2024 & 2032
- Figure 25: South America Fermented Soy Sauce Revenue Share (%), by Country 2024 & 2032
- Figure 26: South America Fermented Soy Sauce Volume Share (%), by Country 2024 & 2032
- Figure 27: Europe Fermented Soy Sauce Revenue (million), by Application 2024 & 2032
- Figure 28: Europe Fermented Soy Sauce Volume (K), by Application 2024 & 2032
- Figure 29: Europe Fermented Soy Sauce Revenue Share (%), by Application 2024 & 2032
- Figure 30: Europe Fermented Soy Sauce Volume Share (%), by Application 2024 & 2032
- Figure 31: Europe Fermented Soy Sauce Revenue (million), by Types 2024 & 2032
- Figure 32: Europe Fermented Soy Sauce Volume (K), by Types 2024 & 2032
- Figure 33: Europe Fermented Soy Sauce Revenue Share (%), by Types 2024 & 2032
- Figure 34: Europe Fermented Soy Sauce Volume Share (%), by Types 2024 & 2032
- Figure 35: Europe Fermented Soy Sauce Revenue (million), by Country 2024 & 2032
- Figure 36: Europe Fermented Soy Sauce Volume (K), by Country 2024 & 2032
- Figure 37: Europe Fermented Soy Sauce Revenue Share (%), by Country 2024 & 2032
- Figure 38: Europe Fermented Soy Sauce Volume Share (%), by Country 2024 & 2032
- Figure 39: Middle East & Africa Fermented Soy Sauce Revenue (million), by Application 2024 & 2032
- Figure 40: Middle East & Africa Fermented Soy Sauce Volume (K), by Application 2024 & 2032
- Figure 41: Middle East & Africa Fermented Soy Sauce Revenue Share (%), by Application 2024 & 2032
- Figure 42: Middle East & Africa Fermented Soy Sauce Volume Share (%), by Application 2024 & 2032
- Figure 43: Middle East & Africa Fermented Soy Sauce Revenue (million), by Types 2024 & 2032
- Figure 44: Middle East & Africa Fermented Soy Sauce Volume (K), by Types 2024 & 2032
- Figure 45: Middle East & Africa Fermented Soy Sauce Revenue Share (%), by Types 2024 & 2032
- Figure 46: Middle East & Africa Fermented Soy Sauce Volume Share (%), by Types 2024 & 2032
- Figure 47: Middle East & Africa Fermented Soy Sauce Revenue (million), by Country 2024 & 2032
- Figure 48: Middle East & Africa Fermented Soy Sauce Volume (K), by Country 2024 & 2032
- Figure 49: Middle East & Africa Fermented Soy Sauce Revenue Share (%), by Country 2024 & 2032
- Figure 50: Middle East & Africa Fermented Soy Sauce Volume Share (%), by Country 2024 & 2032
- Figure 51: Asia Pacific Fermented Soy Sauce Revenue (million), by Application 2024 & 2032
- Figure 52: Asia Pacific Fermented Soy Sauce Volume (K), by Application 2024 & 2032
- Figure 53: Asia Pacific Fermented Soy Sauce Revenue Share (%), by Application 2024 & 2032
- Figure 54: Asia Pacific Fermented Soy Sauce Volume Share (%), by Application 2024 & 2032
- Figure 55: Asia Pacific Fermented Soy Sauce Revenue (million), by Types 2024 & 2032
- Figure 56: Asia Pacific Fermented Soy Sauce Volume (K), by Types 2024 & 2032
- Figure 57: Asia Pacific Fermented Soy Sauce Revenue Share (%), by Types 2024 & 2032
- Figure 58: Asia Pacific Fermented Soy Sauce Volume Share (%), by Types 2024 & 2032
- Figure 59: Asia Pacific Fermented Soy Sauce Revenue (million), by Country 2024 & 2032
- Figure 60: Asia Pacific Fermented Soy Sauce Volume (K), by Country 2024 & 2032
- Figure 61: Asia Pacific Fermented Soy Sauce Revenue Share (%), by Country 2024 & 2032
- Figure 62: Asia Pacific Fermented Soy Sauce Volume Share (%), by Country 2024 & 2032
List of Tables
- Table 1: Global Fermented Soy Sauce Revenue million Forecast, by Region 2019 & 2032
- Table 2: Global Fermented Soy Sauce Volume K Forecast, by Region 2019 & 2032
- Table 3: Global Fermented Soy Sauce Revenue million Forecast, by Application 2019 & 2032
- Table 4: Global Fermented Soy Sauce Volume K Forecast, by Application 2019 & 2032
- Table 5: Global Fermented Soy Sauce Revenue million Forecast, by Types 2019 & 2032
- Table 6: Global Fermented Soy Sauce Volume K Forecast, by Types 2019 & 2032
- Table 7: Global Fermented Soy Sauce Revenue million Forecast, by Region 2019 & 2032
- Table 8: Global Fermented Soy Sauce Volume K Forecast, by Region 2019 & 2032
- Table 9: Global Fermented Soy Sauce Revenue million Forecast, by Application 2019 & 2032
- Table 10: Global Fermented Soy Sauce Volume K Forecast, by Application 2019 & 2032
- Table 11: Global Fermented Soy Sauce Revenue million Forecast, by Types 2019 & 2032
- Table 12: Global Fermented Soy Sauce Volume K Forecast, by Types 2019 & 2032
- Table 13: Global Fermented Soy Sauce Revenue million Forecast, by Country 2019 & 2032
- Table 14: Global Fermented Soy Sauce Volume K Forecast, by Country 2019 & 2032
- Table 15: United States Fermented Soy Sauce Revenue (million) Forecast, by Application 2019 & 2032
- Table 16: United States Fermented Soy Sauce Volume (K) Forecast, by Application 2019 & 2032
- Table 17: Canada Fermented Soy Sauce Revenue (million) Forecast, by Application 2019 & 2032
- Table 18: Canada Fermented Soy Sauce Volume (K) Forecast, by Application 2019 & 2032
- Table 19: Mexico Fermented Soy Sauce Revenue (million) Forecast, by Application 2019 & 2032
- Table 20: Mexico Fermented Soy Sauce Volume (K) Forecast, by Application 2019 & 2032
- Table 21: Global Fermented Soy Sauce Revenue million Forecast, by Application 2019 & 2032
- Table 22: Global Fermented Soy Sauce Volume K Forecast, by Application 2019 & 2032
- Table 23: Global Fermented Soy Sauce Revenue million Forecast, by Types 2019 & 2032
- Table 24: Global Fermented Soy Sauce Volume K Forecast, by Types 2019 & 2032
- Table 25: Global Fermented Soy Sauce Revenue million Forecast, by Country 2019 & 2032
- Table 26: Global Fermented Soy Sauce Volume K Forecast, by Country 2019 & 2032
- Table 27: Brazil Fermented Soy Sauce Revenue (million) Forecast, by Application 2019 & 2032
- Table 28: Brazil Fermented Soy Sauce Volume (K) Forecast, by Application 2019 & 2032
- Table 29: Argentina Fermented Soy Sauce Revenue (million) Forecast, by Application 2019 & 2032
- Table 30: Argentina Fermented Soy Sauce Volume (K) Forecast, by Application 2019 & 2032
- Table 31: Rest of South America Fermented Soy Sauce Revenue (million) Forecast, by Application 2019 & 2032
- Table 32: Rest of South America Fermented Soy Sauce Volume (K) Forecast, by Application 2019 & 2032
- Table 33: Global Fermented Soy Sauce Revenue million Forecast, by Application 2019 & 2032
- Table 34: Global Fermented Soy Sauce Volume K Forecast, by Application 2019 & 2032
- Table 35: Global Fermented Soy Sauce Revenue million Forecast, by Types 2019 & 2032
- Table 36: Global Fermented Soy Sauce Volume K Forecast, by Types 2019 & 2032
- Table 37: Global Fermented Soy Sauce Revenue million Forecast, by Country 2019 & 2032
- Table 38: Global Fermented Soy Sauce Volume K Forecast, by Country 2019 & 2032
- Table 39: United Kingdom Fermented Soy Sauce Revenue (million) Forecast, by Application 2019 & 2032
- Table 40: United Kingdom Fermented Soy Sauce Volume (K) Forecast, by Application 2019 & 2032
- Table 41: Germany Fermented Soy Sauce Revenue (million) Forecast, by Application 2019 & 2032
- Table 42: Germany Fermented Soy Sauce Volume (K) Forecast, by Application 2019 & 2032
- Table 43: France Fermented Soy Sauce Revenue (million) Forecast, by Application 2019 & 2032
- Table 44: France Fermented Soy Sauce Volume (K) Forecast, by Application 2019 & 2032
- Table 45: Italy Fermented Soy Sauce Revenue (million) Forecast, by Application 2019 & 2032
- Table 46: Italy Fermented Soy Sauce Volume (K) Forecast, by Application 2019 & 2032
- Table 47: Spain Fermented Soy Sauce Revenue (million) Forecast, by Application 2019 & 2032
- Table 48: Spain Fermented Soy Sauce Volume (K) Forecast, by Application 2019 & 2032
- Table 49: Russia Fermented Soy Sauce Revenue (million) Forecast, by Application 2019 & 2032
- Table 50: Russia Fermented Soy Sauce Volume (K) Forecast, by Application 2019 & 2032
- Table 51: Benelux Fermented Soy Sauce Revenue (million) Forecast, by Application 2019 & 2032
- Table 52: Benelux Fermented Soy Sauce Volume (K) Forecast, by Application 2019 & 2032
- Table 53: Nordics Fermented Soy Sauce Revenue (million) Forecast, by Application 2019 & 2032
- Table 54: Nordics Fermented Soy Sauce Volume (K) Forecast, by Application 2019 & 2032
- Table 55: Rest of Europe Fermented Soy Sauce Revenue (million) Forecast, by Application 2019 & 2032
- Table 56: Rest of Europe Fermented Soy Sauce Volume (K) Forecast, by Application 2019 & 2032
- Table 57: Global Fermented Soy Sauce Revenue million Forecast, by Application 2019 & 2032
- Table 58: Global Fermented Soy Sauce Volume K Forecast, by Application 2019 & 2032
- Table 59: Global Fermented Soy Sauce Revenue million Forecast, by Types 2019 & 2032
- Table 60: Global Fermented Soy Sauce Volume K Forecast, by Types 2019 & 2032
- Table 61: Global Fermented Soy Sauce Revenue million Forecast, by Country 2019 & 2032
- Table 62: Global Fermented Soy Sauce Volume K Forecast, by Country 2019 & 2032
- Table 63: Turkey Fermented Soy Sauce Revenue (million) Forecast, by Application 2019 & 2032
- Table 64: Turkey Fermented Soy Sauce Volume (K) Forecast, by Application 2019 & 2032
- Table 65: Israel Fermented Soy Sauce Revenue (million) Forecast, by Application 2019 & 2032
- Table 66: Israel Fermented Soy Sauce Volume (K) Forecast, by Application 2019 & 2032
- Table 67: GCC Fermented Soy Sauce Revenue (million) Forecast, by Application 2019 & 2032
- Table 68: GCC Fermented Soy Sauce Volume (K) Forecast, by Application 2019 & 2032
- Table 69: North Africa Fermented Soy Sauce Revenue (million) Forecast, by Application 2019 & 2032
- Table 70: North Africa Fermented Soy Sauce Volume (K) Forecast, by Application 2019 & 2032
- Table 71: South Africa Fermented Soy Sauce Revenue (million) Forecast, by Application 2019 & 2032
- Table 72: South Africa Fermented Soy Sauce Volume (K) Forecast, by Application 2019 & 2032
- Table 73: Rest of Middle East & Africa Fermented Soy Sauce Revenue (million) Forecast, by Application 2019 & 2032
- Table 74: Rest of Middle East & Africa Fermented Soy Sauce Volume (K) Forecast, by Application 2019 & 2032
- Table 75: Global Fermented Soy Sauce Revenue million Forecast, by Application 2019 & 2032
- Table 76: Global Fermented Soy Sauce Volume K Forecast, by Application 2019 & 2032
- Table 77: Global Fermented Soy Sauce Revenue million Forecast, by Types 2019 & 2032
- Table 78: Global Fermented Soy Sauce Volume K Forecast, by Types 2019 & 2032
- Table 79: Global Fermented Soy Sauce Revenue million Forecast, by Country 2019 & 2032
- Table 80: Global Fermented Soy Sauce Volume K Forecast, by Country 2019 & 2032
- Table 81: China Fermented Soy Sauce Revenue (million) Forecast, by Application 2019 & 2032
- Table 82: China Fermented Soy Sauce Volume (K) Forecast, by Application 2019 & 2032
- Table 83: India Fermented Soy Sauce Revenue (million) Forecast, by Application 2019 & 2032
- Table 84: India Fermented Soy Sauce Volume (K) Forecast, by Application 2019 & 2032
- Table 85: Japan Fermented Soy Sauce Revenue (million) Forecast, by Application 2019 & 2032
- Table 86: Japan Fermented Soy Sauce Volume (K) Forecast, by Application 2019 & 2032
- Table 87: South Korea Fermented Soy Sauce Revenue (million) Forecast, by Application 2019 & 2032
- Table 88: South Korea Fermented Soy Sauce Volume (K) Forecast, by Application 2019 & 2032
- Table 89: ASEAN Fermented Soy Sauce Revenue (million) Forecast, by Application 2019 & 2032
- Table 90: ASEAN Fermented Soy Sauce Volume (K) Forecast, by Application 2019 & 2032
- Table 91: Oceania Fermented Soy Sauce Revenue (million) Forecast, by Application 2019 & 2032
- Table 92: Oceania Fermented Soy Sauce Volume (K) Forecast, by Application 2019 & 2032
- Table 93: Rest of Asia Pacific Fermented Soy Sauce Revenue (million) Forecast, by Application 2019 & 2032
- Table 94: Rest of Asia Pacific Fermented Soy Sauce Volume (K) Forecast, by Application 2019 & 2032
Frequently Asked Questions
1. What is the projected Compound Annual Growth Rate (CAGR) of the Fermented Soy Sauce?
The projected CAGR is approximately 2.8%.
2. Which companies are prominent players in the Fermented Soy Sauce?
Key companies in the market include Haitian, Kikkoman, Lee Kum Kee, Qianhe, Yamasa, Shinho, Meiweixian, Jiajia, PRB BIO-TECH, Master, Shoda Shoyu, ABC Sauces, Maggi.
3. What are the main segments of the Fermented Soy Sauce?
The market segments include Application, Types.
4. Can you provide details about the market size?
The market size is estimated to be USD 16350 million as of 2022.
5. What are some drivers contributing to market growth?
N/A
6. What are the notable trends driving market growth?
N/A
7. Are there any restraints impacting market growth?
N/A
8. Can you provide examples of recent developments in the market?
N/A
9. What pricing options are available for accessing the report?
Pricing options include single-user, multi-user, and enterprise licenses priced at USD 3950.00, USD 5925.00, and USD 7900.00 respectively.
10. Is the market size provided in terms of value or volume?
The market size is provided in terms of value, measured in million and volume, measured in K.
11. Are there any specific market keywords associated with the report?
Yes, the market keyword associated with the report is "Fermented Soy Sauce," which aids in identifying and referencing the specific market segment covered.
12. How do I determine which pricing option suits my needs best?
The pricing options vary based on user requirements and access needs. Individual users may opt for single-user licenses, while businesses requiring broader access may choose multi-user or enterprise licenses for cost-effective access to the report.
13. Are there any additional resources or data provided in the Fermented Soy Sauce report?
While the report offers comprehensive insights, it's advisable to review the specific contents or supplementary materials provided to ascertain if additional resources or data are available.
14. How can I stay updated on further developments or reports in the Fermented Soy Sauce?
To stay informed about further developments, trends, and reports in the Fermented Soy Sauce, consider subscribing to industry newsletters, following relevant companies and organizations, or regularly checking reputable industry news sources and publications.
Methodology
Step 1 - Identification of Relevant Samples Size from Population Database


Step 2 - Approaches for Defining Global Market Size (Value, Volume* & Price*)

Note*: In applicable scenarios
Step 3 - Data Sources
Primary Research
- Web Analytics
- Survey Reports
- Research Institute
- Latest Research Reports
- Opinion Leaders
Secondary Research
- Annual Reports
- White Paper
- Latest Press Release
- Industry Association
- Paid Database
- Investor Presentations

Step 4 - Data Triangulation
Involves using different sources of information in order to increase the validity of a study
These sources are likely to be stakeholders in a program - participants, other researchers, program staff, other community members, and so on.
Then we put all data in single framework & apply various statistical tools to find out the dynamic on the market.
During the analysis stage, feedback from the stakeholder groups would be compared to determine areas of agreement as well as areas of divergence


