

Key Insights
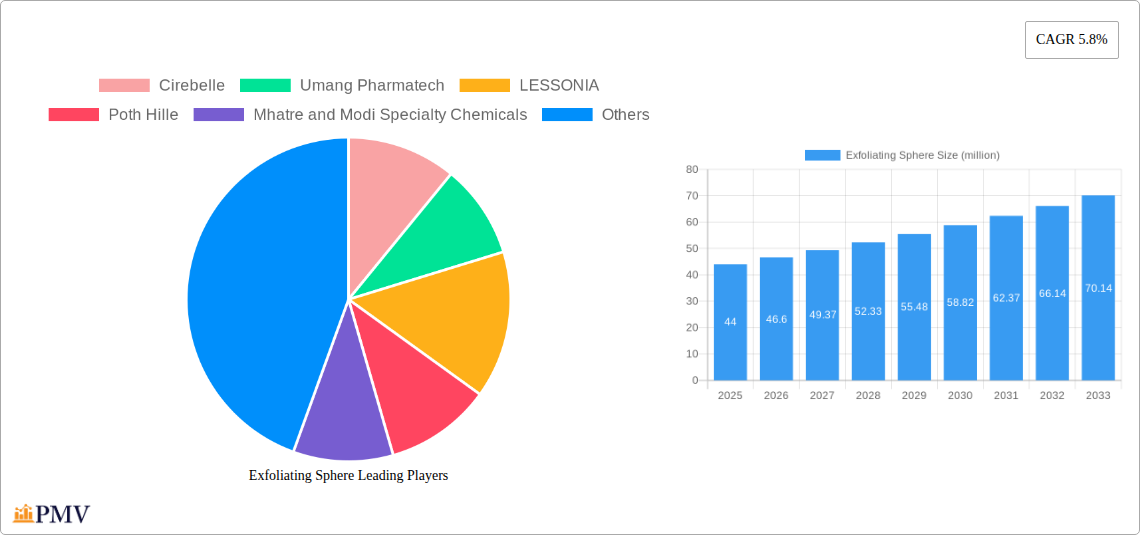
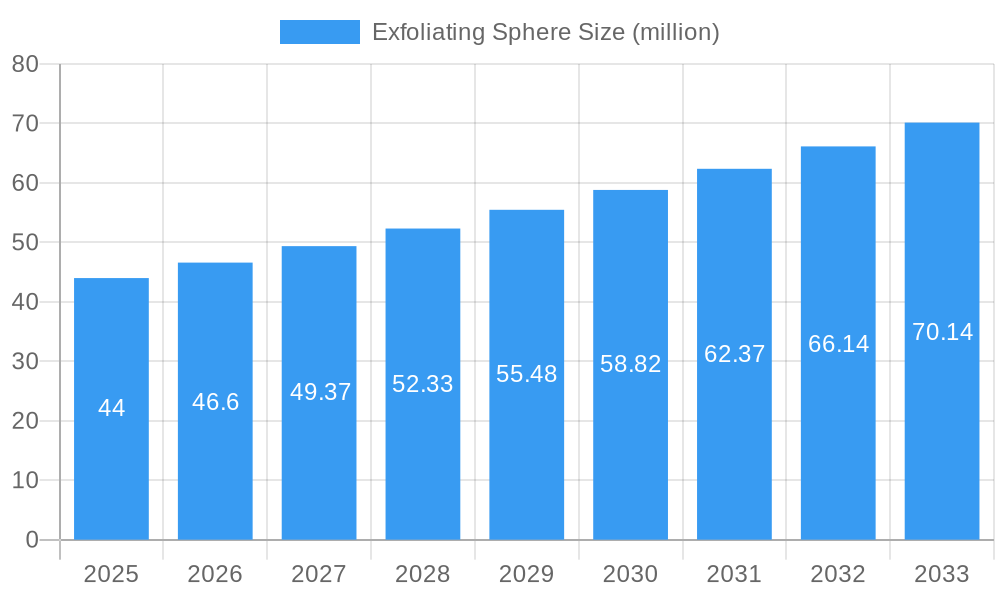
The exfoliating sphere market, valued at approximately $44 million in 2025, is projected to experience robust growth, driven by increasing consumer demand for natural and sustainable skincare solutions. The market's Compound Annual Growth Rate (CAGR) of 5.8% from 2019 to 2033 indicates a steady expansion, fueled by rising awareness of the benefits of gentle exfoliation and the growing popularity of innovative skincare technologies. Key drivers include the increasing prevalence of skin concerns like acne and hyperpigmentation, coupled with a preference for environmentally friendly and biodegradable alternatives to traditional microbeads. This shift towards sustainability is further amplified by stricter regulations regarding microplastic pollution, pushing manufacturers to adopt eco-conscious alternatives like biodegradable exfoliating spheres. The market is segmented by material type (e.g., jojoba beads, cellulose, bamboo), application (face, body), and distribution channel (online, offline). Companies like Cirebelle, Umang Pharmatech, and Evonik are key players, competing on the basis of product innovation, ingredient sourcing, and brand reputation. The market's growth will likely be geographically diverse, with North America and Europe potentially leading the expansion due to high consumer spending and established skincare markets.
Exfoliating Sphere Market Size (In Million)
The forecast period (2025-2033) suggests continued growth momentum for the exfoliating sphere market, particularly driven by product diversification and strategic partnerships between manufacturers and skincare brands. Emerging trends include the integration of exfoliating spheres into multi-functional products (e.g., cleansers, masks), personalized skincare formulations tailored to specific skin types, and an emphasis on product transparency and ingredient traceability. While challenges exist, such as managing supply chain fluctuations and maintaining price competitiveness, the overall market outlook remains positive. The increasing demand for effective and sustainable skincare solutions should support consistent growth throughout the forecast period. Furthermore, opportunities exist for market expansion through targeted marketing campaigns highlighting the benefits of exfoliating spheres and their environmental advantages.
Exfoliating Sphere Company Market Share
Exfoliating Sphere Market Report: A Comprehensive Analysis (2019-2033)
This comprehensive report provides an in-depth analysis of the global exfoliating sphere market, offering invaluable insights for businesses, investors, and researchers. The study covers the period from 2019 to 2033, with a focus on the forecast period of 2025-2033, using 2025 as the base year. The report projects a market valued at $XX million in 2025, exhibiting a Compound Annual Growth Rate (CAGR) of XX% during the forecast period, reaching a projected value of $XX million by 2033. Key players analyzed include Cirebelle, Umang Pharmatech, LESSONIA, Poth Hille, Mhatre and Modi Specialty Chemicals, Evonik, Envirospheres, Axalta, Celrich Products Pvt. Ltd., and Natural Sourcing, LLC.
Exfoliating Sphere Market Structure & Competitive Dynamics
The global exfoliating sphere market exhibits a moderately concentrated structure, with a few dominant players controlling a significant portion of the market share. Market concentration is further analyzed through the Herfindahl-Hirschman Index (HHI), calculated to be approximately xx. The market demonstrates a dynamic innovation ecosystem, driven by continuous advancements in material science and manufacturing technologies. Regulatory frameworks, particularly concerning cosmetic and personal care product safety, significantly influence market operations. While there are limited direct substitutes for exfoliating spheres, alternative exfoliation methods (e.g., chemical exfoliants) pose indirect competitive pressure. End-user trends, primarily focused on natural and sustainable products, influence product development and market growth. Mergers and acquisitions (M&A) activities have been relatively moderate in recent years, with a total estimated value of $XX million in deals completed during the historical period (2019-2024). Key M&A activities included [Insert specific examples if available, otherwise state "limited publicly disclosed M&A activity"].
- Market Share: Top 3 players account for approximately XX% of the market.
- Innovation Ecosystem: Focus on sustainable and biodegradable materials.
- Regulatory Landscape: Compliance with evolving safety regulations across different geographies.
- Substitutes: Chemical exfoliants and natural alternatives pose indirect competition.
- End-User Trends: Growing preference for natural, eco-friendly exfoliants.
Exfoliating Sphere Industry Trends & Insights
The exfoliating sphere market is experiencing significant growth driven by increasing consumer demand for skincare products with exfoliating properties. The rising awareness of skincare benefits among the millennial and Gen Z population fuels the market growth. Technological advancements in material science, allowing for the creation of more effective and sustainable exfoliating spheres, have also contributed to the market's expansion. Consumer preference shifts toward natural and organic ingredients impact product formulations, leading to an increase in the demand for biodegradable exfoliating spheres. The market demonstrates a robust CAGR of XX%, exceeding the projected growth rate of the broader personal care industry. Market penetration is steadily increasing, particularly in emerging economies experiencing rising disposable incomes and increasing skincare awareness. Competitive dynamics are characterized by both established players and new entrants focused on product differentiation and innovation.
Dominant Markets & Segments in Exfoliating Sphere
The North American region currently holds the largest market share for exfoliating spheres, driven by strong consumer demand and a high level of disposable income. Key drivers in this region include:
- Economic Factors: Strong consumer spending power and a thriving personal care market.
- Infrastructure: Well-established distribution networks and robust e-commerce platforms.
- Consumer Trends: A high level of awareness about skincare and beauty routines.
Within North America, the United States dominates the market, owing to its large population, high per capita consumption of personal care products, and strong presence of major cosmetics and personal care brands. Europe is also a significant market, with a growing preference for natural and sustainable exfoliants. Asia-Pacific represents a high-growth potential market, due to rapidly increasing disposable incomes and growing awareness regarding skincare.
Exfoliating Sphere Product Innovations
Recent product innovations focus on biodegradable and sustainable materials, incorporating natural ingredients to cater to environmentally conscious consumers. Technological advancements in sphere production allow for more uniform sizes and shapes, improving efficacy and user experience. New formulations aim to offer tailored solutions for specific skin types and concerns. These innovations enhance the competitive advantages of leading players through product differentiation and market share expansion.
Report Segmentation & Scope
The report segments the exfoliating sphere market based on several key factors:
- By Material: This includes spheres made from natural materials (e.g., jojoba beads, bamboo), synthetic polymers, and other novel materials. The natural materials segment is expected to witness high growth during the forecast period due to growing demand for eco-friendly products.
- By Application: The market is segmented by application in various personal care products such as face scrubs, body scrubs, and other skincare products. The face scrubs segment is expected to dominate the market during the forecast period.
- By Distribution Channel: The report analyzes the market based on distribution channels including online retail, specialty stores, and supermarkets/hypermarkets. Online retail is anticipated to be a key growth driver due to rising e-commerce adoption.
Each segment's growth projections, market sizes, and competitive dynamics are thoroughly analyzed, providing a comprehensive understanding of the market landscape.
Key Drivers of Exfoliating Sphere Growth
The growth of the exfoliating sphere market is primarily driven by:
- Rising Consumer Awareness: Increased awareness of skincare and beauty routines.
- Technological Advancements: Innovation in biodegradable and sustainable materials.
- E-commerce Expansion: Increased accessibility through online platforms.
- Favorable Regulatory Environment: Regulations promoting sustainable practices.
Challenges in the Exfoliating Sphere Sector
Major challenges include:
- Supply Chain Disruptions: Volatility in raw material prices and supply chain complexities.
- Stringent Regulations: Compliance requirements for product safety and sustainability.
- Intense Competition: Market competition necessitates continuous innovation and product differentiation.
- Consumer Perception: Addressing potential concerns about microplastic pollution associated with non-biodegradable spheres.
Leading Players in the Exfoliating Sphere Market
- Cirebelle
- Umang Pharmatech
- LESSONIA
- Poth Hille
- Mhatre and Modi Specialty Chemicals
- Evonik
- Envirospheres
- Axalta
- Celrich Products Pvt. Ltd.
- Natural Sourcing, LLC
Key Developments in Exfoliating Sphere Sector
- 2022 Q4: Cirebelle launches a new line of biodegradable exfoliating spheres made from sustainably sourced materials.
- 2023 Q1: Umang Pharmatech secures a patent for its innovative exfoliating sphere production technology.
- [Add further developments with year/month and impact on market dynamics as available]:
Strategic Exfoliating Sphere Market Outlook
The future of the exfoliating sphere market appears promising, driven by sustained consumer demand for effective and sustainable skincare products. Strategic opportunities exist for players focused on innovation in biodegradable materials and sustainable production processes. Expansion into emerging markets with growing disposable incomes and increased skincare awareness will be crucial for market growth. Collaborations between manufacturers and research institutions are expected to accelerate the development of novel exfoliating sphere technologies.
Exfoliating Sphere Segmentation
-
1. Application
- 1.1. Cosmetic
- 1.2. Personal Care
-
2. Types
- 2.1. Particle Size: Less Than 0.2 mm
- 2.2. Particle Size: 0.2-0.3 mm
- 2.3. Particle Size: 0.3-0.6 mm
- 2.4. Particle Size: 0.6-0.8 mm
- 2.5. Particle Size: 0.8-1.4 mm
- 2.6. Particle Size: 1.4-2.0 mm
- 2.7. Particle Size: 2-5 mm
Exfoliating Sphere Segmentation By Geography
-
1. North America
- 1.1. United States
- 1.2. Canada
- 1.3. Mexico
-
2. South America
- 2.1. Brazil
- 2.2. Argentina
- 2.3. Rest of South America
-
3. Europe
- 3.1. United Kingdom
- 3.2. Germany
- 3.3. France
- 3.4. Italy
- 3.5. Spain
- 3.6. Russia
- 3.7. Benelux
- 3.8. Nordics
- 3.9. Rest of Europe
-
4. Middle East & Africa
- 4.1. Turkey
- 4.2. Israel
- 4.3. GCC
- 4.4. North Africa
- 4.5. South Africa
- 4.6. Rest of Middle East & Africa
-
5. Asia Pacific
- 5.1. China
- 5.2. India
- 5.3. Japan
- 5.4. South Korea
- 5.5. ASEAN
- 5.6. Oceania
- 5.7. Rest of Asia Pacific

Exfoliating Sphere Regional Market Share
Geographic Coverage of Exfoliating Sphere
Exfoliating Sphere REPORT HIGHLIGHTS
| Aspects | Details |
|---|---|
| Study Period | 2020-2034 |
| Base Year | 2025 |
| Estimated Year | 2026 |
| Forecast Period | 2026-2034 |
| Historical Period | 2020-2025 |
| Growth Rate | CAGR of 5.8% from 2020-2034 |
| Segmentation |
|
Table of Contents
- 1. Introduction
- 1.1. Research Scope
- 1.2. Market Segmentation
- 1.3. Research Methodology
- 1.4. Definitions and Assumptions
- 2. Executive Summary
- 2.1. Introduction
- 3. Market Dynamics
- 3.1. Introduction
- 3.2. Market Drivers
- 3.3. Market Restrains
- 3.4. Market Trends
- 4. Market Factor Analysis
- 4.1. Porters Five Forces
- 4.2. Supply/Value Chain
- 4.3. PESTEL analysis
- 4.4. Market Entropy
- 4.5. Patent/Trademark Analysis
- 5. Global Exfoliating Sphere Analysis, Insights and Forecast, 2020-2032
- 5.1. Market Analysis, Insights and Forecast - by Application
- 5.1.1. Cosmetic
- 5.1.2. Personal Care
- 5.2. Market Analysis, Insights and Forecast - by Types
- 5.2.1. Particle Size: Less Than 0.2 mm
- 5.2.2. Particle Size: 0.2-0.3 mm
- 5.2.3. Particle Size: 0.3-0.6 mm
- 5.2.4. Particle Size: 0.6-0.8 mm
- 5.2.5. Particle Size: 0.8-1.4 mm
- 5.2.6. Particle Size: 1.4-2.0 mm
- 5.2.7. Particle Size: 2-5 mm
- 5.3. Market Analysis, Insights and Forecast - by Region
- 5.3.1. North America
- 5.3.2. South America
- 5.3.3. Europe
- 5.3.4. Middle East & Africa
- 5.3.5. Asia Pacific
- 5.1. Market Analysis, Insights and Forecast - by Application
- 6. North America Exfoliating Sphere Analysis, Insights and Forecast, 2020-2032
- 6.1. Market Analysis, Insights and Forecast - by Application
- 6.1.1. Cosmetic
- 6.1.2. Personal Care
- 6.2. Market Analysis, Insights and Forecast - by Types
- 6.2.1. Particle Size: Less Than 0.2 mm
- 6.2.2. Particle Size: 0.2-0.3 mm
- 6.2.3. Particle Size: 0.3-0.6 mm
- 6.2.4. Particle Size: 0.6-0.8 mm
- 6.2.5. Particle Size: 0.8-1.4 mm
- 6.2.6. Particle Size: 1.4-2.0 mm
- 6.2.7. Particle Size: 2-5 mm
- 6.1. Market Analysis, Insights and Forecast - by Application
- 7. South America Exfoliating Sphere Analysis, Insights and Forecast, 2020-2032
- 7.1. Market Analysis, Insights and Forecast - by Application
- 7.1.1. Cosmetic
- 7.1.2. Personal Care
- 7.2. Market Analysis, Insights and Forecast - by Types
- 7.2.1. Particle Size: Less Than 0.2 mm
- 7.2.2. Particle Size: 0.2-0.3 mm
- 7.2.3. Particle Size: 0.3-0.6 mm
- 7.2.4. Particle Size: 0.6-0.8 mm
- 7.2.5. Particle Size: 0.8-1.4 mm
- 7.2.6. Particle Size: 1.4-2.0 mm
- 7.2.7. Particle Size: 2-5 mm
- 7.1. Market Analysis, Insights and Forecast - by Application
- 8. Europe Exfoliating Sphere Analysis, Insights and Forecast, 2020-2032
- 8.1. Market Analysis, Insights and Forecast - by Application
- 8.1.1. Cosmetic
- 8.1.2. Personal Care
- 8.2. Market Analysis, Insights and Forecast - by Types
- 8.2.1. Particle Size: Less Than 0.2 mm
- 8.2.2. Particle Size: 0.2-0.3 mm
- 8.2.3. Particle Size: 0.3-0.6 mm
- 8.2.4. Particle Size: 0.6-0.8 mm
- 8.2.5. Particle Size: 0.8-1.4 mm
- 8.2.6. Particle Size: 1.4-2.0 mm
- 8.2.7. Particle Size: 2-5 mm
- 8.1. Market Analysis, Insights and Forecast - by Application
- 9. Middle East & Africa Exfoliating Sphere Analysis, Insights and Forecast, 2020-2032
- 9.1. Market Analysis, Insights and Forecast - by Application
- 9.1.1. Cosmetic
- 9.1.2. Personal Care
- 9.2. Market Analysis, Insights and Forecast - by Types
- 9.2.1. Particle Size: Less Than 0.2 mm
- 9.2.2. Particle Size: 0.2-0.3 mm
- 9.2.3. Particle Size: 0.3-0.6 mm
- 9.2.4. Particle Size: 0.6-0.8 mm
- 9.2.5. Particle Size: 0.8-1.4 mm
- 9.2.6. Particle Size: 1.4-2.0 mm
- 9.2.7. Particle Size: 2-5 mm
- 9.1. Market Analysis, Insights and Forecast - by Application
- 10. Asia Pacific Exfoliating Sphere Analysis, Insights and Forecast, 2020-2032
- 10.1. Market Analysis, Insights and Forecast - by Application
- 10.1.1. Cosmetic
- 10.1.2. Personal Care
- 10.2. Market Analysis, Insights and Forecast - by Types
- 10.2.1. Particle Size: Less Than 0.2 mm
- 10.2.2. Particle Size: 0.2-0.3 mm
- 10.2.3. Particle Size: 0.3-0.6 mm
- 10.2.4. Particle Size: 0.6-0.8 mm
- 10.2.5. Particle Size: 0.8-1.4 mm
- 10.2.6. Particle Size: 1.4-2.0 mm
- 10.2.7. Particle Size: 2-5 mm
- 10.1. Market Analysis, Insights and Forecast - by Application
- 11. Competitive Analysis
- 11.1. Global Market Share Analysis 2025
- 11.2. Company Profiles
- 11.2.1 Cirebelle
- 11.2.1.1. Overview
- 11.2.1.2. Products
- 11.2.1.3. SWOT Analysis
- 11.2.1.4. Recent Developments
- 11.2.1.5. Financials (Based on Availability)
- 11.2.2 Umang Pharmatech
- 11.2.2.1. Overview
- 11.2.2.2. Products
- 11.2.2.3. SWOT Analysis
- 11.2.2.4. Recent Developments
- 11.2.2.5. Financials (Based on Availability)
- 11.2.3 LESSONIA
- 11.2.3.1. Overview
- 11.2.3.2. Products
- 11.2.3.3. SWOT Analysis
- 11.2.3.4. Recent Developments
- 11.2.3.5. Financials (Based on Availability)
- 11.2.4 Poth Hille
- 11.2.4.1. Overview
- 11.2.4.2. Products
- 11.2.4.3. SWOT Analysis
- 11.2.4.4. Recent Developments
- 11.2.4.5. Financials (Based on Availability)
- 11.2.5 Mhatre and Modi Specialty Chemicals
- 11.2.5.1. Overview
- 11.2.5.2. Products
- 11.2.5.3. SWOT Analysis
- 11.2.5.4. Recent Developments
- 11.2.5.5. Financials (Based on Availability)
- 11.2.6 Evonik
- 11.2.6.1. Overview
- 11.2.6.2. Products
- 11.2.6.3. SWOT Analysis
- 11.2.6.4. Recent Developments
- 11.2.6.5. Financials (Based on Availability)
- 11.2.7 Envirospheres
- 11.2.7.1. Overview
- 11.2.7.2. Products
- 11.2.7.3. SWOT Analysis
- 11.2.7.4. Recent Developments
- 11.2.7.5. Financials (Based on Availability)
- 11.2.8 Axalta
- 11.2.8.1. Overview
- 11.2.8.2. Products
- 11.2.8.3. SWOT Analysis
- 11.2.8.4. Recent Developments
- 11.2.8.5. Financials (Based on Availability)
- 11.2.9 Celrich Products Pvt. Ltd.
- 11.2.9.1. Overview
- 11.2.9.2. Products
- 11.2.9.3. SWOT Analysis
- 11.2.9.4. Recent Developments
- 11.2.9.5. Financials (Based on Availability)
- 11.2.10
- 11.2.10.1. Overview
- 11.2.10.2. Products
- 11.2.10.3. SWOT Analysis
- 11.2.10.4. Recent Developments
- 11.2.10.5. Financials (Based on Availability)
- 11.2.11 Natural Sourcing
- 11.2.11.1. Overview
- 11.2.11.2. Products
- 11.2.11.3. SWOT Analysis
- 11.2.11.4. Recent Developments
- 11.2.11.5. Financials (Based on Availability)
- 11.2.12 LLC
- 11.2.12.1. Overview
- 11.2.12.2. Products
- 11.2.12.3. SWOT Analysis
- 11.2.12.4. Recent Developments
- 11.2.12.5. Financials (Based on Availability)
- 11.2.1 Cirebelle
List of Figures
- Figure 1: Global Exfoliating Sphere Revenue Breakdown (million, %) by Region 2025 & 2033
- Figure 2: North America Exfoliating Sphere Revenue (million), by Application 2025 & 2033
- Figure 3: North America Exfoliating Sphere Revenue Share (%), by Application 2025 & 2033
- Figure 4: North America Exfoliating Sphere Revenue (million), by Types 2025 & 2033
- Figure 5: North America Exfoliating Sphere Revenue Share (%), by Types 2025 & 2033
- Figure 6: North America Exfoliating Sphere Revenue (million), by Country 2025 & 2033
- Figure 7: North America Exfoliating Sphere Revenue Share (%), by Country 2025 & 2033
- Figure 8: South America Exfoliating Sphere Revenue (million), by Application 2025 & 2033
- Figure 9: South America Exfoliating Sphere Revenue Share (%), by Application 2025 & 2033
- Figure 10: South America Exfoliating Sphere Revenue (million), by Types 2025 & 2033
- Figure 11: South America Exfoliating Sphere Revenue Share (%), by Types 2025 & 2033
- Figure 12: South America Exfoliating Sphere Revenue (million), by Country 2025 & 2033
- Figure 13: South America Exfoliating Sphere Revenue Share (%), by Country 2025 & 2033
- Figure 14: Europe Exfoliating Sphere Revenue (million), by Application 2025 & 2033
- Figure 15: Europe Exfoliating Sphere Revenue Share (%), by Application 2025 & 2033
- Figure 16: Europe Exfoliating Sphere Revenue (million), by Types 2025 & 2033
- Figure 17: Europe Exfoliating Sphere Revenue Share (%), by Types 2025 & 2033
- Figure 18: Europe Exfoliating Sphere Revenue (million), by Country 2025 & 2033
- Figure 19: Europe Exfoliating Sphere Revenue Share (%), by Country 2025 & 2033
- Figure 20: Middle East & Africa Exfoliating Sphere Revenue (million), by Application 2025 & 2033
- Figure 21: Middle East & Africa Exfoliating Sphere Revenue Share (%), by Application 2025 & 2033
- Figure 22: Middle East & Africa Exfoliating Sphere Revenue (million), by Types 2025 & 2033
- Figure 23: Middle East & Africa Exfoliating Sphere Revenue Share (%), by Types 2025 & 2033
- Figure 24: Middle East & Africa Exfoliating Sphere Revenue (million), by Country 2025 & 2033
- Figure 25: Middle East & Africa Exfoliating Sphere Revenue Share (%), by Country 2025 & 2033
- Figure 26: Asia Pacific Exfoliating Sphere Revenue (million), by Application 2025 & 2033
- Figure 27: Asia Pacific Exfoliating Sphere Revenue Share (%), by Application 2025 & 2033
- Figure 28: Asia Pacific Exfoliating Sphere Revenue (million), by Types 2025 & 2033
- Figure 29: Asia Pacific Exfoliating Sphere Revenue Share (%), by Types 2025 & 2033
- Figure 30: Asia Pacific Exfoliating Sphere Revenue (million), by Country 2025 & 2033
- Figure 31: Asia Pacific Exfoliating Sphere Revenue Share (%), by Country 2025 & 2033
List of Tables
- Table 1: Global Exfoliating Sphere Revenue million Forecast, by Application 2020 & 2033
- Table 2: Global Exfoliating Sphere Revenue million Forecast, by Types 2020 & 2033
- Table 3: Global Exfoliating Sphere Revenue million Forecast, by Region 2020 & 2033
- Table 4: Global Exfoliating Sphere Revenue million Forecast, by Application 2020 & 2033
- Table 5: Global Exfoliating Sphere Revenue million Forecast, by Types 2020 & 2033
- Table 6: Global Exfoliating Sphere Revenue million Forecast, by Country 2020 & 2033
- Table 7: United States Exfoliating Sphere Revenue (million) Forecast, by Application 2020 & 2033
- Table 8: Canada Exfoliating Sphere Revenue (million) Forecast, by Application 2020 & 2033
- Table 9: Mexico Exfoliating Sphere Revenue (million) Forecast, by Application 2020 & 2033
- Table 10: Global Exfoliating Sphere Revenue million Forecast, by Application 2020 & 2033
- Table 11: Global Exfoliating Sphere Revenue million Forecast, by Types 2020 & 2033
- Table 12: Global Exfoliating Sphere Revenue million Forecast, by Country 2020 & 2033
- Table 13: Brazil Exfoliating Sphere Revenue (million) Forecast, by Application 2020 & 2033
- Table 14: Argentina Exfoliating Sphere Revenue (million) Forecast, by Application 2020 & 2033
- Table 15: Rest of South America Exfoliating Sphere Revenue (million) Forecast, by Application 2020 & 2033
- Table 16: Global Exfoliating Sphere Revenue million Forecast, by Application 2020 & 2033
- Table 17: Global Exfoliating Sphere Revenue million Forecast, by Types 2020 & 2033
- Table 18: Global Exfoliating Sphere Revenue million Forecast, by Country 2020 & 2033
- Table 19: United Kingdom Exfoliating Sphere Revenue (million) Forecast, by Application 2020 & 2033
- Table 20: Germany Exfoliating Sphere Revenue (million) Forecast, by Application 2020 & 2033
- Table 21: France Exfoliating Sphere Revenue (million) Forecast, by Application 2020 & 2033
- Table 22: Italy Exfoliating Sphere Revenue (million) Forecast, by Application 2020 & 2033
- Table 23: Spain Exfoliating Sphere Revenue (million) Forecast, by Application 2020 & 2033
- Table 24: Russia Exfoliating Sphere Revenue (million) Forecast, by Application 2020 & 2033
- Table 25: Benelux Exfoliating Sphere Revenue (million) Forecast, by Application 2020 & 2033
- Table 26: Nordics Exfoliating Sphere Revenue (million) Forecast, by Application 2020 & 2033
- Table 27: Rest of Europe Exfoliating Sphere Revenue (million) Forecast, by Application 2020 & 2033
- Table 28: Global Exfoliating Sphere Revenue million Forecast, by Application 2020 & 2033
- Table 29: Global Exfoliating Sphere Revenue million Forecast, by Types 2020 & 2033
- Table 30: Global Exfoliating Sphere Revenue million Forecast, by Country 2020 & 2033
- Table 31: Turkey Exfoliating Sphere Revenue (million) Forecast, by Application 2020 & 2033
- Table 32: Israel Exfoliating Sphere Revenue (million) Forecast, by Application 2020 & 2033
- Table 33: GCC Exfoliating Sphere Revenue (million) Forecast, by Application 2020 & 2033
- Table 34: North Africa Exfoliating Sphere Revenue (million) Forecast, by Application 2020 & 2033
- Table 35: South Africa Exfoliating Sphere Revenue (million) Forecast, by Application 2020 & 2033
- Table 36: Rest of Middle East & Africa Exfoliating Sphere Revenue (million) Forecast, by Application 2020 & 2033
- Table 37: Global Exfoliating Sphere Revenue million Forecast, by Application 2020 & 2033
- Table 38: Global Exfoliating Sphere Revenue million Forecast, by Types 2020 & 2033
- Table 39: Global Exfoliating Sphere Revenue million Forecast, by Country 2020 & 2033
- Table 40: China Exfoliating Sphere Revenue (million) Forecast, by Application 2020 & 2033
- Table 41: India Exfoliating Sphere Revenue (million) Forecast, by Application 2020 & 2033
- Table 42: Japan Exfoliating Sphere Revenue (million) Forecast, by Application 2020 & 2033
- Table 43: South Korea Exfoliating Sphere Revenue (million) Forecast, by Application 2020 & 2033
- Table 44: ASEAN Exfoliating Sphere Revenue (million) Forecast, by Application 2020 & 2033
- Table 45: Oceania Exfoliating Sphere Revenue (million) Forecast, by Application 2020 & 2033
- Table 46: Rest of Asia Pacific Exfoliating Sphere Revenue (million) Forecast, by Application 2020 & 2033
Frequently Asked Questions
1. What is the projected Compound Annual Growth Rate (CAGR) of the Exfoliating Sphere?
The projected CAGR is approximately 5.8%.
2. Which companies are prominent players in the Exfoliating Sphere?
Key companies in the market include Cirebelle, Umang Pharmatech, LESSONIA, Poth Hille, Mhatre and Modi Specialty Chemicals, Evonik, Envirospheres, Axalta, Celrich Products Pvt. Ltd., , Natural Sourcing, LLC.
3. What are the main segments of the Exfoliating Sphere?
The market segments include Application, Types.
4. Can you provide details about the market size?
The market size is estimated to be USD 44 million as of 2022.
5. What are some drivers contributing to market growth?
N/A
6. What are the notable trends driving market growth?
N/A
7. Are there any restraints impacting market growth?
N/A
8. Can you provide examples of recent developments in the market?
N/A
9. What pricing options are available for accessing the report?
Pricing options include single-user, multi-user, and enterprise licenses priced at USD 4900.00, USD 7350.00, and USD 9800.00 respectively.
10. Is the market size provided in terms of value or volume?
The market size is provided in terms of value, measured in million.
11. Are there any specific market keywords associated with the report?
Yes, the market keyword associated with the report is "Exfoliating Sphere," which aids in identifying and referencing the specific market segment covered.
12. How do I determine which pricing option suits my needs best?
The pricing options vary based on user requirements and access needs. Individual users may opt for single-user licenses, while businesses requiring broader access may choose multi-user or enterprise licenses for cost-effective access to the report.
13. Are there any additional resources or data provided in the Exfoliating Sphere report?
While the report offers comprehensive insights, it's advisable to review the specific contents or supplementary materials provided to ascertain if additional resources or data are available.
14. How can I stay updated on further developments or reports in the Exfoliating Sphere?
To stay informed about further developments, trends, and reports in the Exfoliating Sphere, consider subscribing to industry newsletters, following relevant companies and organizations, or regularly checking reputable industry news sources and publications.
Methodology
Step 1 - Identification of Relevant Samples Size from Population Database


Step 2 - Approaches for Defining Global Market Size (Value, Volume* & Price*)

Note*: In applicable scenarios
Step 3 - Data Sources
Primary Research
- Web Analytics
- Survey Reports
- Research Institute
- Latest Research Reports
- Opinion Leaders
Secondary Research
- Annual Reports
- White Paper
- Latest Press Release
- Industry Association
- Paid Database
- Investor Presentations

Step 4 - Data Triangulation
Involves using different sources of information in order to increase the validity of a study
These sources are likely to be stakeholders in a program - participants, other researchers, program staff, other community members, and so on.
Then we put all data in single framework & apply various statistical tools to find out the dynamic on the market.
During the analysis stage, feedback from the stakeholder groups would be compared to determine areas of agreement as well as areas of divergence