
Key Insights
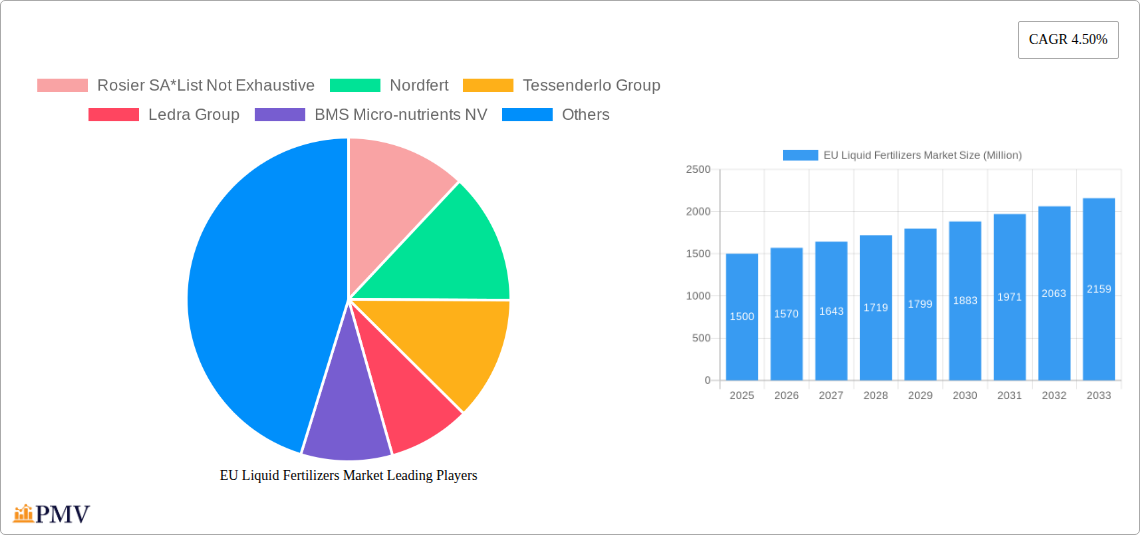
The EU liquid fertilizers market, exhibiting a Compound Annual Growth Rate (CAGR) of 4.50% from 2019 to 2024, is poised for continued expansion through 2033. This growth is fueled by several key drivers. The increasing demand for high-yielding crops to meet the growing global food requirements is a significant factor. Furthermore, the rising adoption of precision agriculture techniques, such as fertigation and foliar application, allows for more efficient nutrient delivery and optimized crop yields, boosting liquid fertilizer demand. The shift towards sustainable agricultural practices also plays a crucial role, with organic liquid fertilizers experiencing increased adoption due to growing consumer preference for organically grown produce. This trend is further reinforced by stricter environmental regulations promoting environmentally friendly farming methods. The market segmentation reveals strong demand for nitrogen and potassium-based liquid fertilizers, along with micronutrients, reflecting the diverse nutritional needs of various crops. Within the application segment, grains and cereals, pulses and oilseeds, and commercial crops dominate, indicating the broad applicability of liquid fertilizers across diverse agricultural sectors.
However, market growth faces certain challenges. Fluctuations in raw material prices and potential supply chain disruptions can impact production costs and availability. Furthermore, the competitive landscape, with established players like Yara International ASA and Compo Expert alongside regional players, necessitates continuous innovation and strategic positioning to maintain market share. Despite these restraints, the ongoing technological advancements in liquid fertilizer formulation and application methods, coupled with supportive government policies promoting sustainable agriculture, are expected to mitigate these challenges and sustain the market's positive growth trajectory. The EU market, being a significant agricultural region, holds significant potential for liquid fertilizer producers, given its intensive farming practices and commitment to food security and sustainable agricultural practices.
EU Liquid Fertilizers Market: A Comprehensive Report (2019-2033)
This in-depth report provides a comprehensive analysis of the EU Liquid Fertilizers Market, offering invaluable insights for stakeholders across the agricultural and chemical sectors. With a detailed examination spanning the period from 2019 to 2033, including a base year of 2025 and a forecast period of 2025-2033, this report is essential for strategic decision-making. The market is segmented by nutrient type (Nitrogen, Potassium, Micronutrients, Other Nutrients), ingredient type (Synthetic, Organic), mode of application (Foliar Application, Aerial Application, Starter Solutions, Fertigation, Injection into Soil), and application (Grains and Cereals, Pulses and Oilseeds, Commercial Crops, Fruits and Vegetables, Other Applications). Key players analyzed include Rosier SA, Nordfert, Tessenderlo Group, Ledra Group, BMS Micro-nutrients NV, BTU Center, Van Iperen International, Yara International ASA, Compo Expert, and ICL Fertilizers. The report projects a market value of xx Million by 2033, exhibiting a CAGR of xx% during the forecast period.
EU Liquid Fertilizers Market Structure & Competitive Dynamics
The EU liquid fertilizers market exhibits a moderately consolidated structure, with several multinational corporations holding significant market share. The market is characterized by intense competition, driven by factors such as product innovation, pricing strategies, and distribution networks. Innovation plays a crucial role, with companies constantly striving to develop efficient and environmentally friendly fertilizer formulations. Stringent EU regulations regarding fertilizer production and application influence the competitive landscape, particularly regarding environmental impact and sustainable agriculture. Product substitution, mainly from alternative nutrient sources and application methods, poses a challenge to market leaders. End-user trends toward precision farming and sustainable agricultural practices are reshaping the market demand for specific liquid fertilizer types. M&A activities are relatively frequent, with larger companies expanding their market reach and product portfolios through acquisitions. For example, the acquisition of Fleuren Tankopslag B.V. by Tessenderlo Group in May 2022 illustrates the strategic importance of efficient logistics and distribution networks. The average M&A deal value in the sector over the historical period (2019-2024) was approximately xx Million, indicating significant investment in market consolidation and expansion.
- Market Concentration: Moderately Consolidated
- Innovation Ecosystem: Highly Active
- Regulatory Framework: Stringent
- M&A Activity: Significant, with an average deal value of xx Million (2019-2024)
EU Liquid Fertilizers Market Industry Trends & Insights
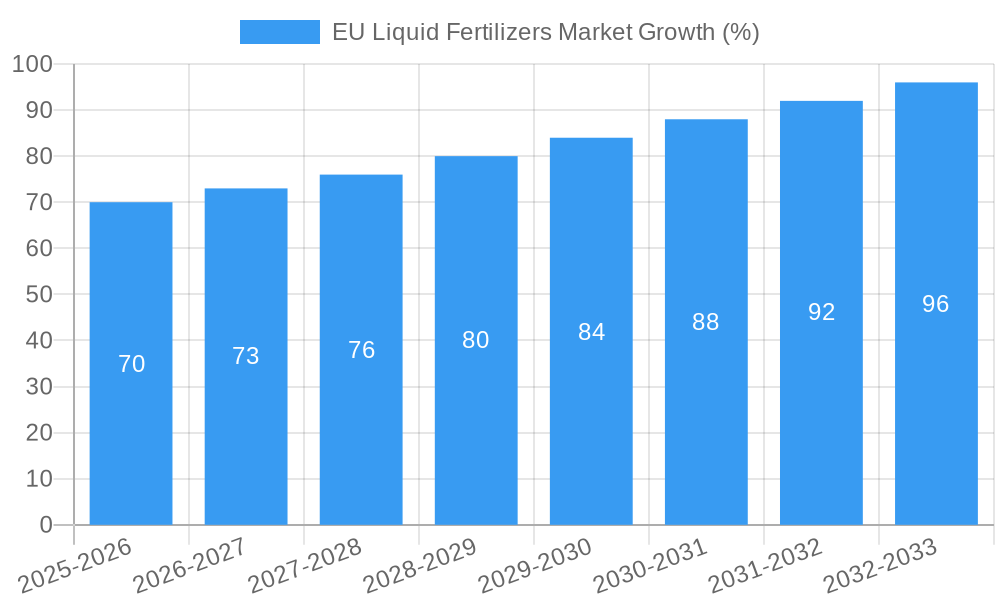
The EU liquid fertilizers market is experiencing robust growth, driven primarily by rising agricultural output and a growing preference for efficient fertilizer application methods. Technological advancements in fertilizer formulation and application techniques, such as precision agriculture and controlled-release fertilizers, are boosting market expansion. The increasing focus on sustainable agriculture is driving demand for organic and environmentally friendly liquid fertilizers. Consumer preferences are shifting towards products that minimize environmental impact, while maximizing crop yields. The market exhibits a dynamic competitive landscape, with companies focusing on product differentiation, partnerships, and strategic acquisitions to enhance market presence. The market penetration of liquid fertilizers in various applications such as grains and cereals and fruits and vegetables continues to increase, demonstrating high demand. The growth is primarily fueled by increasing acreage under cultivation of various crops, combined with farmers' willingness to adopt improved farming technologies. The market is expected to register a CAGR of xx% during the forecast period (2025-2033), reaching an estimated value of xx Million by 2033.
Dominant Markets & Segments in EU Liquid Fertilizers Market
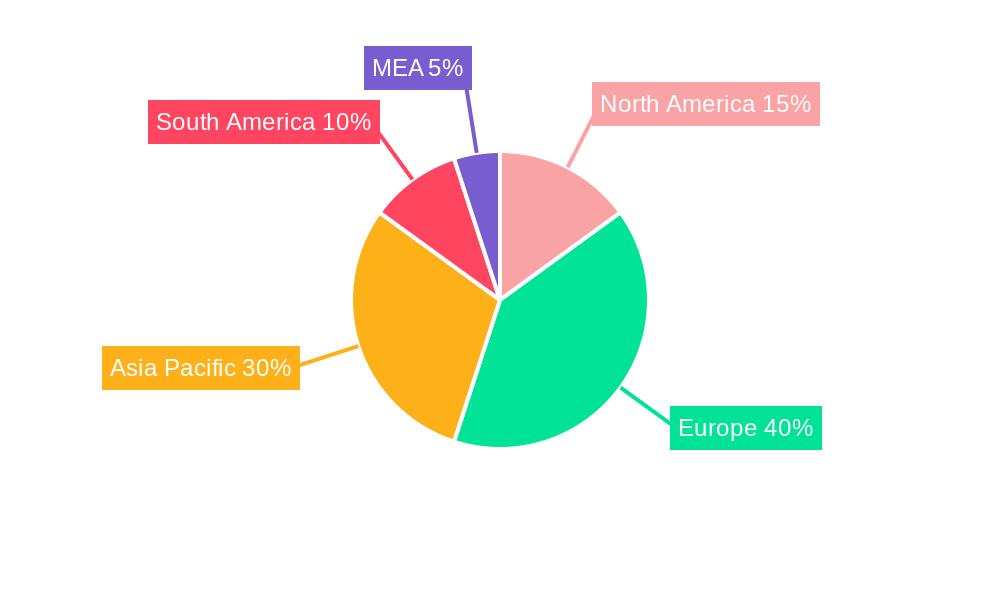
The Nitrogen segment holds the largest market share within the nutrient type category, driven by its high demand in various crops. Germany and France represent the leading regional markets due to their extensive agricultural sectors and adoption of advanced farming techniques. Synthetic liquid fertilizers command a significant share within the ingredient type segment due to their cost-effectiveness and widespread availability. Fertigation, due to its efficiency and precise nutrient delivery, leads in the application method segment, especially for commercial crops like fruits and vegetables. Grains and cereals constitute a primary application segment, consuming a substantial portion of the overall market volume.
- Key Drivers for Dominant Segments:
- High crop yields and intensified agriculture.
- Favorable government policies supporting agricultural development.
- Well-established distribution networks.
- Technological advancements in application methods.
EU Liquid Fertilizers Market Product Innovations
Recent innovations focus on developing controlled-release fertilizers that optimize nutrient uptake and minimize environmental impact. There's a growing trend towards developing specialized formulations catering to specific crop needs and soil conditions. These innovations enhance product efficacy, reduce fertilizer waste, and enhance sustainability. Furthermore, advancements in application technologies, like precision spraying and automated fertigation systems, improve nutrient delivery efficiency. This enhances yield, reduces costs, and complies with environmental regulations. The competitive landscape is shaped by ongoing efforts to improve product performance, efficiency, and environmental sustainability.
Report Segmentation & Scope
This report segments the EU liquid fertilizers market across several key parameters. Nutrient Type: Nitrogen, Potassium, Micronutrients, and Other Nutrients. Each segment exhibits unique growth projections and competitive dynamics. Ingredient Type: Synthetic and Organic fertilizers show varying market shares based on factors like price, sustainability concerns, and government regulations. Mode of Application: Foliar application, aerial application, starter solutions, fertigation, and injection into the soil. Each method has unique advantages and market penetration rates. Application: Grains and cereals, pulses and oilseeds, commercial crops, fruits and vegetables, and other applications. This highlights varying demands across different crops and their specific nutrient requirements. Growth projections, market sizes, and competitive dynamics are analyzed for each segment.
Key Drivers of EU Liquid Fertilizers Market Growth
Several key factors propel the growth of the EU liquid fertilizers market. Technological advancements in fertilizer formulations, such as controlled-release and slow-release technologies, are pivotal. These innovations optimize nutrient delivery, improve efficiency, and minimize environmental impact. Favorable government policies and incentives for sustainable agriculture significantly influence market expansion. Growing demand for higher crop yields, alongside intensified farming practices, is a significant growth driver. The increasing adoption of precision farming techniques enhances the efficient use of liquid fertilizers, thereby boosting market demand.
Challenges in the EU Liquid Fertilizers Market Sector
The EU liquid fertilizers market faces several challenges. Stringent environmental regulations on fertilizer use impose significant compliance costs, potentially impacting profitability. Fluctuations in raw material prices and supply chain disruptions can impact production costs and market stability. Intense competition among established players and new entrants necessitates continuous innovation and adaptation to retain market share. Furthermore, concerns about the environmental impact of fertilizers, particularly regarding water pollution, can pose a significant barrier to market growth. These factors necessitate efficient resource management and the adoption of environmentally sound fertilizer solutions.
Leading Players in the EU Liquid Fertilizers Market
- Rosier SA
- Nordfert
- Tessenderlo Group
- Ledra Group
- BMS Micro-nutrients NV
- BTU Center
- Van Iperen International
- Yara International ASA
- Compo Expert
- ICL Fertilizers
Key Developments in EU Liquid Fertilizers Market Sector
- August 2021: Compo Expert acquired a logistics hub and processing facility in Patras, Greece, enhancing its Greek market service.
- October 2021: BTU Center inaugurated its fourth production line in Vinnytsia, Ukraine, significantly boosting production capacity.
- May 2022: Tessenderlo Group acquired assets from Fleuren Tankopslag B.V., improving its liquid fertilizer marketing and transport capabilities.
Strategic EU Liquid Fertilizers Market Outlook
The EU liquid fertilizers market presents substantial growth opportunities, driven by the increasing adoption of sustainable and efficient agricultural practices. The focus on precision agriculture and optimized nutrient management will drive demand for innovative fertilizer formulations. Companies concentrating on developing environmentally friendly products and improving supply chain resilience will benefit from this trend. Strategic partnerships and mergers & acquisitions will play a vital role in shaping market dynamics. The market's future hinges on balancing crop production needs with environmental sustainability, presenting exciting opportunities for businesses that can successfully navigate this challenge.
EU Liquid Fertilizers Market Segmentation
- 1. Production Analysis
- 2. Consumption Analysis
- 3. Import Market Analysis (Value & Volume)
- 4. Export Market Analysis (Value & Volume)
- 5. Price Trend Analysis
EU Liquid Fertilizers Market Segmentation By Geography
-
1. North America
- 1.1. United States
- 1.2. Canada
- 1.3. Mexico
-
2. South America
- 2.1. Brazil
- 2.2. Argentina
- 2.3. Rest of South America
-
3. Europe
- 3.1. United Kingdom
- 3.2. Germany
- 3.3. France
- 3.4. Italy
- 3.5. Spain
- 3.6. Russia
- 3.7. Benelux
- 3.8. Nordics
- 3.9. Rest of Europe
-
4. Middle East & Africa
- 4.1. Turkey
- 4.2. Israel
- 4.3. GCC
- 4.4. North Africa
- 4.5. South Africa
- 4.6. Rest of Middle East & Africa
-
5. Asia Pacific
- 5.1. China
- 5.2. India
- 5.3. Japan
- 5.4. South Korea
- 5.5. ASEAN
- 5.6. Oceania
- 5.7. Rest of Asia Pacific
EU Liquid Fertilizers Market REPORT HIGHLIGHTS
| Aspects | Details |
|---|---|
| Study Period | 2019-2033 |
| Base Year | 2024 |
| Estimated Year | 2025 |
| Forecast Period | 2025-2033 |
| Historical Period | 2019-2024 |
| Growth Rate | CAGR of 4.50% from 2019-2033 |
| Segmentation |
|
Table of Contents
- 1. Introduction
- 1.1. Research Scope
- 1.2. Market Segmentation
- 1.3. Research Methodology
- 1.4. Definitions and Assumptions
- 2. Executive Summary
- 2.1. Introduction
- 3. Market Dynamics
- 3.1. Introduction
- 3.2. Market Drivers
- 3.2.1. Easy Usage and Application Procedures Suitable for European Land
- 3.3. Market Restrains
- 3.3.1. Environmental Concerns Regarding Use of Synthetic Liquid Fertilizers
- 3.4. Market Trends
- 3.4.1. Rising Importance of Precision Farming Drives the Market
- 4. Market Factor Analysis
- 4.1. Porters Five Forces
- 4.2. Supply/Value Chain
- 4.3. PESTEL analysis
- 4.4. Market Entropy
- 4.5. Patent/Trademark Analysis
- 5. Global EU Liquid Fertilizers Market Analysis, Insights and Forecast, 2019-2031
- 5.1. Market Analysis, Insights and Forecast - by Production Analysis
- 5.2. Market Analysis, Insights and Forecast - by Consumption Analysis
- 5.3. Market Analysis, Insights and Forecast - by Import Market Analysis (Value & Volume)
- 5.4. Market Analysis, Insights and Forecast - by Export Market Analysis (Value & Volume)
- 5.5. Market Analysis, Insights and Forecast - by Price Trend Analysis
- 5.6. Market Analysis, Insights and Forecast - by Region
- 5.6.1. North America
- 5.6.2. South America
- 5.6.3. Europe
- 5.6.4. Middle East & Africa
- 5.6.5. Asia Pacific
- 5.1. Market Analysis, Insights and Forecast - by Production Analysis
- 6. North America EU Liquid Fertilizers Market Analysis, Insights and Forecast, 2019-2031
- 6.1. Market Analysis, Insights and Forecast - by Production Analysis
- 6.2. Market Analysis, Insights and Forecast - by Consumption Analysis
- 6.3. Market Analysis, Insights and Forecast - by Import Market Analysis (Value & Volume)
- 6.4. Market Analysis, Insights and Forecast - by Export Market Analysis (Value & Volume)
- 6.5. Market Analysis, Insights and Forecast - by Price Trend Analysis
- 6.1. Market Analysis, Insights and Forecast - by Production Analysis
- 7. South America EU Liquid Fertilizers Market Analysis, Insights and Forecast, 2019-2031
- 7.1. Market Analysis, Insights and Forecast - by Production Analysis
- 7.2. Market Analysis, Insights and Forecast - by Consumption Analysis
- 7.3. Market Analysis, Insights and Forecast - by Import Market Analysis (Value & Volume)
- 7.4. Market Analysis, Insights and Forecast - by Export Market Analysis (Value & Volume)
- 7.5. Market Analysis, Insights and Forecast - by Price Trend Analysis
- 7.1. Market Analysis, Insights and Forecast - by Production Analysis
- 8. Europe EU Liquid Fertilizers Market Analysis, Insights and Forecast, 2019-2031
- 8.1. Market Analysis, Insights and Forecast - by Production Analysis
- 8.2. Market Analysis, Insights and Forecast - by Consumption Analysis
- 8.3. Market Analysis, Insights and Forecast - by Import Market Analysis (Value & Volume)
- 8.4. Market Analysis, Insights and Forecast - by Export Market Analysis (Value & Volume)
- 8.5. Market Analysis, Insights and Forecast - by Price Trend Analysis
- 8.1. Market Analysis, Insights and Forecast - by Production Analysis
- 9. Middle East & Africa EU Liquid Fertilizers Market Analysis, Insights and Forecast, 2019-2031
- 9.1. Market Analysis, Insights and Forecast - by Production Analysis
- 9.2. Market Analysis, Insights and Forecast - by Consumption Analysis
- 9.3. Market Analysis, Insights and Forecast - by Import Market Analysis (Value & Volume)
- 9.4. Market Analysis, Insights and Forecast - by Export Market Analysis (Value & Volume)
- 9.5. Market Analysis, Insights and Forecast - by Price Trend Analysis
- 9.1. Market Analysis, Insights and Forecast - by Production Analysis
- 10. Asia Pacific EU Liquid Fertilizers Market Analysis, Insights and Forecast, 2019-2031
- 10.1. Market Analysis, Insights and Forecast - by Production Analysis
- 10.2. Market Analysis, Insights and Forecast - by Consumption Analysis
- 10.3. Market Analysis, Insights and Forecast - by Import Market Analysis (Value & Volume)
- 10.4. Market Analysis, Insights and Forecast - by Export Market Analysis (Value & Volume)
- 10.5. Market Analysis, Insights and Forecast - by Price Trend Analysis
- 10.1. Market Analysis, Insights and Forecast - by Production Analysis
- 11. North America EU Liquid Fertilizers Market Analysis, Insights and Forecast, 2019-2031
- 11.1. Market Analysis, Insights and Forecast - By Country/Sub-region
- 11.1.1 United States
- 11.1.2 Canada
- 11.1.3 Mexico
- 12. Europe EU Liquid Fertilizers Market Analysis, Insights and Forecast, 2019-2031
- 12.1. Market Analysis, Insights and Forecast - By Country/Sub-region
- 12.1.1 Germany
- 12.1.2 United Kingdom
- 12.1.3 France
- 12.1.4 Spain
- 12.1.5 Italy
- 12.1.6 Spain
- 12.1.7 Belgium
- 12.1.8 Netherland
- 12.1.9 Nordics
- 12.1.10 Rest of Europe
- 13. Asia Pacific EU Liquid Fertilizers Market Analysis, Insights and Forecast, 2019-2031
- 13.1. Market Analysis, Insights and Forecast - By Country/Sub-region
- 13.1.1 China
- 13.1.2 Japan
- 13.1.3 India
- 13.1.4 South Korea
- 13.1.5 Southeast Asia
- 13.1.6 Australia
- 13.1.7 Indonesia
- 13.1.8 Phillipes
- 13.1.9 Singapore
- 13.1.10 Thailandc
- 13.1.11 Rest of Asia Pacific
- 14. South America EU Liquid Fertilizers Market Analysis, Insights and Forecast, 2019-2031
- 14.1. Market Analysis, Insights and Forecast - By Country/Sub-region
- 14.1.1 Brazil
- 14.1.2 Argentina
- 14.1.3 Peru
- 14.1.4 Chile
- 14.1.5 Colombia
- 14.1.6 Ecuador
- 14.1.7 Venezuela
- 14.1.8 Rest of South America
- 15. MEA EU Liquid Fertilizers Market Analysis, Insights and Forecast, 2019-2031
- 15.1. Market Analysis, Insights and Forecast - By Country/Sub-region
- 15.1.1 United Arab Emirates
- 15.1.2 Saudi Arabia
- 15.1.3 South Africa
- 15.1.4 Rest of Middle East and Africa
- 16. Competitive Analysis
- 16.1. Global Market Share Analysis 2024
- 16.2. Company Profiles
- 16.2.1 Rosier SA*List Not Exhaustive
- 16.2.1.1. Overview
- 16.2.1.2. Products
- 16.2.1.3. SWOT Analysis
- 16.2.1.4. Recent Developments
- 16.2.1.5. Financials (Based on Availability)
- 16.2.2 Nordfert
- 16.2.2.1. Overview
- 16.2.2.2. Products
- 16.2.2.3. SWOT Analysis
- 16.2.2.4. Recent Developments
- 16.2.2.5. Financials (Based on Availability)
- 16.2.3 Tessenderlo Group
- 16.2.3.1. Overview
- 16.2.3.2. Products
- 16.2.3.3. SWOT Analysis
- 16.2.3.4. Recent Developments
- 16.2.3.5. Financials (Based on Availability)
- 16.2.4 Ledra Group
- 16.2.4.1. Overview
- 16.2.4.2. Products
- 16.2.4.3. SWOT Analysis
- 16.2.4.4. Recent Developments
- 16.2.4.5. Financials (Based on Availability)
- 16.2.5 BMS Micro-nutrients NV
- 16.2.5.1. Overview
- 16.2.5.2. Products
- 16.2.5.3. SWOT Analysis
- 16.2.5.4. Recent Developments
- 16.2.5.5. Financials (Based on Availability)
- 16.2.6 BTU Center
- 16.2.6.1. Overview
- 16.2.6.2. Products
- 16.2.6.3. SWOT Analysis
- 16.2.6.4. Recent Developments
- 16.2.6.5. Financials (Based on Availability)
- 16.2.7 Van Iperen International
- 16.2.7.1. Overview
- 16.2.7.2. Products
- 16.2.7.3. SWOT Analysis
- 16.2.7.4. Recent Developments
- 16.2.7.5. Financials (Based on Availability)
- 16.2.8 Yara International ASA
- 16.2.8.1. Overview
- 16.2.8.2. Products
- 16.2.8.3. SWOT Analysis
- 16.2.8.4. Recent Developments
- 16.2.8.5. Financials (Based on Availability)
- 16.2.9 Compo Expert
- 16.2.9.1. Overview
- 16.2.9.2. Products
- 16.2.9.3. SWOT Analysis
- 16.2.9.4. Recent Developments
- 16.2.9.5. Financials (Based on Availability)
- 16.2.10 ICL Fertilizers
- 16.2.10.1. Overview
- 16.2.10.2. Products
- 16.2.10.3. SWOT Analysis
- 16.2.10.4. Recent Developments
- 16.2.10.5. Financials (Based on Availability)
- 16.2.1 Rosier SA*List Not Exhaustive
List of Figures
- Figure 1: Global EU Liquid Fertilizers Market Revenue Breakdown (Million, %) by Region 2024 & 2032
- Figure 2: North America EU Liquid Fertilizers Market Revenue (Million), by Country 2024 & 2032
- Figure 3: North America EU Liquid Fertilizers Market Revenue Share (%), by Country 2024 & 2032
- Figure 4: Europe EU Liquid Fertilizers Market Revenue (Million), by Country 2024 & 2032
- Figure 5: Europe EU Liquid Fertilizers Market Revenue Share (%), by Country 2024 & 2032
- Figure 6: Asia Pacific EU Liquid Fertilizers Market Revenue (Million), by Country 2024 & 2032
- Figure 7: Asia Pacific EU Liquid Fertilizers Market Revenue Share (%), by Country 2024 & 2032
- Figure 8: South America EU Liquid Fertilizers Market Revenue (Million), by Country 2024 & 2032
- Figure 9: South America EU Liquid Fertilizers Market Revenue Share (%), by Country 2024 & 2032
- Figure 10: MEA EU Liquid Fertilizers Market Revenue (Million), by Country 2024 & 2032
- Figure 11: MEA EU Liquid Fertilizers Market Revenue Share (%), by Country 2024 & 2032
- Figure 12: North America EU Liquid Fertilizers Market Revenue (Million), by Production Analysis 2024 & 2032
- Figure 13: North America EU Liquid Fertilizers Market Revenue Share (%), by Production Analysis 2024 & 2032
- Figure 14: North America EU Liquid Fertilizers Market Revenue (Million), by Consumption Analysis 2024 & 2032
- Figure 15: North America EU Liquid Fertilizers Market Revenue Share (%), by Consumption Analysis 2024 & 2032
- Figure 16: North America EU Liquid Fertilizers Market Revenue (Million), by Import Market Analysis (Value & Volume) 2024 & 2032
- Figure 17: North America EU Liquid Fertilizers Market Revenue Share (%), by Import Market Analysis (Value & Volume) 2024 & 2032
- Figure 18: North America EU Liquid Fertilizers Market Revenue (Million), by Export Market Analysis (Value & Volume) 2024 & 2032
- Figure 19: North America EU Liquid Fertilizers Market Revenue Share (%), by Export Market Analysis (Value & Volume) 2024 & 2032
- Figure 20: North America EU Liquid Fertilizers Market Revenue (Million), by Price Trend Analysis 2024 & 2032
- Figure 21: North America EU Liquid Fertilizers Market Revenue Share (%), by Price Trend Analysis 2024 & 2032
- Figure 22: North America EU Liquid Fertilizers Market Revenue (Million), by Country 2024 & 2032
- Figure 23: North America EU Liquid Fertilizers Market Revenue Share (%), by Country 2024 & 2032
- Figure 24: South America EU Liquid Fertilizers Market Revenue (Million), by Production Analysis 2024 & 2032
- Figure 25: South America EU Liquid Fertilizers Market Revenue Share (%), by Production Analysis 2024 & 2032
- Figure 26: South America EU Liquid Fertilizers Market Revenue (Million), by Consumption Analysis 2024 & 2032
- Figure 27: South America EU Liquid Fertilizers Market Revenue Share (%), by Consumption Analysis 2024 & 2032
- Figure 28: South America EU Liquid Fertilizers Market Revenue (Million), by Import Market Analysis (Value & Volume) 2024 & 2032
- Figure 29: South America EU Liquid Fertilizers Market Revenue Share (%), by Import Market Analysis (Value & Volume) 2024 & 2032
- Figure 30: South America EU Liquid Fertilizers Market Revenue (Million), by Export Market Analysis (Value & Volume) 2024 & 2032
- Figure 31: South America EU Liquid Fertilizers Market Revenue Share (%), by Export Market Analysis (Value & Volume) 2024 & 2032
- Figure 32: South America EU Liquid Fertilizers Market Revenue (Million), by Price Trend Analysis 2024 & 2032
- Figure 33: South America EU Liquid Fertilizers Market Revenue Share (%), by Price Trend Analysis 2024 & 2032
- Figure 34: South America EU Liquid Fertilizers Market Revenue (Million), by Country 2024 & 2032
- Figure 35: South America EU Liquid Fertilizers Market Revenue Share (%), by Country 2024 & 2032
- Figure 36: Europe EU Liquid Fertilizers Market Revenue (Million), by Production Analysis 2024 & 2032
- Figure 37: Europe EU Liquid Fertilizers Market Revenue Share (%), by Production Analysis 2024 & 2032
- Figure 38: Europe EU Liquid Fertilizers Market Revenue (Million), by Consumption Analysis 2024 & 2032
- Figure 39: Europe EU Liquid Fertilizers Market Revenue Share (%), by Consumption Analysis 2024 & 2032
- Figure 40: Europe EU Liquid Fertilizers Market Revenue (Million), by Import Market Analysis (Value & Volume) 2024 & 2032
- Figure 41: Europe EU Liquid Fertilizers Market Revenue Share (%), by Import Market Analysis (Value & Volume) 2024 & 2032
- Figure 42: Europe EU Liquid Fertilizers Market Revenue (Million), by Export Market Analysis (Value & Volume) 2024 & 2032
- Figure 43: Europe EU Liquid Fertilizers Market Revenue Share (%), by Export Market Analysis (Value & Volume) 2024 & 2032
- Figure 44: Europe EU Liquid Fertilizers Market Revenue (Million), by Price Trend Analysis 2024 & 2032
- Figure 45: Europe EU Liquid Fertilizers Market Revenue Share (%), by Price Trend Analysis 2024 & 2032
- Figure 46: Europe EU Liquid Fertilizers Market Revenue (Million), by Country 2024 & 2032
- Figure 47: Europe EU Liquid Fertilizers Market Revenue Share (%), by Country 2024 & 2032
- Figure 48: Middle East & Africa EU Liquid Fertilizers Market Revenue (Million), by Production Analysis 2024 & 2032
- Figure 49: Middle East & Africa EU Liquid Fertilizers Market Revenue Share (%), by Production Analysis 2024 & 2032
- Figure 50: Middle East & Africa EU Liquid Fertilizers Market Revenue (Million), by Consumption Analysis 2024 & 2032
- Figure 51: Middle East & Africa EU Liquid Fertilizers Market Revenue Share (%), by Consumption Analysis 2024 & 2032
- Figure 52: Middle East & Africa EU Liquid Fertilizers Market Revenue (Million), by Import Market Analysis (Value & Volume) 2024 & 2032
- Figure 53: Middle East & Africa EU Liquid Fertilizers Market Revenue Share (%), by Import Market Analysis (Value & Volume) 2024 & 2032
- Figure 54: Middle East & Africa EU Liquid Fertilizers Market Revenue (Million), by Export Market Analysis (Value & Volume) 2024 & 2032
- Figure 55: Middle East & Africa EU Liquid Fertilizers Market Revenue Share (%), by Export Market Analysis (Value & Volume) 2024 & 2032
- Figure 56: Middle East & Africa EU Liquid Fertilizers Market Revenue (Million), by Price Trend Analysis 2024 & 2032
- Figure 57: Middle East & Africa EU Liquid Fertilizers Market Revenue Share (%), by Price Trend Analysis 2024 & 2032
- Figure 58: Middle East & Africa EU Liquid Fertilizers Market Revenue (Million), by Country 2024 & 2032
- Figure 59: Middle East & Africa EU Liquid Fertilizers Market Revenue Share (%), by Country 2024 & 2032
- Figure 60: Asia Pacific EU Liquid Fertilizers Market Revenue (Million), by Production Analysis 2024 & 2032
- Figure 61: Asia Pacific EU Liquid Fertilizers Market Revenue Share (%), by Production Analysis 2024 & 2032
- Figure 62: Asia Pacific EU Liquid Fertilizers Market Revenue (Million), by Consumption Analysis 2024 & 2032
- Figure 63: Asia Pacific EU Liquid Fertilizers Market Revenue Share (%), by Consumption Analysis 2024 & 2032
- Figure 64: Asia Pacific EU Liquid Fertilizers Market Revenue (Million), by Import Market Analysis (Value & Volume) 2024 & 2032
- Figure 65: Asia Pacific EU Liquid Fertilizers Market Revenue Share (%), by Import Market Analysis (Value & Volume) 2024 & 2032
- Figure 66: Asia Pacific EU Liquid Fertilizers Market Revenue (Million), by Export Market Analysis (Value & Volume) 2024 & 2032
- Figure 67: Asia Pacific EU Liquid Fertilizers Market Revenue Share (%), by Export Market Analysis (Value & Volume) 2024 & 2032
- Figure 68: Asia Pacific EU Liquid Fertilizers Market Revenue (Million), by Price Trend Analysis 2024 & 2032
- Figure 69: Asia Pacific EU Liquid Fertilizers Market Revenue Share (%), by Price Trend Analysis 2024 & 2032
- Figure 70: Asia Pacific EU Liquid Fertilizers Market Revenue (Million), by Country 2024 & 2032
- Figure 71: Asia Pacific EU Liquid Fertilizers Market Revenue Share (%), by Country 2024 & 2032
List of Tables
- Table 1: Global EU Liquid Fertilizers Market Revenue Million Forecast, by Region 2019 & 2032
- Table 2: Global EU Liquid Fertilizers Market Revenue Million Forecast, by Production Analysis 2019 & 2032
- Table 3: Global EU Liquid Fertilizers Market Revenue Million Forecast, by Consumption Analysis 2019 & 2032
- Table 4: Global EU Liquid Fertilizers Market Revenue Million Forecast, by Import Market Analysis (Value & Volume) 2019 & 2032
- Table 5: Global EU Liquid Fertilizers Market Revenue Million Forecast, by Export Market Analysis (Value & Volume) 2019 & 2032
- Table 6: Global EU Liquid Fertilizers Market Revenue Million Forecast, by Price Trend Analysis 2019 & 2032
- Table 7: Global EU Liquid Fertilizers Market Revenue Million Forecast, by Region 2019 & 2032
- Table 8: Global EU Liquid Fertilizers Market Revenue Million Forecast, by Country 2019 & 2032
- Table 9: United States EU Liquid Fertilizers Market Revenue (Million) Forecast, by Application 2019 & 2032
- Table 10: Canada EU Liquid Fertilizers Market Revenue (Million) Forecast, by Application 2019 & 2032
- Table 11: Mexico EU Liquid Fertilizers Market Revenue (Million) Forecast, by Application 2019 & 2032
- Table 12: Global EU Liquid Fertilizers Market Revenue Million Forecast, by Country 2019 & 2032
- Table 13: Germany EU Liquid Fertilizers Market Revenue (Million) Forecast, by Application 2019 & 2032
- Table 14: United Kingdom EU Liquid Fertilizers Market Revenue (Million) Forecast, by Application 2019 & 2032
- Table 15: France EU Liquid Fertilizers Market Revenue (Million) Forecast, by Application 2019 & 2032
- Table 16: Spain EU Liquid Fertilizers Market Revenue (Million) Forecast, by Application 2019 & 2032
- Table 17: Italy EU Liquid Fertilizers Market Revenue (Million) Forecast, by Application 2019 & 2032
- Table 18: Spain EU Liquid Fertilizers Market Revenue (Million) Forecast, by Application 2019 & 2032
- Table 19: Belgium EU Liquid Fertilizers Market Revenue (Million) Forecast, by Application 2019 & 2032
- Table 20: Netherland EU Liquid Fertilizers Market Revenue (Million) Forecast, by Application 2019 & 2032
- Table 21: Nordics EU Liquid Fertilizers Market Revenue (Million) Forecast, by Application 2019 & 2032
- Table 22: Rest of Europe EU Liquid Fertilizers Market Revenue (Million) Forecast, by Application 2019 & 2032
- Table 23: Global EU Liquid Fertilizers Market Revenue Million Forecast, by Country 2019 & 2032
- Table 24: China EU Liquid Fertilizers Market Revenue (Million) Forecast, by Application 2019 & 2032
- Table 25: Japan EU Liquid Fertilizers Market Revenue (Million) Forecast, by Application 2019 & 2032
- Table 26: India EU Liquid Fertilizers Market Revenue (Million) Forecast, by Application 2019 & 2032
- Table 27: South Korea EU Liquid Fertilizers Market Revenue (Million) Forecast, by Application 2019 & 2032
- Table 28: Southeast Asia EU Liquid Fertilizers Market Revenue (Million) Forecast, by Application 2019 & 2032
- Table 29: Australia EU Liquid Fertilizers Market Revenue (Million) Forecast, by Application 2019 & 2032
- Table 30: Indonesia EU Liquid Fertilizers Market Revenue (Million) Forecast, by Application 2019 & 2032
- Table 31: Phillipes EU Liquid Fertilizers Market Revenue (Million) Forecast, by Application 2019 & 2032
- Table 32: Singapore EU Liquid Fertilizers Market Revenue (Million) Forecast, by Application 2019 & 2032
- Table 33: Thailandc EU Liquid Fertilizers Market Revenue (Million) Forecast, by Application 2019 & 2032
- Table 34: Rest of Asia Pacific EU Liquid Fertilizers Market Revenue (Million) Forecast, by Application 2019 & 2032
- Table 35: Global EU Liquid Fertilizers Market Revenue Million Forecast, by Country 2019 & 2032
- Table 36: Brazil EU Liquid Fertilizers Market Revenue (Million) Forecast, by Application 2019 & 2032
- Table 37: Argentina EU Liquid Fertilizers Market Revenue (Million) Forecast, by Application 2019 & 2032
- Table 38: Peru EU Liquid Fertilizers Market Revenue (Million) Forecast, by Application 2019 & 2032
- Table 39: Chile EU Liquid Fertilizers Market Revenue (Million) Forecast, by Application 2019 & 2032
- Table 40: Colombia EU Liquid Fertilizers Market Revenue (Million) Forecast, by Application 2019 & 2032
- Table 41: Ecuador EU Liquid Fertilizers Market Revenue (Million) Forecast, by Application 2019 & 2032
- Table 42: Venezuela EU Liquid Fertilizers Market Revenue (Million) Forecast, by Application 2019 & 2032
- Table 43: Rest of South America EU Liquid Fertilizers Market Revenue (Million) Forecast, by Application 2019 & 2032
- Table 44: Global EU Liquid Fertilizers Market Revenue Million Forecast, by Country 2019 & 2032
- Table 45: United Arab Emirates EU Liquid Fertilizers Market Revenue (Million) Forecast, by Application 2019 & 2032
- Table 46: Saudi Arabia EU Liquid Fertilizers Market Revenue (Million) Forecast, by Application 2019 & 2032
- Table 47: South Africa EU Liquid Fertilizers Market Revenue (Million) Forecast, by Application 2019 & 2032
- Table 48: Rest of Middle East and Africa EU Liquid Fertilizers Market Revenue (Million) Forecast, by Application 2019 & 2032
- Table 49: Global EU Liquid Fertilizers Market Revenue Million Forecast, by Production Analysis 2019 & 2032
- Table 50: Global EU Liquid Fertilizers Market Revenue Million Forecast, by Consumption Analysis 2019 & 2032
- Table 51: Global EU Liquid Fertilizers Market Revenue Million Forecast, by Import Market Analysis (Value & Volume) 2019 & 2032
- Table 52: Global EU Liquid Fertilizers Market Revenue Million Forecast, by Export Market Analysis (Value & Volume) 2019 & 2032
- Table 53: Global EU Liquid Fertilizers Market Revenue Million Forecast, by Price Trend Analysis 2019 & 2032
- Table 54: Global EU Liquid Fertilizers Market Revenue Million Forecast, by Country 2019 & 2032
- Table 55: United States EU Liquid Fertilizers Market Revenue (Million) Forecast, by Application 2019 & 2032
- Table 56: Canada EU Liquid Fertilizers Market Revenue (Million) Forecast, by Application 2019 & 2032
- Table 57: Mexico EU Liquid Fertilizers Market Revenue (Million) Forecast, by Application 2019 & 2032
- Table 58: Global EU Liquid Fertilizers Market Revenue Million Forecast, by Production Analysis 2019 & 2032
- Table 59: Global EU Liquid Fertilizers Market Revenue Million Forecast, by Consumption Analysis 2019 & 2032
- Table 60: Global EU Liquid Fertilizers Market Revenue Million Forecast, by Import Market Analysis (Value & Volume) 2019 & 2032
- Table 61: Global EU Liquid Fertilizers Market Revenue Million Forecast, by Export Market Analysis (Value & Volume) 2019 & 2032
- Table 62: Global EU Liquid Fertilizers Market Revenue Million Forecast, by Price Trend Analysis 2019 & 2032
- Table 63: Global EU Liquid Fertilizers Market Revenue Million Forecast, by Country 2019 & 2032
- Table 64: Brazil EU Liquid Fertilizers Market Revenue (Million) Forecast, by Application 2019 & 2032
- Table 65: Argentina EU Liquid Fertilizers Market Revenue (Million) Forecast, by Application 2019 & 2032
- Table 66: Rest of South America EU Liquid Fertilizers Market Revenue (Million) Forecast, by Application 2019 & 2032
- Table 67: Global EU Liquid Fertilizers Market Revenue Million Forecast, by Production Analysis 2019 & 2032
- Table 68: Global EU Liquid Fertilizers Market Revenue Million Forecast, by Consumption Analysis 2019 & 2032
- Table 69: Global EU Liquid Fertilizers Market Revenue Million Forecast, by Import Market Analysis (Value & Volume) 2019 & 2032
- Table 70: Global EU Liquid Fertilizers Market Revenue Million Forecast, by Export Market Analysis (Value & Volume) 2019 & 2032
- Table 71: Global EU Liquid Fertilizers Market Revenue Million Forecast, by Price Trend Analysis 2019 & 2032
- Table 72: Global EU Liquid Fertilizers Market Revenue Million Forecast, by Country 2019 & 2032
- Table 73: United Kingdom EU Liquid Fertilizers Market Revenue (Million) Forecast, by Application 2019 & 2032
- Table 74: Germany EU Liquid Fertilizers Market Revenue (Million) Forecast, by Application 2019 & 2032
- Table 75: France EU Liquid Fertilizers Market Revenue (Million) Forecast, by Application 2019 & 2032
- Table 76: Italy EU Liquid Fertilizers Market Revenue (Million) Forecast, by Application 2019 & 2032
- Table 77: Spain EU Liquid Fertilizers Market Revenue (Million) Forecast, by Application 2019 & 2032
- Table 78: Russia EU Liquid Fertilizers Market Revenue (Million) Forecast, by Application 2019 & 2032
- Table 79: Benelux EU Liquid Fertilizers Market Revenue (Million) Forecast, by Application 2019 & 2032
- Table 80: Nordics EU Liquid Fertilizers Market Revenue (Million) Forecast, by Application 2019 & 2032
- Table 81: Rest of Europe EU Liquid Fertilizers Market Revenue (Million) Forecast, by Application 2019 & 2032
- Table 82: Global EU Liquid Fertilizers Market Revenue Million Forecast, by Production Analysis 2019 & 2032
- Table 83: Global EU Liquid Fertilizers Market Revenue Million Forecast, by Consumption Analysis 2019 & 2032
- Table 84: Global EU Liquid Fertilizers Market Revenue Million Forecast, by Import Market Analysis (Value & Volume) 2019 & 2032
- Table 85: Global EU Liquid Fertilizers Market Revenue Million Forecast, by Export Market Analysis (Value & Volume) 2019 & 2032
- Table 86: Global EU Liquid Fertilizers Market Revenue Million Forecast, by Price Trend Analysis 2019 & 2032
- Table 87: Global EU Liquid Fertilizers Market Revenue Million Forecast, by Country 2019 & 2032
- Table 88: Turkey EU Liquid Fertilizers Market Revenue (Million) Forecast, by Application 2019 & 2032
- Table 89: Israel EU Liquid Fertilizers Market Revenue (Million) Forecast, by Application 2019 & 2032
- Table 90: GCC EU Liquid Fertilizers Market Revenue (Million) Forecast, by Application 2019 & 2032
- Table 91: North Africa EU Liquid Fertilizers Market Revenue (Million) Forecast, by Application 2019 & 2032
- Table 92: South Africa EU Liquid Fertilizers Market Revenue (Million) Forecast, by Application 2019 & 2032
- Table 93: Rest of Middle East & Africa EU Liquid Fertilizers Market Revenue (Million) Forecast, by Application 2019 & 2032
- Table 94: Global EU Liquid Fertilizers Market Revenue Million Forecast, by Production Analysis 2019 & 2032
- Table 95: Global EU Liquid Fertilizers Market Revenue Million Forecast, by Consumption Analysis 2019 & 2032
- Table 96: Global EU Liquid Fertilizers Market Revenue Million Forecast, by Import Market Analysis (Value & Volume) 2019 & 2032
- Table 97: Global EU Liquid Fertilizers Market Revenue Million Forecast, by Export Market Analysis (Value & Volume) 2019 & 2032
- Table 98: Global EU Liquid Fertilizers Market Revenue Million Forecast, by Price Trend Analysis 2019 & 2032
- Table 99: Global EU Liquid Fertilizers Market Revenue Million Forecast, by Country 2019 & 2032
- Table 100: China EU Liquid Fertilizers Market Revenue (Million) Forecast, by Application 2019 & 2032
- Table 101: India EU Liquid Fertilizers Market Revenue (Million) Forecast, by Application 2019 & 2032
- Table 102: Japan EU Liquid Fertilizers Market Revenue (Million) Forecast, by Application 2019 & 2032
- Table 103: South Korea EU Liquid Fertilizers Market Revenue (Million) Forecast, by Application 2019 & 2032
- Table 104: ASEAN EU Liquid Fertilizers Market Revenue (Million) Forecast, by Application 2019 & 2032
- Table 105: Oceania EU Liquid Fertilizers Market Revenue (Million) Forecast, by Application 2019 & 2032
- Table 106: Rest of Asia Pacific EU Liquid Fertilizers Market Revenue (Million) Forecast, by Application 2019 & 2032
Frequently Asked Questions
1. What is the projected Compound Annual Growth Rate (CAGR) of the EU Liquid Fertilizers Market?
The projected CAGR is approximately 4.50%.
2. Which companies are prominent players in the EU Liquid Fertilizers Market?
Key companies in the market include Rosier SA*List Not Exhaustive, Nordfert, Tessenderlo Group, Ledra Group, BMS Micro-nutrients NV, BTU Center, Van Iperen International, Yara International ASA, Compo Expert, ICL Fertilizers.
3. What are the main segments of the EU Liquid Fertilizers Market?
The market segments include Production Analysis, Consumption Analysis, Import Market Analysis (Value & Volume), Export Market Analysis (Value & Volume), Price Trend Analysis.
4. Can you provide details about the market size?
The market size is estimated to be USD XX Million as of 2022.
5. What are some drivers contributing to market growth?
Easy Usage and Application Procedures Suitable for European Land.
6. What are the notable trends driving market growth?
Rising Importance of Precision Farming Drives the Market.
7. Are there any restraints impacting market growth?
Environmental Concerns Regarding Use of Synthetic Liquid Fertilizers.
8. Can you provide examples of recent developments in the market?
May 2022: Tessenderlo Group successfully acquired assets from Fleuren Tankopslag B.V., a tank storage and transshipment company based in the port of Cuijk, Netherlands. This strategic move enhances their capacity to market and transport liquid fertilizer products throughout the region.
9. What pricing options are available for accessing the report?
Pricing options include single-user, multi-user, and enterprise licenses priced at USD 4750, USD 5250, and USD 8750 respectively.
10. Is the market size provided in terms of value or volume?
The market size is provided in terms of value, measured in Million.
11. Are there any specific market keywords associated with the report?
Yes, the market keyword associated with the report is "EU Liquid Fertilizers Market," which aids in identifying and referencing the specific market segment covered.
12. How do I determine which pricing option suits my needs best?
The pricing options vary based on user requirements and access needs. Individual users may opt for single-user licenses, while businesses requiring broader access may choose multi-user or enterprise licenses for cost-effective access to the report.
13. Are there any additional resources or data provided in the EU Liquid Fertilizers Market report?
While the report offers comprehensive insights, it's advisable to review the specific contents or supplementary materials provided to ascertain if additional resources or data are available.
14. How can I stay updated on further developments or reports in the EU Liquid Fertilizers Market?
To stay informed about further developments, trends, and reports in the EU Liquid Fertilizers Market, consider subscribing to industry newsletters, following relevant companies and organizations, or regularly checking reputable industry news sources and publications.
Methodology
Step 1 - Identification of Relevant Samples Size from Population Database


Step 2 - Approaches for Defining Global Market Size (Value, Volume* & Price*)

Note*: In applicable scenarios
Step 3 - Data Sources
Primary Research
- Web Analytics
- Survey Reports
- Research Institute
- Latest Research Reports
- Opinion Leaders
Secondary Research
- Annual Reports
- White Paper
- Latest Press Release
- Industry Association
- Paid Database
- Investor Presentations

Step 4 - Data Triangulation
Involves using different sources of information in order to increase the validity of a study
These sources are likely to be stakeholders in a program - participants, other researchers, program staff, other community members, and so on.
Then we put all data in single framework & apply various statistical tools to find out the dynamic on the market.
During the analysis stage, feedback from the stakeholder groups would be compared to determine areas of agreement as well as areas of divergence


