

Key Insights
The global market for In-Flight Entertainment (IFE) displays is poised for substantial expansion, driven by increasing passenger demand for enhanced cabin experiences and the continuous evolution of display technologies. With a current market size of 6146.29 million USD in 2024, the sector is projected to grow at a robust Compound Annual Growth Rate (CAGR) of 8.4% through 2033. This growth is underpinned by airlines' strategic investments in modernizing their fleets to attract and retain passengers, especially in the competitive long-haul market. The demand for higher resolution, larger screen sizes, and more interactive display solutions for both small and large airliners is a primary catalyst. The integration of advanced features such as high-definition content, personalized entertainment options, and seamless connectivity further fuels this upward trajectory, making IFE displays a critical component of the modern passenger journey.
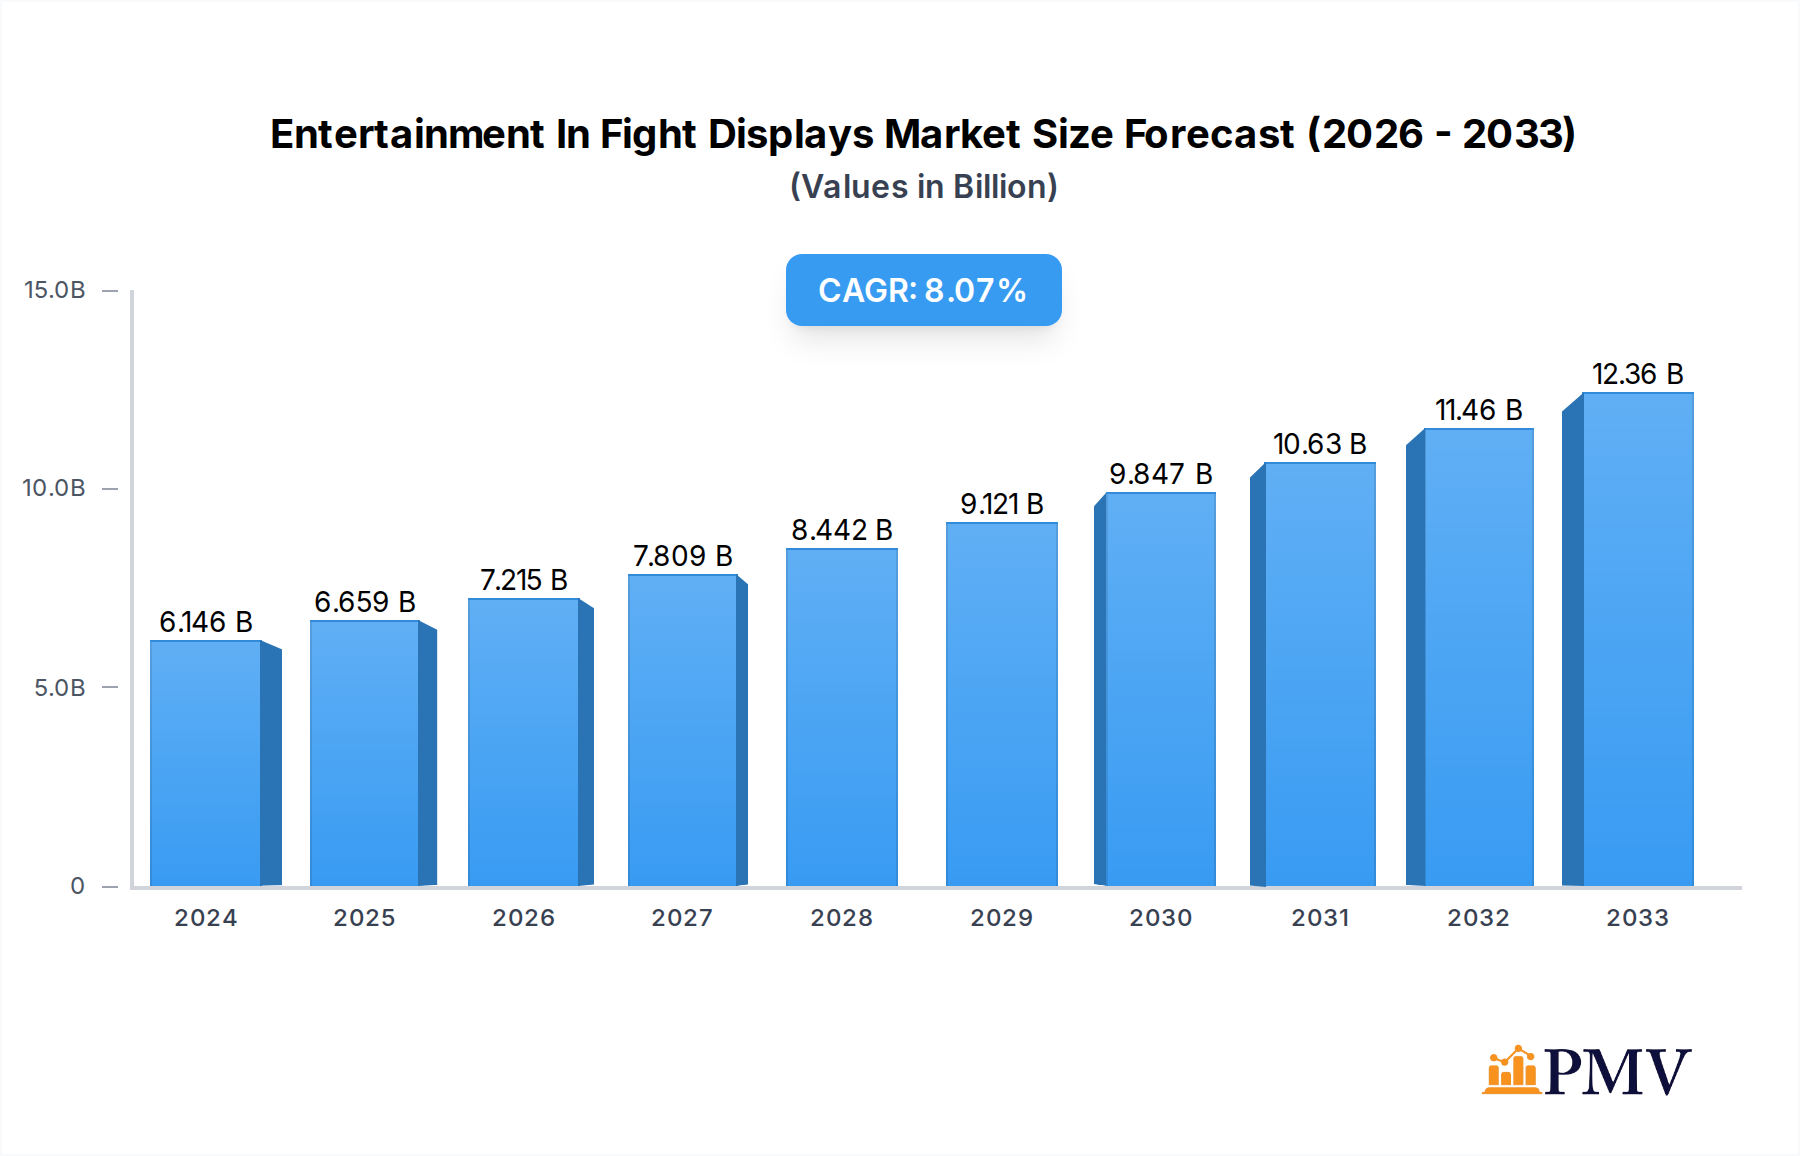
Entertainment In Fight Displays Market Size (In Billion)
The IFE display market is characterized by a dynamic interplay of technological advancements and evolving passenger expectations. While the adoption of touch-screen interfaces continues to gain traction, traditional push-button systems still hold relevance in certain segments, offering a balance of functionality and durability. Key market drivers include the increasing disposable income, leading to more air travel, and the consistent innovation from leading companies like Panasonic Avionics Corporation, Thales, and others, who are pushing the boundaries of what's possible in cabin entertainment. However, significant capital expenditure for fleet retrofitting and the inherent lengthy aircraft certification processes can pose as restraints. Despite these challenges, the Asia Pacific region, particularly China and India, along with North America, are expected to be significant growth engines due to expanding air travel infrastructure and a burgeoning middle class. The continued focus on enhancing passenger comfort and providing a premium travel experience will ensure the sustained growth and innovation within the IFE display market.

Entertainment In Fight Displays Company Market Share
Entertainment In-Flight Displays Market: Comprehensive Industry Analysis 2019-2033
This in-depth report provides a detailed analysis of the global Entertainment In-Flight Displays market, a critical component of modern aviation passenger experience. Covering the period from 2019 to 2033, with a base year of 2025 and a forecast period extending to 2033, this study offers unparalleled insights into market structure, competitive dynamics, emerging trends, and future outlook. We meticulously examine key industry developments, technological innovations, and market segmentation to equip stakeholders with actionable intelligence for strategic decision-making in this rapidly evolving sector.
Entertainment In-Flight Displays Market Structure & Competitive Dynamics
The Entertainment In-Flight Displays market exhibits a moderately concentrated structure, characterized by a mix of established aerospace giants and specialized avionics providers. Key players like THALES, PANASONIC AVIONICS CORPORATION, and Flight Display Systems hold significant market share, estimated in the hundreds of millions of dollars, driving innovation and setting industry benchmarks. However, the presence of agile and emerging companies such as Imagik International, digEcor, and Skycast Solutions fosters a competitive ecosystem, pushing the boundaries of display technology and passenger engagement. The innovation ecosystem thrives on continuous R&D investment, aiming to integrate advanced features like augmented reality overlays and personalized content delivery. Regulatory frameworks, primarily driven by aviation safety standards and passenger comfort regulations, play a crucial role in shaping product development and market entry. Product substitutes, while limited in core functionality, include personal electronic devices and shared entertainment systems, necessitating a focus on superior integrated display solutions. End-user trends are increasingly leaning towards highly customizable, interactive, and high-definition in-flight entertainment experiences. Mergers and acquisitions (M&A) activities are a notable feature, with estimated deal values in the tens to hundreds of millions, as larger companies seek to acquire specialized technologies or expand their market reach. For instance, acquisitions of innovative smaller firms by established manufacturers are common, consolidating expertise and market power.
Entertainment In-Flight Displays Industry Trends & Insights
The Entertainment In-Flight Displays market is experiencing robust growth, driven by a confluence of factors including escalating passenger expectations for enhanced in-flight experiences and the continuous technological advancements in display technology. The market is projected to witness a Compound Annual Growth Rate (CAGR) of approximately 8.5% during the forecast period. This growth is underpinned by the increasing demand for lighter, thinner, and more energy-efficient displays, coupled with advancements in touch screen technology and high-resolution imaging. The integration of Artificial Intelligence (AI) for personalized content recommendations and interactive features is becoming a significant trend. Furthermore, the growing adoption of connected aircraft technologies is enabling seamless content streaming and real-time updates, further enhancing the passenger journey. Consumer preferences are shifting towards immersive and personalized entertainment, pushing manufacturers to develop displays with superior visual fidelity, faster response times, and intuitive user interfaces. The competitive landscape is intensifying, with companies focusing on differentiation through unique software capabilities, robust hardware design, and comprehensive customer support. Market penetration for advanced in-flight display systems is steadily increasing, particularly with the rise of new aircraft deliveries and cabin retrofitting initiatives across the global airline industry. The emphasis on reducing aircraft weight and improving fuel efficiency also drives the adoption of new materials and display technologies. The development of flexible and curved displays is also on the horizon, offering new aesthetic possibilities for cabin interiors.
Dominant Markets & Segments in Entertainment In-Flight Displays
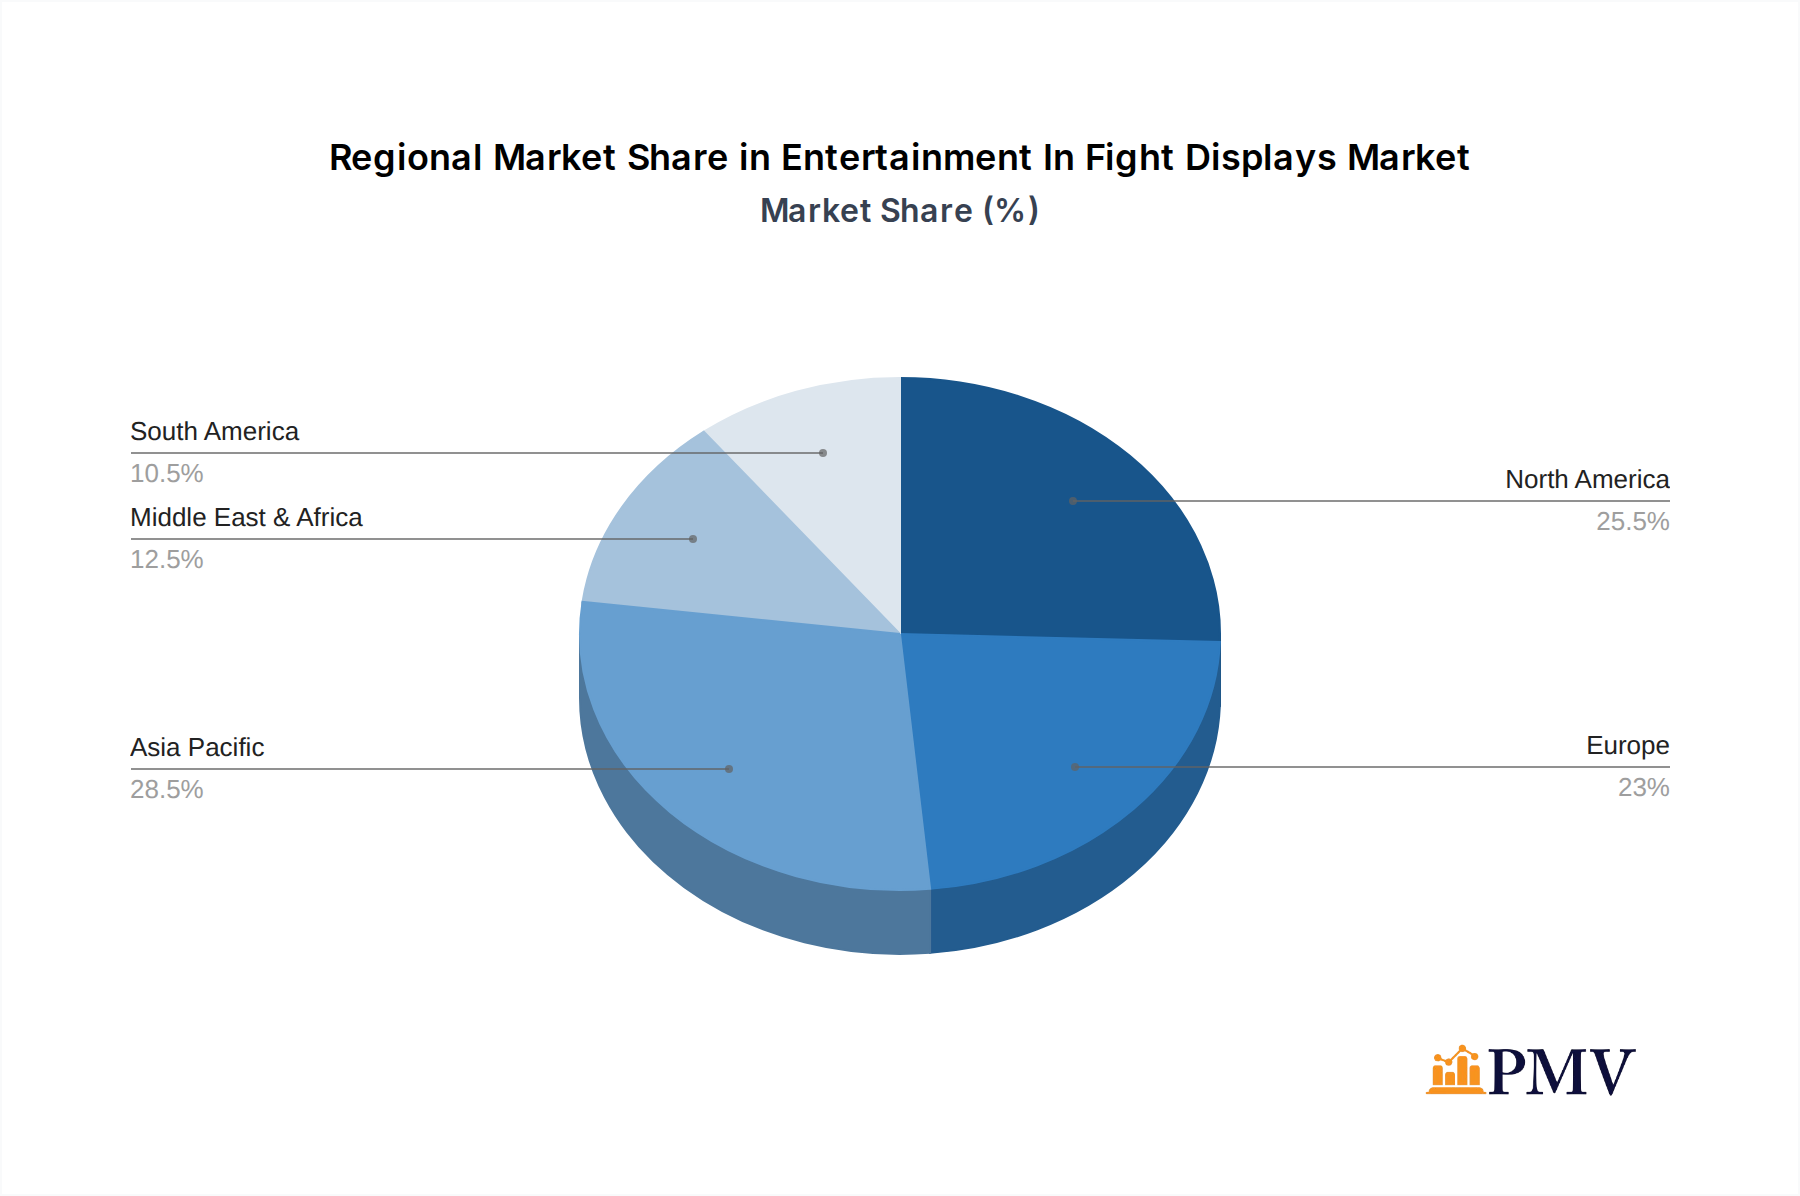
The global Entertainment In-Flight Displays market is dominated by several key regions and segments, each contributing significantly to overall market expansion.
Leading Region: North America currently holds the largest market share, driven by the presence of major airlines, a high volume of air travel, and a strong emphasis on passenger comfort and technological innovation. The region's economic policies actively support aviation infrastructure development, and airlines are quick to adopt new technologies to enhance their competitive edge.
- Key Drivers:
- High disposable income and a culture of prioritizing travel experiences.
- Presence of leading aircraft manufacturers and avionics suppliers.
- Robust airline fleet modernization programs.
- Strong regulatory support for aviation safety and passenger satisfaction.
Leading Aircraft Application: The Large Airliner segment represents the largest market for entertainment in-flight displays. These aircraft, typically used for long-haul international flights, offer greater cabin space and a higher passenger capacity, necessitating more sophisticated and numerous display systems. Airlines operating large airliners are investing heavily in premium in-flight entertainment to attract and retain passengers on extended journeys. The average revenue generated from display systems per large airliner is significantly higher than for smaller aircraft.
- Dominance Analysis: The sheer number of large airliners in operation globally, coupled with the higher unit cost of advanced display systems for these aircraft, solidifies its dominance. Airlines are increasingly fitting these aircraft with state-of-the-art touch-screen displays, offering a wide array of entertainment options, connectivity features, and personalized services. The competition among airlines to offer superior in-flight experiences on long-haul routes directly translates into demand for premium entertainment display solutions.
Leading Display Type: The Touch display type segment is experiencing the most rapid growth and holds a dominant position. Passengers have become accustomed to intuitive touch interfaces in their daily lives, and this expectation extends to the in-flight experience. Touch displays offer a more engaging and user-friendly interface compared to traditional push-button systems, allowing for easier navigation of entertainment menus, control of cabin lighting, and interaction with flight information. The market penetration of touch displays in new aircraft deliveries is approaching 90%.
- Dominance Analysis: The enhanced user experience and interactive capabilities of touch displays are paramount. Passengers can effortlessly browse movies, play games, and access other features with simple gestures. This technological shift has made touch displays the preferred choice for airlines aiming to provide a modern and engaging passenger journey. The development of more responsive, durable, and cost-effective touch screen technologies has further accelerated their adoption.
Entertainment In-Flight Displays Product Innovations
Recent product innovations in Entertainment In-Flight Displays focus on enhancing passenger experience through advanced visual technologies and intuitive user interfaces. Developments include ultra-high-definition (UHD) displays with superior color accuracy and brightness, catering to the demand for premium viewing. Integration of augmented reality (AR) capabilities for interactive maps and destination information, along with personalized content algorithms powered by AI, are gaining traction. These innovations provide a significant competitive advantage by offering airlines a more engaging and differentiated passenger journey. The market fit is evident in the growing airline demand for displays that are not only visually appealing but also lightweight, energy-efficient, and durable, meeting stringent aerospace standards.
Report Segmentation & Scope
This report segments the Entertainment In-Flight Displays market by application and display type.
Small Airliner: This segment encompasses display systems designed for regional jets and smaller aircraft. While the number of displays per aircraft is lower, there is a growing demand for cost-effective and reliable solutions that enhance passenger comfort on shorter routes. Market growth in this segment is projected to be approximately 6% annually, with market sizes estimated in the hundreds of millions of dollars. Competitive dynamics focus on value and operational efficiency.
Large Airliner: This segment, as detailed previously, dominates the market due to the high volume of aircraft and the demand for advanced, premium display solutions. Growth projections for this segment are robust, estimated at over 9% annually, with market sizes reaching billions of dollars. Competitive dynamics are driven by technological sophistication, passenger experience, and integration capabilities.
Touch Display: This segment is characterized by displays operated via touch interfaces. It is the fastest-growing segment, with projections of over 10% annual growth and market sizes in the billions. Competitive dynamics revolve around responsiveness, intuitive user interfaces, and integration with advanced software features.
Push Button Display: This segment includes displays operated by physical buttons. While its market share is declining, it remains relevant for certain cost-sensitive applications or older aircraft. Growth is projected to be less than 3% annually, with market sizes in the hundreds of millions. Competitive dynamics focus on reliability and cost-effectiveness.
Key Drivers of Entertainment In-Flight Displays Growth
Several key factors are propelling the growth of the Entertainment In-Flight Displays market. The escalating demand for enhanced passenger experience is paramount, with airlines investing in premium in-flight entertainment (IFE) to differentiate themselves. Technological advancements, including higher resolution displays, improved touch responsiveness, and the integration of AI for personalized content, are significant drivers. The increasing number of air travel passengers globally, particularly on long-haul routes, directly translates into higher demand for IFE systems. Furthermore, the ongoing fleet modernization programs by airlines worldwide, incorporating new aircraft with advanced IFE capabilities, are substantial growth accelerators. The development of lighter and more energy-efficient displays also contributes by aiding in fuel cost reduction for airlines.
Challenges in the Entertainment In-Flight Displays Sector
Despite the positive growth trajectory, the Entertainment In-Flight Displays sector faces several challenges. High development and manufacturing costs associated with aerospace-grade components and stringent certification processes pose significant barriers. Supply chain disruptions, exacerbated by global events, can impact production timelines and component availability, leading to potential cost overruns. Intense competition from both established players and new entrants can lead to price pressures and reduced profit margins. Additionally, the rapid pace of technological obsolescence necessitates continuous R&D investment to remain competitive, adding to operational expenses. The evolving cybersecurity landscape also presents a challenge, requiring robust security measures for connected IFE systems.
Leading Players in the Entertainment In-Flight Displays Market
- Video Technology Services
- THALES
- OXYTRONIC
- PANASONIC AVIONICS CORPORATION
- Imagik International
- InFlight Entertainment Products
- RDDS Avionics Limited
- Rosen Aviation
- Moving Terrain Air Navigation Systems AG
- Northern Avionics s.r.l
- Sky Definition Aero Systems LLC
- Donica Aviation Engineering
- Flight Display Systems
- Aircraft Cabin Systems
- digEcor
- Skycast Solutions
Key Developments in Entertainment In-Flight Displays Sector
- 2023/09: THALES launches a new generation of ultra-slim, high-resolution IFE displays for narrow-body aircraft, enhancing passenger comfort and reducing weight by an estimated 15%.
- 2024/01: PANASONIC AVIONICS CORPORATION announces strategic partnerships to integrate advanced AI-powered content recommendation engines into their IFE platforms, offering highly personalized passenger experiences.
- 2024/03: digEcor introduces a new modular IFE system designed for greater flexibility and easier maintenance, targeting the regional aircraft segment.
- 2024/07: Flight Display Systems unveils an innovative AR-enhanced navigation display that provides pilots with real-time terrain and obstacle information, improving situational awareness.
- 2024/11: Imagik International showcases flexible OLED display prototypes, hinting at future cabin design possibilities and immersive entertainment integration.
Strategic Entertainment In-Flight Displays Market Outlook
The strategic outlook for the Entertainment In-Flight Displays market remains exceptionally bright, driven by an unwavering focus on passenger experience and rapid technological advancements. The increasing adoption of connected aircraft technologies will further unlock opportunities for real-time content delivery, personalized services, and data analytics, enabling airlines to better understand and cater to passenger preferences. The trend towards lighter, more energy-efficient, and environmentally friendly display solutions will continue to shape product development. Strategic opportunities lie in the development of integrated cabin solutions that combine IFE with other cabin systems, offering airlines a holistic approach to passenger comfort and connectivity. Companies that can effectively leverage AI, AR, and advanced display technologies will be well-positioned for sustained growth and market leadership. The potential for significant revenue growth is estimated in the billions of dollars over the forecast period.
Entertainment In Fight Displays Segmentation
-
1. Application
- 1.1. Small Airliner
- 1.2. Large Airliner
-
2. Type
- 2.1. Touch
- 2.2. Push Button
Entertainment In Fight Displays Segmentation By Geography
-
1. North America
- 1.1. United States
- 1.2. Canada
- 1.3. Mexico
-
2. South America
- 2.1. Brazil
- 2.2. Argentina
- 2.3. Rest of South America
-
3. Europe
- 3.1. United Kingdom
- 3.2. Germany
- 3.3. France
- 3.4. Italy
- 3.5. Spain
- 3.6. Russia
- 3.7. Benelux
- 3.8. Nordics
- 3.9. Rest of Europe
-
4. Middle East & Africa
- 4.1. Turkey
- 4.2. Israel
- 4.3. GCC
- 4.4. North Africa
- 4.5. South Africa
- 4.6. Rest of Middle East & Africa
-
5. Asia Pacific
- 5.1. China
- 5.2. India
- 5.3. Japan
- 5.4. South Korea
- 5.5. ASEAN
- 5.6. Oceania
- 5.7. Rest of Asia Pacific
Entertainment In Fight Displays Regional Market Share
Geographic Coverage of Entertainment In Fight Displays
Entertainment In Fight Displays REPORT HIGHLIGHTS
| Aspects | Details |
|---|---|
| Study Period | 2020-2034 |
| Base Year | 2025 |
| Estimated Year | 2026 |
| Forecast Period | 2026-2034 |
| Historical Period | 2020-2025 |
| Growth Rate | CAGR of 8.4% from 2020-2034 |
| Segmentation |
|
Table of Contents
- 1. Introduction
- 1.1. Research Scope
- 1.2. Market Segmentation
- 1.3. Research Methodology
- 1.4. Definitions and Assumptions
- 2. Executive Summary
- 2.1. Introduction
- 3. Market Dynamics
- 3.1. Introduction
- 3.2. Market Drivers
- 3.3. Market Restrains
- 3.4. Market Trends
- 4. Market Factor Analysis
- 4.1. Porters Five Forces
- 4.2. Supply/Value Chain
- 4.3. PESTEL analysis
- 4.4. Market Entropy
- 4.5. Patent/Trademark Analysis
- 5. Global Entertainment In Fight Displays Analysis, Insights and Forecast, 2020-2032
- 5.1. Market Analysis, Insights and Forecast - by Application
- 5.1.1. Small Airliner
- 5.1.2. Large Airliner
- 5.2. Market Analysis, Insights and Forecast - by Type
- 5.2.1. Touch
- 5.2.2. Push Button
- 5.3. Market Analysis, Insights and Forecast - by Region
- 5.3.1. North America
- 5.3.2. South America
- 5.3.3. Europe
- 5.3.4. Middle East & Africa
- 5.3.5. Asia Pacific
- 5.1. Market Analysis, Insights and Forecast - by Application
- 6. North America Entertainment In Fight Displays Analysis, Insights and Forecast, 2020-2032
- 6.1. Market Analysis, Insights and Forecast - by Application
- 6.1.1. Small Airliner
- 6.1.2. Large Airliner
- 6.2. Market Analysis, Insights and Forecast - by Type
- 6.2.1. Touch
- 6.2.2. Push Button
- 6.1. Market Analysis, Insights and Forecast - by Application
- 7. South America Entertainment In Fight Displays Analysis, Insights and Forecast, 2020-2032
- 7.1. Market Analysis, Insights and Forecast - by Application
- 7.1.1. Small Airliner
- 7.1.2. Large Airliner
- 7.2. Market Analysis, Insights and Forecast - by Type
- 7.2.1. Touch
- 7.2.2. Push Button
- 7.1. Market Analysis, Insights and Forecast - by Application
- 8. Europe Entertainment In Fight Displays Analysis, Insights and Forecast, 2020-2032
- 8.1. Market Analysis, Insights and Forecast - by Application
- 8.1.1. Small Airliner
- 8.1.2. Large Airliner
- 8.2. Market Analysis, Insights and Forecast - by Type
- 8.2.1. Touch
- 8.2.2. Push Button
- 8.1. Market Analysis, Insights and Forecast - by Application
- 9. Middle East & Africa Entertainment In Fight Displays Analysis, Insights and Forecast, 2020-2032
- 9.1. Market Analysis, Insights and Forecast - by Application
- 9.1.1. Small Airliner
- 9.1.2. Large Airliner
- 9.2. Market Analysis, Insights and Forecast - by Type
- 9.2.1. Touch
- 9.2.2. Push Button
- 9.1. Market Analysis, Insights and Forecast - by Application
- 10. Asia Pacific Entertainment In Fight Displays Analysis, Insights and Forecast, 2020-2032
- 10.1. Market Analysis, Insights and Forecast - by Application
- 10.1.1. Small Airliner
- 10.1.2. Large Airliner
- 10.2. Market Analysis, Insights and Forecast - by Type
- 10.2.1. Touch
- 10.2.2. Push Button
- 10.1. Market Analysis, Insights and Forecast - by Application
- 11. Competitive Analysis
- 11.1. Global Market Share Analysis 2025
- 11.2. Company Profiles
- 11.2.1 Video Technology Services
- 11.2.1.1. Overview
- 11.2.1.2. Products
- 11.2.1.3. SWOT Analysis
- 11.2.1.4. Recent Developments
- 11.2.1.5. Financials (Based on Availability)
- 11.2.2 THALES
- 11.2.2.1. Overview
- 11.2.2.2. Products
- 11.2.2.3. SWOT Analysis
- 11.2.2.4. Recent Developments
- 11.2.2.5. Financials (Based on Availability)
- 11.2.3 OXYTRONIC
- 11.2.3.1. Overview
- 11.2.3.2. Products
- 11.2.3.3. SWOT Analysis
- 11.2.3.4. Recent Developments
- 11.2.3.5. Financials (Based on Availability)
- 11.2.4 PANASONIC AVIONICS CORPORATION
- 11.2.4.1. Overview
- 11.2.4.2. Products
- 11.2.4.3. SWOT Analysis
- 11.2.4.4. Recent Developments
- 11.2.4.5. Financials (Based on Availability)
- 11.2.5 Imagik International
- 11.2.5.1. Overview
- 11.2.5.2. Products
- 11.2.5.3. SWOT Analysis
- 11.2.5.4. Recent Developments
- 11.2.5.5. Financials (Based on Availability)
- 11.2.6 InFlight Entertainment Products
- 11.2.6.1. Overview
- 11.2.6.2. Products
- 11.2.6.3. SWOT Analysis
- 11.2.6.4. Recent Developments
- 11.2.6.5. Financials (Based on Availability)
- 11.2.7 RDDS Avionics Limited
- 11.2.7.1. Overview
- 11.2.7.2. Products
- 11.2.7.3. SWOT Analysis
- 11.2.7.4. Recent Developments
- 11.2.7.5. Financials (Based on Availability)
- 11.2.8 Rosen Aviation
- 11.2.8.1. Overview
- 11.2.8.2. Products
- 11.2.8.3. SWOT Analysis
- 11.2.8.4. Recent Developments
- 11.2.8.5. Financials (Based on Availability)
- 11.2.9 Moving Terrain Air Navigation Systems AG
- 11.2.9.1. Overview
- 11.2.9.2. Products
- 11.2.9.3. SWOT Analysis
- 11.2.9.4. Recent Developments
- 11.2.9.5. Financials (Based on Availability)
- 11.2.10 Northern Avionics s.r.l
- 11.2.10.1. Overview
- 11.2.10.2. Products
- 11.2.10.3. SWOT Analysis
- 11.2.10.4. Recent Developments
- 11.2.10.5. Financials (Based on Availability)
- 11.2.11 Sky Definition Aero Systems LLC
- 11.2.11.1. Overview
- 11.2.11.2. Products
- 11.2.11.3. SWOT Analysis
- 11.2.11.4. Recent Developments
- 11.2.11.5. Financials (Based on Availability)
- 11.2.12 Donica Aviation Engineering
- 11.2.12.1. Overview
- 11.2.12.2. Products
- 11.2.12.3. SWOT Analysis
- 11.2.12.4. Recent Developments
- 11.2.12.5. Financials (Based on Availability)
- 11.2.13 Flight Display Systems
- 11.2.13.1. Overview
- 11.2.13.2. Products
- 11.2.13.3. SWOT Analysis
- 11.2.13.4. Recent Developments
- 11.2.13.5. Financials (Based on Availability)
- 11.2.14 Aircraft Cabin Systems
- 11.2.14.1. Overview
- 11.2.14.2. Products
- 11.2.14.3. SWOT Analysis
- 11.2.14.4. Recent Developments
- 11.2.14.5. Financials (Based on Availability)
- 11.2.15 digEcor
- 11.2.15.1. Overview
- 11.2.15.2. Products
- 11.2.15.3. SWOT Analysis
- 11.2.15.4. Recent Developments
- 11.2.15.5. Financials (Based on Availability)
- 11.2.16 Skycast Solutions
- 11.2.16.1. Overview
- 11.2.16.2. Products
- 11.2.16.3. SWOT Analysis
- 11.2.16.4. Recent Developments
- 11.2.16.5. Financials (Based on Availability)
- 11.2.1 Video Technology Services
List of Figures
- Figure 1: Global Entertainment In Fight Displays Revenue Breakdown (undefined, %) by Region 2025 & 2033
- Figure 2: North America Entertainment In Fight Displays Revenue (undefined), by Application 2025 & 2033
- Figure 3: North America Entertainment In Fight Displays Revenue Share (%), by Application 2025 & 2033
- Figure 4: North America Entertainment In Fight Displays Revenue (undefined), by Type 2025 & 2033
- Figure 5: North America Entertainment In Fight Displays Revenue Share (%), by Type 2025 & 2033
- Figure 6: North America Entertainment In Fight Displays Revenue (undefined), by Country 2025 & 2033
- Figure 7: North America Entertainment In Fight Displays Revenue Share (%), by Country 2025 & 2033
- Figure 8: South America Entertainment In Fight Displays Revenue (undefined), by Application 2025 & 2033
- Figure 9: South America Entertainment In Fight Displays Revenue Share (%), by Application 2025 & 2033
- Figure 10: South America Entertainment In Fight Displays Revenue (undefined), by Type 2025 & 2033
- Figure 11: South America Entertainment In Fight Displays Revenue Share (%), by Type 2025 & 2033
- Figure 12: South America Entertainment In Fight Displays Revenue (undefined), by Country 2025 & 2033
- Figure 13: South America Entertainment In Fight Displays Revenue Share (%), by Country 2025 & 2033
- Figure 14: Europe Entertainment In Fight Displays Revenue (undefined), by Application 2025 & 2033
- Figure 15: Europe Entertainment In Fight Displays Revenue Share (%), by Application 2025 & 2033
- Figure 16: Europe Entertainment In Fight Displays Revenue (undefined), by Type 2025 & 2033
- Figure 17: Europe Entertainment In Fight Displays Revenue Share (%), by Type 2025 & 2033
- Figure 18: Europe Entertainment In Fight Displays Revenue (undefined), by Country 2025 & 2033
- Figure 19: Europe Entertainment In Fight Displays Revenue Share (%), by Country 2025 & 2033
- Figure 20: Middle East & Africa Entertainment In Fight Displays Revenue (undefined), by Application 2025 & 2033
- Figure 21: Middle East & Africa Entertainment In Fight Displays Revenue Share (%), by Application 2025 & 2033
- Figure 22: Middle East & Africa Entertainment In Fight Displays Revenue (undefined), by Type 2025 & 2033
- Figure 23: Middle East & Africa Entertainment In Fight Displays Revenue Share (%), by Type 2025 & 2033
- Figure 24: Middle East & Africa Entertainment In Fight Displays Revenue (undefined), by Country 2025 & 2033
- Figure 25: Middle East & Africa Entertainment In Fight Displays Revenue Share (%), by Country 2025 & 2033
- Figure 26: Asia Pacific Entertainment In Fight Displays Revenue (undefined), by Application 2025 & 2033
- Figure 27: Asia Pacific Entertainment In Fight Displays Revenue Share (%), by Application 2025 & 2033
- Figure 28: Asia Pacific Entertainment In Fight Displays Revenue (undefined), by Type 2025 & 2033
- Figure 29: Asia Pacific Entertainment In Fight Displays Revenue Share (%), by Type 2025 & 2033
- Figure 30: Asia Pacific Entertainment In Fight Displays Revenue (undefined), by Country 2025 & 2033
- Figure 31: Asia Pacific Entertainment In Fight Displays Revenue Share (%), by Country 2025 & 2033
List of Tables
- Table 1: Global Entertainment In Fight Displays Revenue undefined Forecast, by Application 2020 & 2033
- Table 2: Global Entertainment In Fight Displays Revenue undefined Forecast, by Type 2020 & 2033
- Table 3: Global Entertainment In Fight Displays Revenue undefined Forecast, by Region 2020 & 2033
- Table 4: Global Entertainment In Fight Displays Revenue undefined Forecast, by Application 2020 & 2033
- Table 5: Global Entertainment In Fight Displays Revenue undefined Forecast, by Type 2020 & 2033
- Table 6: Global Entertainment In Fight Displays Revenue undefined Forecast, by Country 2020 & 2033
- Table 7: United States Entertainment In Fight Displays Revenue (undefined) Forecast, by Application 2020 & 2033
- Table 8: Canada Entertainment In Fight Displays Revenue (undefined) Forecast, by Application 2020 & 2033
- Table 9: Mexico Entertainment In Fight Displays Revenue (undefined) Forecast, by Application 2020 & 2033
- Table 10: Global Entertainment In Fight Displays Revenue undefined Forecast, by Application 2020 & 2033
- Table 11: Global Entertainment In Fight Displays Revenue undefined Forecast, by Type 2020 & 2033
- Table 12: Global Entertainment In Fight Displays Revenue undefined Forecast, by Country 2020 & 2033
- Table 13: Brazil Entertainment In Fight Displays Revenue (undefined) Forecast, by Application 2020 & 2033
- Table 14: Argentina Entertainment In Fight Displays Revenue (undefined) Forecast, by Application 2020 & 2033
- Table 15: Rest of South America Entertainment In Fight Displays Revenue (undefined) Forecast, by Application 2020 & 2033
- Table 16: Global Entertainment In Fight Displays Revenue undefined Forecast, by Application 2020 & 2033
- Table 17: Global Entertainment In Fight Displays Revenue undefined Forecast, by Type 2020 & 2033
- Table 18: Global Entertainment In Fight Displays Revenue undefined Forecast, by Country 2020 & 2033
- Table 19: United Kingdom Entertainment In Fight Displays Revenue (undefined) Forecast, by Application 2020 & 2033
- Table 20: Germany Entertainment In Fight Displays Revenue (undefined) Forecast, by Application 2020 & 2033
- Table 21: France Entertainment In Fight Displays Revenue (undefined) Forecast, by Application 2020 & 2033
- Table 22: Italy Entertainment In Fight Displays Revenue (undefined) Forecast, by Application 2020 & 2033
- Table 23: Spain Entertainment In Fight Displays Revenue (undefined) Forecast, by Application 2020 & 2033
- Table 24: Russia Entertainment In Fight Displays Revenue (undefined) Forecast, by Application 2020 & 2033
- Table 25: Benelux Entertainment In Fight Displays Revenue (undefined) Forecast, by Application 2020 & 2033
- Table 26: Nordics Entertainment In Fight Displays Revenue (undefined) Forecast, by Application 2020 & 2033
- Table 27: Rest of Europe Entertainment In Fight Displays Revenue (undefined) Forecast, by Application 2020 & 2033
- Table 28: Global Entertainment In Fight Displays Revenue undefined Forecast, by Application 2020 & 2033
- Table 29: Global Entertainment In Fight Displays Revenue undefined Forecast, by Type 2020 & 2033
- Table 30: Global Entertainment In Fight Displays Revenue undefined Forecast, by Country 2020 & 2033
- Table 31: Turkey Entertainment In Fight Displays Revenue (undefined) Forecast, by Application 2020 & 2033
- Table 32: Israel Entertainment In Fight Displays Revenue (undefined) Forecast, by Application 2020 & 2033
- Table 33: GCC Entertainment In Fight Displays Revenue (undefined) Forecast, by Application 2020 & 2033
- Table 34: North Africa Entertainment In Fight Displays Revenue (undefined) Forecast, by Application 2020 & 2033
- Table 35: South Africa Entertainment In Fight Displays Revenue (undefined) Forecast, by Application 2020 & 2033
- Table 36: Rest of Middle East & Africa Entertainment In Fight Displays Revenue (undefined) Forecast, by Application 2020 & 2033
- Table 37: Global Entertainment In Fight Displays Revenue undefined Forecast, by Application 2020 & 2033
- Table 38: Global Entertainment In Fight Displays Revenue undefined Forecast, by Type 2020 & 2033
- Table 39: Global Entertainment In Fight Displays Revenue undefined Forecast, by Country 2020 & 2033
- Table 40: China Entertainment In Fight Displays Revenue (undefined) Forecast, by Application 2020 & 2033
- Table 41: India Entertainment In Fight Displays Revenue (undefined) Forecast, by Application 2020 & 2033
- Table 42: Japan Entertainment In Fight Displays Revenue (undefined) Forecast, by Application 2020 & 2033
- Table 43: South Korea Entertainment In Fight Displays Revenue (undefined) Forecast, by Application 2020 & 2033
- Table 44: ASEAN Entertainment In Fight Displays Revenue (undefined) Forecast, by Application 2020 & 2033
- Table 45: Oceania Entertainment In Fight Displays Revenue (undefined) Forecast, by Application 2020 & 2033
- Table 46: Rest of Asia Pacific Entertainment In Fight Displays Revenue (undefined) Forecast, by Application 2020 & 2033
Frequently Asked Questions
1. What is the projected Compound Annual Growth Rate (CAGR) of the Entertainment In Fight Displays?
The projected CAGR is approximately 8.4%.
2. Which companies are prominent players in the Entertainment In Fight Displays?
Key companies in the market include Video Technology Services, THALES, OXYTRONIC, PANASONIC AVIONICS CORPORATION, Imagik International, InFlight Entertainment Products, RDDS Avionics Limited, Rosen Aviation, Moving Terrain Air Navigation Systems AG, Northern Avionics s.r.l, Sky Definition Aero Systems LLC, Donica Aviation Engineering, Flight Display Systems, Aircraft Cabin Systems, digEcor, Skycast Solutions.
3. What are the main segments of the Entertainment In Fight Displays?
The market segments include Application, Type.
4. Can you provide details about the market size?
The market size is estimated to be USD XXX N/A as of 2022.
5. What are some drivers contributing to market growth?
N/A
6. What are the notable trends driving market growth?
N/A
7. Are there any restraints impacting market growth?
N/A
8. Can you provide examples of recent developments in the market?
N/A
9. What pricing options are available for accessing the report?
Pricing options include single-user, multi-user, and enterprise licenses priced at USD 4250.00, USD 6375.00, and USD 8500.00 respectively.
10. Is the market size provided in terms of value or volume?
The market size is provided in terms of value, measured in N/A.
11. Are there any specific market keywords associated with the report?
Yes, the market keyword associated with the report is "Entertainment In Fight Displays," which aids in identifying and referencing the specific market segment covered.
12. How do I determine which pricing option suits my needs best?
The pricing options vary based on user requirements and access needs. Individual users may opt for single-user licenses, while businesses requiring broader access may choose multi-user or enterprise licenses for cost-effective access to the report.
13. Are there any additional resources or data provided in the Entertainment In Fight Displays report?
While the report offers comprehensive insights, it's advisable to review the specific contents or supplementary materials provided to ascertain if additional resources or data are available.
14. How can I stay updated on further developments or reports in the Entertainment In Fight Displays?
To stay informed about further developments, trends, and reports in the Entertainment In Fight Displays, consider subscribing to industry newsletters, following relevant companies and organizations, or regularly checking reputable industry news sources and publications.
Methodology
Step 1 - Identification of Relevant Samples Size from Population Database


Step 2 - Approaches for Defining Global Market Size (Value, Volume* & Price*)

Note*: In applicable scenarios
Step 3 - Data Sources
Primary Research
- Web Analytics
- Survey Reports
- Research Institute
- Latest Research Reports
- Opinion Leaders
Secondary Research
- Annual Reports
- White Paper
- Latest Press Release
- Industry Association
- Paid Database
- Investor Presentations

Step 4 - Data Triangulation
Involves using different sources of information in order to increase the validity of a study
These sources are likely to be stakeholders in a program - participants, other researchers, program staff, other community members, and so on.
Then we put all data in single framework & apply various statistical tools to find out the dynamic on the market.
During the analysis stage, feedback from the stakeholder groups would be compared to determine areas of agreement as well as areas of divergence