
Key Insights
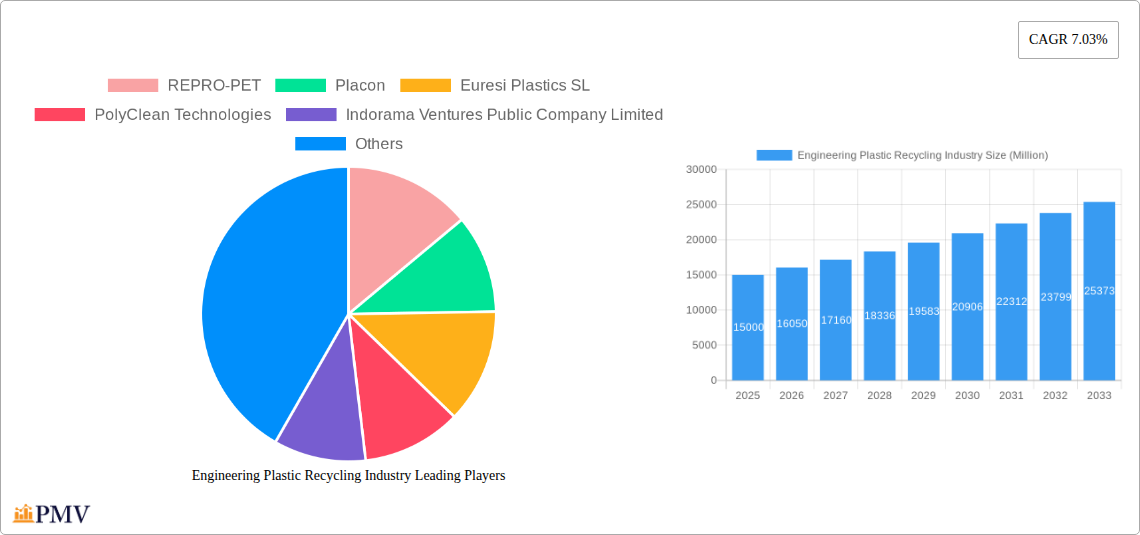
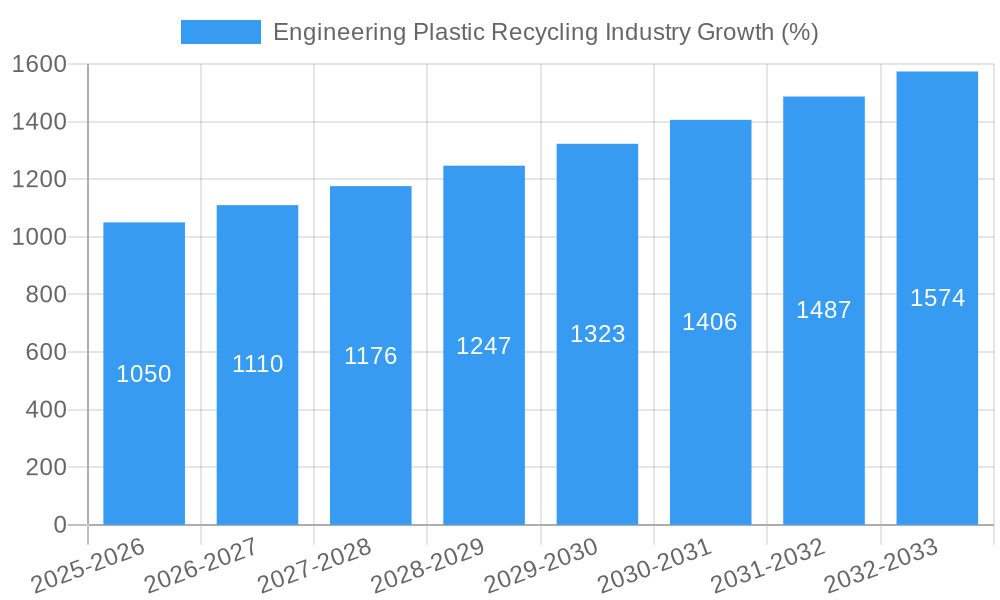
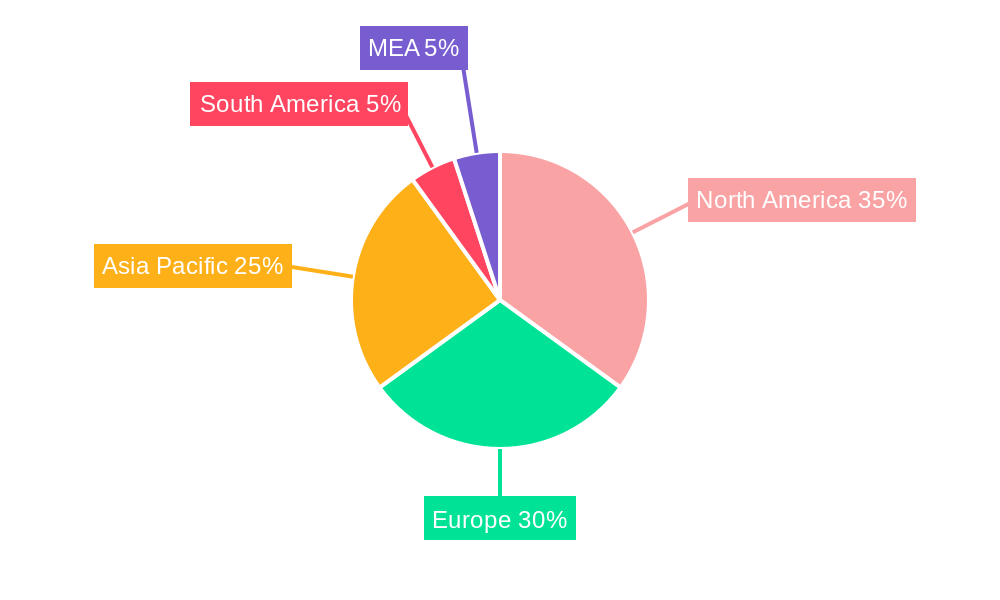
The global engineering plastic recycling market is experiencing robust growth, projected to maintain a Compound Annual Growth Rate (CAGR) of 7.03% from 2025 to 2033. This expansion is driven by several key factors. Increasing environmental concerns and stricter regulations regarding plastic waste are pushing industries to adopt more sustainable practices, creating a significant demand for recycled engineering plastics. Furthermore, the rising cost of virgin plastic materials and growing awareness of the circular economy are incentivizing the use of recycled alternatives. The market is segmented by plastic type, with Polycarbonate, Polyethylene Terephthalate (PET), Styrene Copolymers (ABS and SAN), and Polyamide representing major segments, each exhibiting unique growth trajectories based on their recyclability and applications. End-user industries like packaging, industrial yarn, and electrical and electronics are significant consumers, reflecting the versatility of recycled engineering plastics. Geographic growth varies, with North America and Europe currently holding significant market shares, but rapid industrialization in Asia-Pacific is driving substantial growth potential in this region. Key players in the market are actively investing in advanced recycling technologies and expanding their production capacities to meet the increasing demand. Competition is fostering innovation in recycling methods, resulting in higher-quality recycled materials with broader applications.
The market's growth is not without its challenges. Technological limitations in recycling certain types of engineering plastics remain a barrier, and inconsistencies in the quality of recycled materials can hinder widespread adoption. Furthermore, the lack of established recycling infrastructure in some regions, particularly in developing countries, poses a significant hurdle. However, ongoing technological advancements, coupled with governmental support and corporate sustainability initiatives, are expected to mitigate these challenges and drive further market expansion. The market is expected to see further diversification, with the emergence of new recycling technologies and the expansion of the types of engineering plastics that can be effectively recycled. The continued focus on sustainability and the economic benefits of using recycled materials will remain critical drivers for future market growth.
Engineering Plastic Recycling Industry: A Comprehensive Market Report (2019-2033)
This comprehensive report provides an in-depth analysis of the global engineering plastic recycling industry, covering market size, growth drivers, challenges, competitive landscape, and future outlook. The study period spans from 2019 to 2033, with 2025 as the base year and forecast period extending to 2033. The report includes detailed segmentation by plastic type (Polycarbonate, Polyethylene Terephthalate (PET), Styrene Copolymers (ABS and SAN), Polyamide, Other Engineering Plastics) and end-user industry (Packaging, Industrial Yarn, Electrical and Electronics, Other End-user Industries). The report values are expressed in Millions.
Engineering Plastic Recycling Industry Market Structure & Competitive Dynamics
The engineering plastic recycling market exhibits a moderately concentrated structure, with several key players holding significant market share. The market share distribution among the top 10 companies is estimated to be around xx%. Innovation ecosystems are largely driven by advancements in sorting technologies, chemical recycling processes, and demand for recycled content from downstream industries. Regulatory frameworks, including extended producer responsibility (EPR) schemes and plastic taxes, are increasingly shaping market dynamics. Product substitutes, such as bioplastics and virgin plastics, pose competitive pressure, particularly for certain applications. End-user trends towards sustainability and circular economy principles are fueling demand for recycled engineering plastics. Significant M&A activity is observed, with deal values exceeding xx Million in the past five years, reflecting consolidation trends and strategic expansion among key players. Examples include Indorama Ventures' acquisition of UCY Polymers CZ s.r.o.
- Market Concentration: xx% held by top 10 players.
- M&A Activity: Total deal value exceeding xx Million over the last 5 years.
- Key Regulatory Drivers: EPR schemes, plastic taxes, and government subsidies for recycling infrastructure.
- Innovation Focus: Advanced sorting technologies, chemical recycling, and improved material properties of recycled plastics.
Engineering Plastic Recycling Industry Industry Trends & Insights
The global engineering plastic recycling market is experiencing robust growth, driven by increasing environmental awareness, stringent regulations on plastic waste, and rising demand for sustainable materials from various end-user industries. The market is projected to witness a CAGR of xx% during the forecast period (2025-2033). Technological disruptions, such as the development of advanced recycling technologies (e.g., chemical recycling), are significantly enhancing the quality and application range of recycled plastics. Consumer preferences are increasingly shifting towards products made from recycled materials, boosting demand for recycled engineering plastics. Competitive dynamics are characterized by investments in capacity expansion, technological innovation, and strategic partnerships to secure raw material supply and expand market reach. Market penetration of recycled engineering plastics varies significantly across different applications, with packaging and textile industries exhibiting relatively higher adoption rates.
Dominant Markets & Segments in Engineering Plastic Recycling Industry
The Asia-Pacific region dominates the global engineering plastic recycling market, driven by high plastic consumption, growing environmental concerns, and supportive government policies. Within this region, China and India are leading national markets.
- Dominant Plastic Type: Polyethylene Terephthalate (PET) holds the largest market share due to its high recyclability and widespread use in packaging.
- Dominant End-User Industry: The Packaging industry currently dominates, owing to the large volume of PET plastic waste generated.
- Key Drivers in Asia-Pacific:
- Rapidly growing economies and increasing plastic waste generation.
- Stringent government regulations promoting recycling and waste management.
- Investments in recycling infrastructure and technological advancements.
Detailed dominance analysis within each segment reveals that PET recycling enjoys the highest volume due to existing infrastructure and established recycling streams. Packaging applications represent the largest end-use segment, driven by consumer demand and regulatory pressure.
Engineering Plastic Recycling Industry Product Innovations
Significant advancements in recycling technologies, such as chemical recycling and enzymatic depolymerization, are enabling the production of high-quality recycled engineering plastics suitable for demanding applications. These innovations enhance the properties of recycled materials, making them competitive with virgin plastics in terms of performance and cost-effectiveness, thus expanding the range of applications for recycled plastics across various industries, from packaging to automotive components.
Report Segmentation & Scope
The report segments the market by plastic type (Polycarbonate, PET, ABS/SAN, Polyamide, Other Engineering Plastics) and end-user industry (Packaging, Industrial Yarn, Electrical and Electronics, Other End-user Industries). Each segment includes market size estimations, growth projections, and competitive analysis. For example, the PET segment is expected to register significant growth, driven by its high recyclability and increasing demand from the beverage industry. The packaging industry segment shows the largest market share due to the high volume of plastic packaging waste.
Key Drivers of Engineering Plastic Recycling Industry Growth
The growth of the engineering plastic recycling industry is propelled by several key factors:
- Stringent environmental regulations: Governments worldwide are enacting stricter regulations to curb plastic waste and promote recycling.
- Growing environmental awareness: Increased consumer awareness of plastic pollution is driving demand for sustainable products.
- Technological advancements: Innovations in recycling technologies are improving the quality and applications of recycled plastics.
- Economic incentives: Government subsidies and tax benefits are encouraging investment in recycling infrastructure.
Challenges in the Engineering Plastic Recycling Industry Sector
Despite significant growth potential, the engineering plastic recycling industry faces several challenges:
- Complex recycling processes: Recycling certain engineering plastics remains technically challenging and expensive.
- Lack of infrastructure: Inadequate collection and sorting infrastructure limits the amount of plastic waste that can be recycled.
- Fluctuating raw material prices: The price volatility of recycled plastics can impact profitability.
- Competition from virgin plastics: Virgin plastics remain cheaper in some applications, limiting the adoption of recycled materials.
Leading Players in the Engineering Plastic Recycling Industry Market
- REPRO-PET
- Placon
- Euresi Plastics SL
- PolyClean Technologies
- Indorama Ventures Public Company Limited
- Reliance Industries Limited
- Krones AG
- Petco
- Clean Tech UK Ltd
- JFC Group
- Far Eastern New Century Corporation (Phoenix Technologies)
- TEIJIN LIMITED
- UltrePET LLC
- Alpek S A B de C V
- EF Plastics UK Ltd
Key Developments in Engineering Plastic Recycling Industry Sector
- February 2022: Indorama Ventures announced the acquisition of UCY Polymers CZ s.r.o. (UCY), a Czech Republic-based PET plastic recycler, increasing its recycling capacity by 1.12 Billion post-consumer PET bottles annually by 2025.
- October 2022: Indorama Ventures opened a PET Value bottle-to-bottle recycling plant in the Philippines in partnership with Coca-Cola Beverages Philippines, expanding its presence in the Asia-Pacific region and furthering its commitment to sustainable packaging solutions.
Strategic Engineering Plastic Recycling Industry Market Outlook
The future of the engineering plastic recycling industry looks promising, driven by the convergence of environmental concerns, technological advancements, and supportive government policies. The market is poised for significant growth, fueled by increasing demand for recycled materials, innovations in recycling technologies, and the expansion of recycling infrastructure globally. Strategic opportunities exist for companies to invest in advanced recycling technologies, optimize supply chains, and develop new applications for recycled engineering plastics, creating a more sustainable and circular economy for plastics.
Engineering Plastic Recycling Industry Segmentation
-
1. Plastic Type
- 1.1. Polycarbonate
- 1.2. Polyethylene Terephthalate (PET)
- 1.3. Styrene Copolymers (ABS and SAN)
- 1.4. Polyamide
- 1.5. Other Engineering Plastics
-
2. End-user Industry
- 2.1. Packaging
- 2.2. Industrial Yarn
- 2.3. Electrical and Electronics
- 2.4. Other End-user Industries
Engineering Plastic Recycling Industry Segmentation By Geography
-
1. Asia Pacific
- 1.1. China
- 1.2. India
- 1.3. Japan
- 1.4. South Korea
- 1.5. Rest of Asia Pacific
-
2. North America
- 2.1. United States
- 2.2. Canada
- 2.3. Mexico
-
3. Europe
- 3.1. Germany
- 3.2. United Kingdom
- 3.3. France
- 3.4. Italy
- 3.5. Rest of Europe
-
4. Rest of the World
- 4.1. South America
- 4.2. Middle East and Africa
Engineering Plastic Recycling Industry REPORT HIGHLIGHTS
| Aspects | Details |
|---|---|
| Study Period | 2019-2033 |
| Base Year | 2024 |
| Estimated Year | 2025 |
| Forecast Period | 2025-2033 |
| Historical Period | 2019-2024 |
| Growth Rate | CAGR of 7.03% from 2019-2033 |
| Segmentation |
|
Table of Contents
- 1. Introduction
- 1.1. Research Scope
- 1.2. Market Segmentation
- 1.3. Research Methodology
- 1.4. Definitions and Assumptions
- 2. Executive Summary
- 2.1. Introduction
- 3. Market Dynamics
- 3.1. Introduction
- 3.2. Market Drivers
- 3.2.1. Growing Emphasis on Sustainability among Consumer and Packaging Products; Increasing Use of Recycled Polyester; Other Drivers
- 3.3. Market Restrains
- 3.3.1. Difficulty in Collecting and Sorting Mixed Plastic; Other Restraints
- 3.4. Market Trends
- 3.4.1. Packaging Industry to Dominate the Market
- 4. Market Factor Analysis
- 4.1. Porters Five Forces
- 4.2. Supply/Value Chain
- 4.3. PESTEL analysis
- 4.4. Market Entropy
- 4.5. Patent/Trademark Analysis
- 5. Global Engineering Plastic Recycling Industry Analysis, Insights and Forecast, 2019-2031
- 5.1. Market Analysis, Insights and Forecast - by Plastic Type
- 5.1.1. Polycarbonate
- 5.1.2. Polyethylene Terephthalate (PET)
- 5.1.3. Styrene Copolymers (ABS and SAN)
- 5.1.4. Polyamide
- 5.1.5. Other Engineering Plastics
- 5.2. Market Analysis, Insights and Forecast - by End-user Industry
- 5.2.1. Packaging
- 5.2.2. Industrial Yarn
- 5.2.3. Electrical and Electronics
- 5.2.4. Other End-user Industries
- 5.3. Market Analysis, Insights and Forecast - by Region
- 5.3.1. Asia Pacific
- 5.3.2. North America
- 5.3.3. Europe
- 5.3.4. Rest of the World
- 5.1. Market Analysis, Insights and Forecast - by Plastic Type
- 6. Asia Pacific Engineering Plastic Recycling Industry Analysis, Insights and Forecast, 2019-2031
- 6.1. Market Analysis, Insights and Forecast - by Plastic Type
- 6.1.1. Polycarbonate
- 6.1.2. Polyethylene Terephthalate (PET)
- 6.1.3. Styrene Copolymers (ABS and SAN)
- 6.1.4. Polyamide
- 6.1.5. Other Engineering Plastics
- 6.2. Market Analysis, Insights and Forecast - by End-user Industry
- 6.2.1. Packaging
- 6.2.2. Industrial Yarn
- 6.2.3. Electrical and Electronics
- 6.2.4. Other End-user Industries
- 6.1. Market Analysis, Insights and Forecast - by Plastic Type
- 7. North America Engineering Plastic Recycling Industry Analysis, Insights and Forecast, 2019-2031
- 7.1. Market Analysis, Insights and Forecast - by Plastic Type
- 7.1.1. Polycarbonate
- 7.1.2. Polyethylene Terephthalate (PET)
- 7.1.3. Styrene Copolymers (ABS and SAN)
- 7.1.4. Polyamide
- 7.1.5. Other Engineering Plastics
- 7.2. Market Analysis, Insights and Forecast - by End-user Industry
- 7.2.1. Packaging
- 7.2.2. Industrial Yarn
- 7.2.3. Electrical and Electronics
- 7.2.4. Other End-user Industries
- 7.1. Market Analysis, Insights and Forecast - by Plastic Type
- 8. Europe Engineering Plastic Recycling Industry Analysis, Insights and Forecast, 2019-2031
- 8.1. Market Analysis, Insights and Forecast - by Plastic Type
- 8.1.1. Polycarbonate
- 8.1.2. Polyethylene Terephthalate (PET)
- 8.1.3. Styrene Copolymers (ABS and SAN)
- 8.1.4. Polyamide
- 8.1.5. Other Engineering Plastics
- 8.2. Market Analysis, Insights and Forecast - by End-user Industry
- 8.2.1. Packaging
- 8.2.2. Industrial Yarn
- 8.2.3. Electrical and Electronics
- 8.2.4. Other End-user Industries
- 8.1. Market Analysis, Insights and Forecast - by Plastic Type
- 9. Rest of the World Engineering Plastic Recycling Industry Analysis, Insights and Forecast, 2019-2031
- 9.1. Market Analysis, Insights and Forecast - by Plastic Type
- 9.1.1. Polycarbonate
- 9.1.2. Polyethylene Terephthalate (PET)
- 9.1.3. Styrene Copolymers (ABS and SAN)
- 9.1.4. Polyamide
- 9.1.5. Other Engineering Plastics
- 9.2. Market Analysis, Insights and Forecast - by End-user Industry
- 9.2.1. Packaging
- 9.2.2. Industrial Yarn
- 9.2.3. Electrical and Electronics
- 9.2.4. Other End-user Industries
- 9.1. Market Analysis, Insights and Forecast - by Plastic Type
- 10. North America Engineering Plastic Recycling Industry Analysis, Insights and Forecast, 2019-2031
- 10.1. Market Analysis, Insights and Forecast - By Country/Sub-region
- 10.1.1 United States
- 10.1.2 Canada
- 10.1.3 Mexico
- 11. Europe Engineering Plastic Recycling Industry Analysis, Insights and Forecast, 2019-2031
- 11.1. Market Analysis, Insights and Forecast - By Country/Sub-region
- 11.1.1 Germany
- 11.1.2 France
- 11.1.3 Italy
- 11.1.4 United Kingdom
- 11.1.5 Netherlands
- 11.1.6 Rest of Europe
- 12. Asia Pacific Engineering Plastic Recycling Industry Analysis, Insights and Forecast, 2019-2031
- 12.1. Market Analysis, Insights and Forecast - By Country/Sub-region
- 12.1.1 China
- 12.1.2 Japan
- 12.1.3 India
- 12.1.4 South Korea
- 12.1.5 Taiwan
- 12.1.6 Australia
- 12.1.7 Rest of Asia-Pacific
- 13. South America Engineering Plastic Recycling Industry Analysis, Insights and Forecast, 2019-2031
- 13.1. Market Analysis, Insights and Forecast - By Country/Sub-region
- 13.1.1 Brazil
- 13.1.2 Argentina
- 13.1.3 Rest of South America
- 14. MEA Engineering Plastic Recycling Industry Analysis, Insights and Forecast, 2019-2031
- 14.1. Market Analysis, Insights and Forecast - By Country/Sub-region
- 14.1.1 Middle East
- 14.1.2 Africa
- 15. Competitive Analysis
- 15.1. Global Market Share Analysis 2024
- 15.2. Company Profiles
- 15.2.1 REPRO-PET
- 15.2.1.1. Overview
- 15.2.1.2. Products
- 15.2.1.3. SWOT Analysis
- 15.2.1.4. Recent Developments
- 15.2.1.5. Financials (Based on Availability)
- 15.2.2 Placon
- 15.2.2.1. Overview
- 15.2.2.2. Products
- 15.2.2.3. SWOT Analysis
- 15.2.2.4. Recent Developments
- 15.2.2.5. Financials (Based on Availability)
- 15.2.3 Euresi Plastics SL
- 15.2.3.1. Overview
- 15.2.3.2. Products
- 15.2.3.3. SWOT Analysis
- 15.2.3.4. Recent Developments
- 15.2.3.5. Financials (Based on Availability)
- 15.2.4 PolyClean Technologies
- 15.2.4.1. Overview
- 15.2.4.2. Products
- 15.2.4.3. SWOT Analysis
- 15.2.4.4. Recent Developments
- 15.2.4.5. Financials (Based on Availability)
- 15.2.5 Indorama Ventures Public Company Limited
- 15.2.5.1. Overview
- 15.2.5.2. Products
- 15.2.5.3. SWOT Analysis
- 15.2.5.4. Recent Developments
- 15.2.5.5. Financials (Based on Availability)
- 15.2.6 Reliance Industries Limited
- 15.2.6.1. Overview
- 15.2.6.2. Products
- 15.2.6.3. SWOT Analysis
- 15.2.6.4. Recent Developments
- 15.2.6.5. Financials (Based on Availability)
- 15.2.7 Krones AG
- 15.2.7.1. Overview
- 15.2.7.2. Products
- 15.2.7.3. SWOT Analysis
- 15.2.7.4. Recent Developments
- 15.2.7.5. Financials (Based on Availability)
- 15.2.8 Petco
- 15.2.8.1. Overview
- 15.2.8.2. Products
- 15.2.8.3. SWOT Analysis
- 15.2.8.4. Recent Developments
- 15.2.8.5. Financials (Based on Availability)
- 15.2.9 Clean Tech UK Ltd
- 15.2.9.1. Overview
- 15.2.9.2. Products
- 15.2.9.3. SWOT Analysis
- 15.2.9.4. Recent Developments
- 15.2.9.5. Financials (Based on Availability)
- 15.2.10 JFC Group
- 15.2.10.1. Overview
- 15.2.10.2. Products
- 15.2.10.3. SWOT Analysis
- 15.2.10.4. Recent Developments
- 15.2.10.5. Financials (Based on Availability)
- 15.2.11 Far Eastern New Century Corporation (Phoenix Technologies)
- 15.2.11.1. Overview
- 15.2.11.2. Products
- 15.2.11.3. SWOT Analysis
- 15.2.11.4. Recent Developments
- 15.2.11.5. Financials (Based on Availability)
- 15.2.12 TEIJIN LIMITED
- 15.2.12.1. Overview
- 15.2.12.2. Products
- 15.2.12.3. SWOT Analysis
- 15.2.12.4. Recent Developments
- 15.2.12.5. Financials (Based on Availability)
- 15.2.13 UltrePET LLC
- 15.2.13.1. Overview
- 15.2.13.2. Products
- 15.2.13.3. SWOT Analysis
- 15.2.13.4. Recent Developments
- 15.2.13.5. Financials (Based on Availability)
- 15.2.14 Alpek S A B de C V
- 15.2.14.1. Overview
- 15.2.14.2. Products
- 15.2.14.3. SWOT Analysis
- 15.2.14.4. Recent Developments
- 15.2.14.5. Financials (Based on Availability)
- 15.2.15 EF Plastics UK Ltd
- 15.2.15.1. Overview
- 15.2.15.2. Products
- 15.2.15.3. SWOT Analysis
- 15.2.15.4. Recent Developments
- 15.2.15.5. Financials (Based on Availability)
- 15.2.1 REPRO-PET
List of Figures
- Figure 1: Global Engineering Plastic Recycling Industry Revenue Breakdown (Million, %) by Region 2024 & 2032
- Figure 2: Global Engineering Plastic Recycling Industry Volume Breakdown (K Tons, %) by Region 2024 & 2032
- Figure 3: North America Engineering Plastic Recycling Industry Revenue (Million), by Country 2024 & 2032
- Figure 4: North America Engineering Plastic Recycling Industry Volume (K Tons), by Country 2024 & 2032
- Figure 5: North America Engineering Plastic Recycling Industry Revenue Share (%), by Country 2024 & 2032
- Figure 6: North America Engineering Plastic Recycling Industry Volume Share (%), by Country 2024 & 2032
- Figure 7: Europe Engineering Plastic Recycling Industry Revenue (Million), by Country 2024 & 2032
- Figure 8: Europe Engineering Plastic Recycling Industry Volume (K Tons), by Country 2024 & 2032
- Figure 9: Europe Engineering Plastic Recycling Industry Revenue Share (%), by Country 2024 & 2032
- Figure 10: Europe Engineering Plastic Recycling Industry Volume Share (%), by Country 2024 & 2032
- Figure 11: Asia Pacific Engineering Plastic Recycling Industry Revenue (Million), by Country 2024 & 2032
- Figure 12: Asia Pacific Engineering Plastic Recycling Industry Volume (K Tons), by Country 2024 & 2032
- Figure 13: Asia Pacific Engineering Plastic Recycling Industry Revenue Share (%), by Country 2024 & 2032
- Figure 14: Asia Pacific Engineering Plastic Recycling Industry Volume Share (%), by Country 2024 & 2032
- Figure 15: South America Engineering Plastic Recycling Industry Revenue (Million), by Country 2024 & 2032
- Figure 16: South America Engineering Plastic Recycling Industry Volume (K Tons), by Country 2024 & 2032
- Figure 17: South America Engineering Plastic Recycling Industry Revenue Share (%), by Country 2024 & 2032
- Figure 18: South America Engineering Plastic Recycling Industry Volume Share (%), by Country 2024 & 2032
- Figure 19: MEA Engineering Plastic Recycling Industry Revenue (Million), by Country 2024 & 2032
- Figure 20: MEA Engineering Plastic Recycling Industry Volume (K Tons), by Country 2024 & 2032
- Figure 21: MEA Engineering Plastic Recycling Industry Revenue Share (%), by Country 2024 & 2032
- Figure 22: MEA Engineering Plastic Recycling Industry Volume Share (%), by Country 2024 & 2032
- Figure 23: Asia Pacific Engineering Plastic Recycling Industry Revenue (Million), by Plastic Type 2024 & 2032
- Figure 24: Asia Pacific Engineering Plastic Recycling Industry Volume (K Tons), by Plastic Type 2024 & 2032
- Figure 25: Asia Pacific Engineering Plastic Recycling Industry Revenue Share (%), by Plastic Type 2024 & 2032
- Figure 26: Asia Pacific Engineering Plastic Recycling Industry Volume Share (%), by Plastic Type 2024 & 2032
- Figure 27: Asia Pacific Engineering Plastic Recycling Industry Revenue (Million), by End-user Industry 2024 & 2032
- Figure 28: Asia Pacific Engineering Plastic Recycling Industry Volume (K Tons), by End-user Industry 2024 & 2032
- Figure 29: Asia Pacific Engineering Plastic Recycling Industry Revenue Share (%), by End-user Industry 2024 & 2032
- Figure 30: Asia Pacific Engineering Plastic Recycling Industry Volume Share (%), by End-user Industry 2024 & 2032
- Figure 31: Asia Pacific Engineering Plastic Recycling Industry Revenue (Million), by Country 2024 & 2032
- Figure 32: Asia Pacific Engineering Plastic Recycling Industry Volume (K Tons), by Country 2024 & 2032
- Figure 33: Asia Pacific Engineering Plastic Recycling Industry Revenue Share (%), by Country 2024 & 2032
- Figure 34: Asia Pacific Engineering Plastic Recycling Industry Volume Share (%), by Country 2024 & 2032
- Figure 35: North America Engineering Plastic Recycling Industry Revenue (Million), by Plastic Type 2024 & 2032
- Figure 36: North America Engineering Plastic Recycling Industry Volume (K Tons), by Plastic Type 2024 & 2032
- Figure 37: North America Engineering Plastic Recycling Industry Revenue Share (%), by Plastic Type 2024 & 2032
- Figure 38: North America Engineering Plastic Recycling Industry Volume Share (%), by Plastic Type 2024 & 2032
- Figure 39: North America Engineering Plastic Recycling Industry Revenue (Million), by End-user Industry 2024 & 2032
- Figure 40: North America Engineering Plastic Recycling Industry Volume (K Tons), by End-user Industry 2024 & 2032
- Figure 41: North America Engineering Plastic Recycling Industry Revenue Share (%), by End-user Industry 2024 & 2032
- Figure 42: North America Engineering Plastic Recycling Industry Volume Share (%), by End-user Industry 2024 & 2032
- Figure 43: North America Engineering Plastic Recycling Industry Revenue (Million), by Country 2024 & 2032
- Figure 44: North America Engineering Plastic Recycling Industry Volume (K Tons), by Country 2024 & 2032
- Figure 45: North America Engineering Plastic Recycling Industry Revenue Share (%), by Country 2024 & 2032
- Figure 46: North America Engineering Plastic Recycling Industry Volume Share (%), by Country 2024 & 2032
- Figure 47: Europe Engineering Plastic Recycling Industry Revenue (Million), by Plastic Type 2024 & 2032
- Figure 48: Europe Engineering Plastic Recycling Industry Volume (K Tons), by Plastic Type 2024 & 2032
- Figure 49: Europe Engineering Plastic Recycling Industry Revenue Share (%), by Plastic Type 2024 & 2032
- Figure 50: Europe Engineering Plastic Recycling Industry Volume Share (%), by Plastic Type 2024 & 2032
- Figure 51: Europe Engineering Plastic Recycling Industry Revenue (Million), by End-user Industry 2024 & 2032
- Figure 52: Europe Engineering Plastic Recycling Industry Volume (K Tons), by End-user Industry 2024 & 2032
- Figure 53: Europe Engineering Plastic Recycling Industry Revenue Share (%), by End-user Industry 2024 & 2032
- Figure 54: Europe Engineering Plastic Recycling Industry Volume Share (%), by End-user Industry 2024 & 2032
- Figure 55: Europe Engineering Plastic Recycling Industry Revenue (Million), by Country 2024 & 2032
- Figure 56: Europe Engineering Plastic Recycling Industry Volume (K Tons), by Country 2024 & 2032
- Figure 57: Europe Engineering Plastic Recycling Industry Revenue Share (%), by Country 2024 & 2032
- Figure 58: Europe Engineering Plastic Recycling Industry Volume Share (%), by Country 2024 & 2032
- Figure 59: Rest of the World Engineering Plastic Recycling Industry Revenue (Million), by Plastic Type 2024 & 2032
- Figure 60: Rest of the World Engineering Plastic Recycling Industry Volume (K Tons), by Plastic Type 2024 & 2032
- Figure 61: Rest of the World Engineering Plastic Recycling Industry Revenue Share (%), by Plastic Type 2024 & 2032
- Figure 62: Rest of the World Engineering Plastic Recycling Industry Volume Share (%), by Plastic Type 2024 & 2032
- Figure 63: Rest of the World Engineering Plastic Recycling Industry Revenue (Million), by End-user Industry 2024 & 2032
- Figure 64: Rest of the World Engineering Plastic Recycling Industry Volume (K Tons), by End-user Industry 2024 & 2032
- Figure 65: Rest of the World Engineering Plastic Recycling Industry Revenue Share (%), by End-user Industry 2024 & 2032
- Figure 66: Rest of the World Engineering Plastic Recycling Industry Volume Share (%), by End-user Industry 2024 & 2032
- Figure 67: Rest of the World Engineering Plastic Recycling Industry Revenue (Million), by Country 2024 & 2032
- Figure 68: Rest of the World Engineering Plastic Recycling Industry Volume (K Tons), by Country 2024 & 2032
- Figure 69: Rest of the World Engineering Plastic Recycling Industry Revenue Share (%), by Country 2024 & 2032
- Figure 70: Rest of the World Engineering Plastic Recycling Industry Volume Share (%), by Country 2024 & 2032
List of Tables
- Table 1: Global Engineering Plastic Recycling Industry Revenue Million Forecast, by Region 2019 & 2032
- Table 2: Global Engineering Plastic Recycling Industry Volume K Tons Forecast, by Region 2019 & 2032
- Table 3: Global Engineering Plastic Recycling Industry Revenue Million Forecast, by Plastic Type 2019 & 2032
- Table 4: Global Engineering Plastic Recycling Industry Volume K Tons Forecast, by Plastic Type 2019 & 2032
- Table 5: Global Engineering Plastic Recycling Industry Revenue Million Forecast, by End-user Industry 2019 & 2032
- Table 6: Global Engineering Plastic Recycling Industry Volume K Tons Forecast, by End-user Industry 2019 & 2032
- Table 7: Global Engineering Plastic Recycling Industry Revenue Million Forecast, by Region 2019 & 2032
- Table 8: Global Engineering Plastic Recycling Industry Volume K Tons Forecast, by Region 2019 & 2032
- Table 9: Global Engineering Plastic Recycling Industry Revenue Million Forecast, by Country 2019 & 2032
- Table 10: Global Engineering Plastic Recycling Industry Volume K Tons Forecast, by Country 2019 & 2032
- Table 11: United States Engineering Plastic Recycling Industry Revenue (Million) Forecast, by Application 2019 & 2032
- Table 12: United States Engineering Plastic Recycling Industry Volume (K Tons) Forecast, by Application 2019 & 2032
- Table 13: Canada Engineering Plastic Recycling Industry Revenue (Million) Forecast, by Application 2019 & 2032
- Table 14: Canada Engineering Plastic Recycling Industry Volume (K Tons) Forecast, by Application 2019 & 2032
- Table 15: Mexico Engineering Plastic Recycling Industry Revenue (Million) Forecast, by Application 2019 & 2032
- Table 16: Mexico Engineering Plastic Recycling Industry Volume (K Tons) Forecast, by Application 2019 & 2032
- Table 17: Global Engineering Plastic Recycling Industry Revenue Million Forecast, by Country 2019 & 2032
- Table 18: Global Engineering Plastic Recycling Industry Volume K Tons Forecast, by Country 2019 & 2032
- Table 19: Germany Engineering Plastic Recycling Industry Revenue (Million) Forecast, by Application 2019 & 2032
- Table 20: Germany Engineering Plastic Recycling Industry Volume (K Tons) Forecast, by Application 2019 & 2032
- Table 21: France Engineering Plastic Recycling Industry Revenue (Million) Forecast, by Application 2019 & 2032
- Table 22: France Engineering Plastic Recycling Industry Volume (K Tons) Forecast, by Application 2019 & 2032
- Table 23: Italy Engineering Plastic Recycling Industry Revenue (Million) Forecast, by Application 2019 & 2032
- Table 24: Italy Engineering Plastic Recycling Industry Volume (K Tons) Forecast, by Application 2019 & 2032
- Table 25: United Kingdom Engineering Plastic Recycling Industry Revenue (Million) Forecast, by Application 2019 & 2032
- Table 26: United Kingdom Engineering Plastic Recycling Industry Volume (K Tons) Forecast, by Application 2019 & 2032
- Table 27: Netherlands Engineering Plastic Recycling Industry Revenue (Million) Forecast, by Application 2019 & 2032
- Table 28: Netherlands Engineering Plastic Recycling Industry Volume (K Tons) Forecast, by Application 2019 & 2032
- Table 29: Rest of Europe Engineering Plastic Recycling Industry Revenue (Million) Forecast, by Application 2019 & 2032
- Table 30: Rest of Europe Engineering Plastic Recycling Industry Volume (K Tons) Forecast, by Application 2019 & 2032
- Table 31: Global Engineering Plastic Recycling Industry Revenue Million Forecast, by Country 2019 & 2032
- Table 32: Global Engineering Plastic Recycling Industry Volume K Tons Forecast, by Country 2019 & 2032
- Table 33: China Engineering Plastic Recycling Industry Revenue (Million) Forecast, by Application 2019 & 2032
- Table 34: China Engineering Plastic Recycling Industry Volume (K Tons) Forecast, by Application 2019 & 2032
- Table 35: Japan Engineering Plastic Recycling Industry Revenue (Million) Forecast, by Application 2019 & 2032
- Table 36: Japan Engineering Plastic Recycling Industry Volume (K Tons) Forecast, by Application 2019 & 2032
- Table 37: India Engineering Plastic Recycling Industry Revenue (Million) Forecast, by Application 2019 & 2032
- Table 38: India Engineering Plastic Recycling Industry Volume (K Tons) Forecast, by Application 2019 & 2032
- Table 39: South Korea Engineering Plastic Recycling Industry Revenue (Million) Forecast, by Application 2019 & 2032
- Table 40: South Korea Engineering Plastic Recycling Industry Volume (K Tons) Forecast, by Application 2019 & 2032
- Table 41: Taiwan Engineering Plastic Recycling Industry Revenue (Million) Forecast, by Application 2019 & 2032
- Table 42: Taiwan Engineering Plastic Recycling Industry Volume (K Tons) Forecast, by Application 2019 & 2032
- Table 43: Australia Engineering Plastic Recycling Industry Revenue (Million) Forecast, by Application 2019 & 2032
- Table 44: Australia Engineering Plastic Recycling Industry Volume (K Tons) Forecast, by Application 2019 & 2032
- Table 45: Rest of Asia-Pacific Engineering Plastic Recycling Industry Revenue (Million) Forecast, by Application 2019 & 2032
- Table 46: Rest of Asia-Pacific Engineering Plastic Recycling Industry Volume (K Tons) Forecast, by Application 2019 & 2032
- Table 47: Global Engineering Plastic Recycling Industry Revenue Million Forecast, by Country 2019 & 2032
- Table 48: Global Engineering Plastic Recycling Industry Volume K Tons Forecast, by Country 2019 & 2032
- Table 49: Brazil Engineering Plastic Recycling Industry Revenue (Million) Forecast, by Application 2019 & 2032
- Table 50: Brazil Engineering Plastic Recycling Industry Volume (K Tons) Forecast, by Application 2019 & 2032
- Table 51: Argentina Engineering Plastic Recycling Industry Revenue (Million) Forecast, by Application 2019 & 2032
- Table 52: Argentina Engineering Plastic Recycling Industry Volume (K Tons) Forecast, by Application 2019 & 2032
- Table 53: Rest of South America Engineering Plastic Recycling Industry Revenue (Million) Forecast, by Application 2019 & 2032
- Table 54: Rest of South America Engineering Plastic Recycling Industry Volume (K Tons) Forecast, by Application 2019 & 2032
- Table 55: Global Engineering Plastic Recycling Industry Revenue Million Forecast, by Country 2019 & 2032
- Table 56: Global Engineering Plastic Recycling Industry Volume K Tons Forecast, by Country 2019 & 2032
- Table 57: Middle East Engineering Plastic Recycling Industry Revenue (Million) Forecast, by Application 2019 & 2032
- Table 58: Middle East Engineering Plastic Recycling Industry Volume (K Tons) Forecast, by Application 2019 & 2032
- Table 59: Africa Engineering Plastic Recycling Industry Revenue (Million) Forecast, by Application 2019 & 2032
- Table 60: Africa Engineering Plastic Recycling Industry Volume (K Tons) Forecast, by Application 2019 & 2032
- Table 61: Global Engineering Plastic Recycling Industry Revenue Million Forecast, by Plastic Type 2019 & 2032
- Table 62: Global Engineering Plastic Recycling Industry Volume K Tons Forecast, by Plastic Type 2019 & 2032
- Table 63: Global Engineering Plastic Recycling Industry Revenue Million Forecast, by End-user Industry 2019 & 2032
- Table 64: Global Engineering Plastic Recycling Industry Volume K Tons Forecast, by End-user Industry 2019 & 2032
- Table 65: Global Engineering Plastic Recycling Industry Revenue Million Forecast, by Country 2019 & 2032
- Table 66: Global Engineering Plastic Recycling Industry Volume K Tons Forecast, by Country 2019 & 2032
- Table 67: China Engineering Plastic Recycling Industry Revenue (Million) Forecast, by Application 2019 & 2032
- Table 68: China Engineering Plastic Recycling Industry Volume (K Tons) Forecast, by Application 2019 & 2032
- Table 69: India Engineering Plastic Recycling Industry Revenue (Million) Forecast, by Application 2019 & 2032
- Table 70: India Engineering Plastic Recycling Industry Volume (K Tons) Forecast, by Application 2019 & 2032
- Table 71: Japan Engineering Plastic Recycling Industry Revenue (Million) Forecast, by Application 2019 & 2032
- Table 72: Japan Engineering Plastic Recycling Industry Volume (K Tons) Forecast, by Application 2019 & 2032
- Table 73: South Korea Engineering Plastic Recycling Industry Revenue (Million) Forecast, by Application 2019 & 2032
- Table 74: South Korea Engineering Plastic Recycling Industry Volume (K Tons) Forecast, by Application 2019 & 2032
- Table 75: Rest of Asia Pacific Engineering Plastic Recycling Industry Revenue (Million) Forecast, by Application 2019 & 2032
- Table 76: Rest of Asia Pacific Engineering Plastic Recycling Industry Volume (K Tons) Forecast, by Application 2019 & 2032
- Table 77: Global Engineering Plastic Recycling Industry Revenue Million Forecast, by Plastic Type 2019 & 2032
- Table 78: Global Engineering Plastic Recycling Industry Volume K Tons Forecast, by Plastic Type 2019 & 2032
- Table 79: Global Engineering Plastic Recycling Industry Revenue Million Forecast, by End-user Industry 2019 & 2032
- Table 80: Global Engineering Plastic Recycling Industry Volume K Tons Forecast, by End-user Industry 2019 & 2032
- Table 81: Global Engineering Plastic Recycling Industry Revenue Million Forecast, by Country 2019 & 2032
- Table 82: Global Engineering Plastic Recycling Industry Volume K Tons Forecast, by Country 2019 & 2032
- Table 83: United States Engineering Plastic Recycling Industry Revenue (Million) Forecast, by Application 2019 & 2032
- Table 84: United States Engineering Plastic Recycling Industry Volume (K Tons) Forecast, by Application 2019 & 2032
- Table 85: Canada Engineering Plastic Recycling Industry Revenue (Million) Forecast, by Application 2019 & 2032
- Table 86: Canada Engineering Plastic Recycling Industry Volume (K Tons) Forecast, by Application 2019 & 2032
- Table 87: Mexico Engineering Plastic Recycling Industry Revenue (Million) Forecast, by Application 2019 & 2032
- Table 88: Mexico Engineering Plastic Recycling Industry Volume (K Tons) Forecast, by Application 2019 & 2032
- Table 89: Global Engineering Plastic Recycling Industry Revenue Million Forecast, by Plastic Type 2019 & 2032
- Table 90: Global Engineering Plastic Recycling Industry Volume K Tons Forecast, by Plastic Type 2019 & 2032
- Table 91: Global Engineering Plastic Recycling Industry Revenue Million Forecast, by End-user Industry 2019 & 2032
- Table 92: Global Engineering Plastic Recycling Industry Volume K Tons Forecast, by End-user Industry 2019 & 2032
- Table 93: Global Engineering Plastic Recycling Industry Revenue Million Forecast, by Country 2019 & 2032
- Table 94: Global Engineering Plastic Recycling Industry Volume K Tons Forecast, by Country 2019 & 2032
- Table 95: Germany Engineering Plastic Recycling Industry Revenue (Million) Forecast, by Application 2019 & 2032
- Table 96: Germany Engineering Plastic Recycling Industry Volume (K Tons) Forecast, by Application 2019 & 2032
- Table 97: United Kingdom Engineering Plastic Recycling Industry Revenue (Million) Forecast, by Application 2019 & 2032
- Table 98: United Kingdom Engineering Plastic Recycling Industry Volume (K Tons) Forecast, by Application 2019 & 2032
- Table 99: France Engineering Plastic Recycling Industry Revenue (Million) Forecast, by Application 2019 & 2032
- Table 100: France Engineering Plastic Recycling Industry Volume (K Tons) Forecast, by Application 2019 & 2032
- Table 101: Italy Engineering Plastic Recycling Industry Revenue (Million) Forecast, by Application 2019 & 2032
- Table 102: Italy Engineering Plastic Recycling Industry Volume (K Tons) Forecast, by Application 2019 & 2032
- Table 103: Rest of Europe Engineering Plastic Recycling Industry Revenue (Million) Forecast, by Application 2019 & 2032
- Table 104: Rest of Europe Engineering Plastic Recycling Industry Volume (K Tons) Forecast, by Application 2019 & 2032
- Table 105: Global Engineering Plastic Recycling Industry Revenue Million Forecast, by Plastic Type 2019 & 2032
- Table 106: Global Engineering Plastic Recycling Industry Volume K Tons Forecast, by Plastic Type 2019 & 2032
- Table 107: Global Engineering Plastic Recycling Industry Revenue Million Forecast, by End-user Industry 2019 & 2032
- Table 108: Global Engineering Plastic Recycling Industry Volume K Tons Forecast, by End-user Industry 2019 & 2032
- Table 109: Global Engineering Plastic Recycling Industry Revenue Million Forecast, by Country 2019 & 2032
- Table 110: Global Engineering Plastic Recycling Industry Volume K Tons Forecast, by Country 2019 & 2032
- Table 111: South America Engineering Plastic Recycling Industry Revenue (Million) Forecast, by Application 2019 & 2032
- Table 112: South America Engineering Plastic Recycling Industry Volume (K Tons) Forecast, by Application 2019 & 2032
- Table 113: Middle East and Africa Engineering Plastic Recycling Industry Revenue (Million) Forecast, by Application 2019 & 2032
- Table 114: Middle East and Africa Engineering Plastic Recycling Industry Volume (K Tons) Forecast, by Application 2019 & 2032
Frequently Asked Questions
1. What is the projected Compound Annual Growth Rate (CAGR) of the Engineering Plastic Recycling Industry?
The projected CAGR is approximately 7.03%.
2. Which companies are prominent players in the Engineering Plastic Recycling Industry?
Key companies in the market include REPRO-PET, Placon, Euresi Plastics SL, PolyClean Technologies, Indorama Ventures Public Company Limited, Reliance Industries Limited, Krones AG, Petco, Clean Tech UK Ltd, JFC Group, Far Eastern New Century Corporation (Phoenix Technologies), TEIJIN LIMITED, UltrePET LLC, Alpek S A B de C V, EF Plastics UK Ltd.
3. What are the main segments of the Engineering Plastic Recycling Industry?
The market segments include Plastic Type, End-user Industry.
4. Can you provide details about the market size?
The market size is estimated to be USD XX Million as of 2022.
5. What are some drivers contributing to market growth?
Growing Emphasis on Sustainability among Consumer and Packaging Products; Increasing Use of Recycled Polyester; Other Drivers.
6. What are the notable trends driving market growth?
Packaging Industry to Dominate the Market.
7. Are there any restraints impacting market growth?
Difficulty in Collecting and Sorting Mixed Plastic; Other Restraints.
8. Can you provide examples of recent developments in the market?
October 2022: Indorama Venturas announced the opening of a PET Value bottle-to-bottle recycling plant in the Philippines in partnership with Coca-Cola Beverages Philippines.
9. What pricing options are available for accessing the report?
Pricing options include single-user, multi-user, and enterprise licenses priced at USD 4750, USD 5250, and USD 8750 respectively.
10. Is the market size provided in terms of value or volume?
The market size is provided in terms of value, measured in Million and volume, measured in K Tons.
11. Are there any specific market keywords associated with the report?
Yes, the market keyword associated with the report is "Engineering Plastic Recycling Industry," which aids in identifying and referencing the specific market segment covered.
12. How do I determine which pricing option suits my needs best?
The pricing options vary based on user requirements and access needs. Individual users may opt for single-user licenses, while businesses requiring broader access may choose multi-user or enterprise licenses for cost-effective access to the report.
13. Are there any additional resources or data provided in the Engineering Plastic Recycling Industry report?
While the report offers comprehensive insights, it's advisable to review the specific contents or supplementary materials provided to ascertain if additional resources or data are available.
14. How can I stay updated on further developments or reports in the Engineering Plastic Recycling Industry?
To stay informed about further developments, trends, and reports in the Engineering Plastic Recycling Industry, consider subscribing to industry newsletters, following relevant companies and organizations, or regularly checking reputable industry news sources and publications.
Methodology
Step 1 - Identification of Relevant Samples Size from Population Database


Step 2 - Approaches for Defining Global Market Size (Value, Volume* & Price*)

Note*: In applicable scenarios
Step 3 - Data Sources
Primary Research
- Web Analytics
- Survey Reports
- Research Institute
- Latest Research Reports
- Opinion Leaders
Secondary Research
- Annual Reports
- White Paper
- Latest Press Release
- Industry Association
- Paid Database
- Investor Presentations

Step 4 - Data Triangulation
Involves using different sources of information in order to increase the validity of a study
These sources are likely to be stakeholders in a program - participants, other researchers, program staff, other community members, and so on.
Then we put all data in single framework & apply various statistical tools to find out the dynamic on the market.
During the analysis stage, feedback from the stakeholder groups would be compared to determine areas of agreement as well as areas of divergence


