

Key Insights
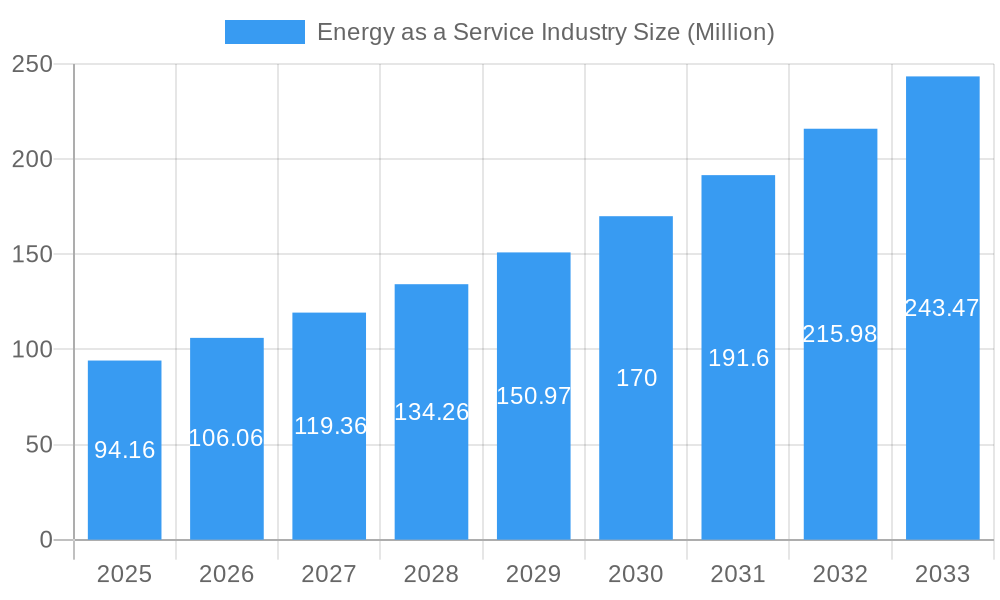
The Energy as a Service (EaaS) market, valued at $94.16 million in 2025, is poised for significant growth, exhibiting a Compound Annual Growth Rate (CAGR) of 12.48% from 2025 to 2033. This robust expansion is driven by several key factors. Increasing energy costs and the urgent need for energy efficiency are compelling businesses and industries to adopt EaaS models. These models offer predictable operational expenditure, reduced upfront capital investment, and access to advanced technologies like smart grids and renewable energy sources, thereby enhancing sustainability efforts. The shift towards decarbonization initiatives, coupled with stringent government regulations promoting renewable energy adoption, further fuels market growth. Technological advancements in energy management systems and the rise of data analytics providing optimized energy solutions are also contributing factors. The market segmentation reveals a strong demand across both commercial and industrial end-users, with commercial sectors potentially showing faster adoption due to quicker ROI opportunities. Geographic distribution shows North America and Europe currently hold significant market share, driven by strong policy support and early adoption of advanced technologies. However, Asia-Pacific is predicted to experience rapid growth in the coming years, fueled by increasing industrialization and government investments in sustainable energy solutions.
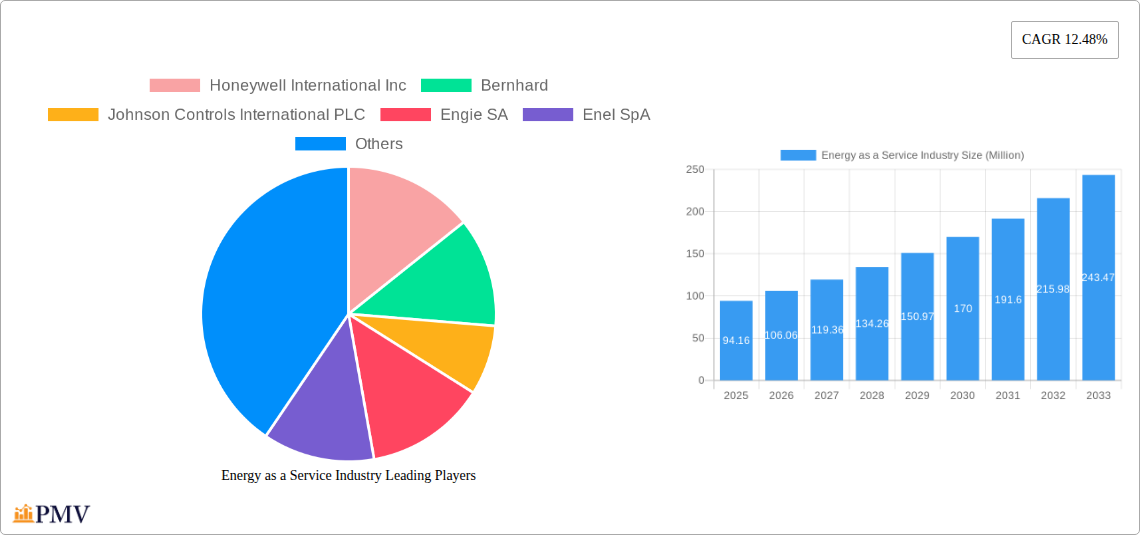
Energy as a Service Industry Market Size (In Million)
The competitive landscape is characterized by a mix of established players like Honeywell International Inc., Johnson Controls, and Schneider Electric, alongside emerging energy service providers. These companies are actively engaging in strategic partnerships, acquisitions, and technological innovations to expand their market presence and cater to the evolving needs of various end-users. While initial investment hurdles and concerns around data security could act as potential restraints, the overall market outlook for EaaS remains positive, anticipating substantial growth across different geographic regions and industry sectors. Continued technological advancements and supportive government policies will be crucial in shaping the future trajectory of this dynamic market.
Energy as a Service Industry Company Market Share
Energy as a Service (EaaS) Industry Market Report: 2019-2033
This comprehensive report provides a detailed analysis of the Energy as a Service (EaaS) industry, covering market structure, competitive dynamics, growth drivers, challenges, and future outlook. The study period spans from 2019 to 2033, with 2025 serving as both the base and estimated year. The forecast period is 2025-2033, and the historical period covers 2019-2024. The report values are expressed in Millions.
Energy as a Service Industry Market Structure & Competitive Dynamics
The EaaS market is characterized by a moderately concentrated structure with several key players vying for market share. The top ten companies, including Honeywell International Inc, Bernhard, Johnson Controls International PLC, Engie SA, Enel SpA, Spark Community Investment Co, Schneider Electric SE, Veolia Environnement SA, and Electricite de France (EDF) SA, collectively hold an estimated xx% of the market in 2025. However, the landscape is dynamic, with significant M&A activity impacting market concentration. Total M&A deal value in the historical period reached approximately $xx Million, with an average deal size of $xx Million. Innovation ecosystems are flourishing, driven by advancements in IoT, AI, and renewable energy technologies. Regulatory frameworks, varying across regions, significantly impact market growth and adoption rates. Product substitutes, primarily traditional energy procurement models, still pose a competitive challenge, although the EaaS model’s advantages in cost savings and sustainability are increasingly compelling. End-user trends indicate a shift towards flexible, outcome-based energy solutions, favoring EaaS adoption.
- Market Concentration: Moderately concentrated, with top 10 players holding xx% market share (2025).
- M&A Activity: Total deal value of approximately $xx Million (2019-2024), average deal size $xx Million.
- Innovation: Strong focus on IoT, AI, and renewable energy integration.
- Regulatory Landscape: Varies significantly across regions, impacting growth and adoption.
- Substitutes: Traditional energy procurement models remain a competitive threat.
- End-User Trends: Increasing preference for flexible, outcome-based energy solutions.
Energy as a Service Industry Industry Trends & Insights
The EaaS market exhibits robust growth, driven by increasing demand for energy efficiency, sustainability, and reduced operational costs. The global market is projected to reach $xx Million by 2033, exhibiting a Compound Annual Growth Rate (CAGR) of xx% during the forecast period. This growth is fueled by several key trends: a rising awareness of environmental sustainability, government incentives and regulations promoting renewable energy adoption, the decreasing cost of renewable energy technologies, and the increasing sophistication of energy management systems. Technological disruptions, including advancements in smart grids, energy storage, and predictive analytics, are further accelerating EaaS adoption. Consumer preferences are shifting towards transparent, predictable energy pricing and reduced energy consumption, which aligns perfectly with the EaaS model’s value proposition. Competitive dynamics are intense, with companies focusing on innovation, strategic partnerships, and geographic expansion to gain a competitive edge. Market penetration is expected to reach xx% by 2033, driven by increased awareness and acceptance of the EaaS model among commercial and industrial end-users.
Dominant Markets & Segments in Energy as a Service Industry
The Commercial segment currently dominates the EaaS market, driven by the large number of commercial buildings seeking to optimize energy consumption and reduce operational expenses. North America holds the largest market share, primarily due to strong government support for energy efficiency initiatives and a large base of commercial and industrial buildings.
- Key Drivers for Commercial Segment Dominance:
- Strong government incentives and regulations for energy efficiency.
- Large number of commercial buildings seeking energy optimization.
- Growing awareness of sustainability and corporate social responsibility.
- Key Drivers for Industrial Segment Growth:
- Increased demand for reliable and cost-effective energy solutions in manufacturing.
- Opportunities for energy efficiency improvements in industrial processes.
- Growing focus on reducing carbon footprint in industrial operations.
Energy as a Service Industry Product Innovations
Recent innovations in the EaaS space include the integration of advanced analytics, AI-powered energy management systems, and the adoption of renewable energy sources like solar and wind. This results in more efficient energy consumption and cost savings for customers. The market is witnessing a shift toward more comprehensive EaaS offerings that encompass not just energy supply but also energy management and optimization services. This holistic approach delivers significant value to end-users and enhances the competitive advantages of EaaS providers.
Report Segmentation & Scope
This report segments the EaaS market by end-user: Commercial and Industrial. The Commercial segment is projected to exhibit a CAGR of xx% during the forecast period, driven by increasing adoption of energy-efficient technologies and government incentives. The Industrial segment is expected to grow at a CAGR of xx%, fueled by rising energy costs and the need to improve operational efficiency. Competitive dynamics within each segment vary, with some companies specializing in specific industries or building types.
Key Drivers of Energy as a Service Industry Growth
Technological advancements such as the Internet of Things (IoT), Artificial Intelligence (AI), and advancements in renewable energy technologies are significantly driving EaaS adoption. Favorable government policies and regulations promoting energy efficiency and sustainability further accelerate market growth. Cost savings and improved energy management are key economic drivers, attracting businesses seeking to optimize their energy expenses.
Challenges in the Energy as a Service Industry Sector
The EaaS industry faces several challenges, including regulatory uncertainties regarding energy pricing and the integration of distributed generation resources. Supply chain disruptions and the availability of skilled workforce can also affect project implementation. Intense competition among established players and new entrants presents significant competitive pressure. These challenges can lead to project delays, cost overruns and reduced profitability for EaaS providers. These factors combined can impact the overall market growth negatively.
Leading Players in the Energy as a Service Industry Market
- Honeywell International Inc
- Bernhard
- Johnson Controls International PLC
- Engie SA
- Enel SpA
- Spark Community Investment Co
- Schneider Electric SE
- Veolia Environnement SA
- Electricite de France (EDF) SA
Key Developments in Energy as a Service Industry Sector
- March 2023: Honeywell announced a strategic investment in Redaptive to accelerate the delivery of EaaS capabilities to commercial and industrial buildings, boosting the implementation of carbon-reducing technologies.
- April 2023: Capstone Green Energy Corporation secured a contract for an additional C800S Signature Series microturbine, expanding its EaaS portfolio with a 3.6 MW contract.
Strategic Energy as a Service Industry Market Outlook
The EaaS market holds significant potential for future growth, driven by increasing energy costs, heightened environmental concerns, and ongoing technological advancements. Strategic opportunities exist for companies to expand their service offerings, forge strategic partnerships, and tap into emerging markets. A focus on innovation, customer engagement, and regulatory compliance will be crucial for success in this dynamic industry. The long-term outlook remains positive, with strong growth potential across various segments and geographies.
Energy as a Service Industry Segmentation
-
1. End User
- 1.1. Commercial
- 1.2. Industrial
Energy as a Service Industry Segmentation By Geography
-
1. North America
- 1.1. United States
- 1.2. Canada
- 1.3. Rest of North America
-
2. Europe
- 2.1. Germany
- 2.2. France
- 2.3. United Kingdom
- 2.4. Rest of Europe
-
3. Asia Pacific
- 3.1. China
- 3.2. India
- 3.3. Japan
- 3.4. South Korea
- 3.5. Rest of Asia Pacific
-
4. South America
- 4.1. Brazil
- 4.2. Argentina
- 4.3. Rest of South America
-
5. Middle East and Africa
- 5.1. Saudi Arabia
- 5.2. United Arab Emirates
- 5.3. South Africa
- 5.4. Rest of Middle East and Africa
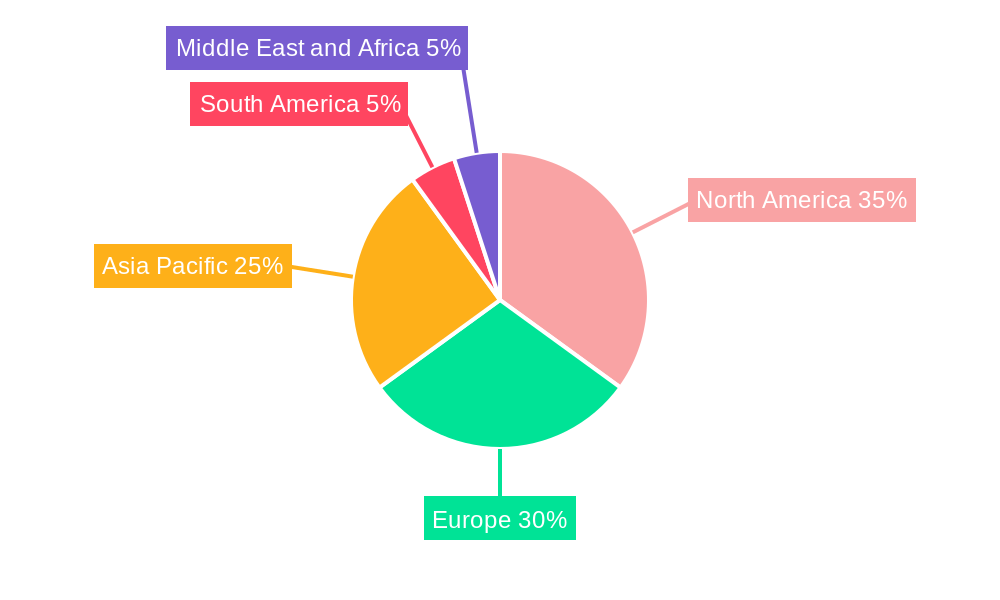
Energy as a Service Industry Regional Market Share
Geographic Coverage of Energy as a Service Industry
Energy as a Service Industry REPORT HIGHLIGHTS
| Aspects | Details |
|---|---|
| Study Period | 2020-2034 |
| Base Year | 2025 |
| Estimated Year | 2026 |
| Forecast Period | 2026-2034 |
| Historical Period | 2020-2025 |
| Growth Rate | CAGR of 12.48% from 2020-2034 |
| Segmentation |
|
Table of Contents
- 1. Introduction
- 1.1. Research Scope
- 1.2. Market Segmentation
- 1.3. Research Objective
- 1.4. Definitions and Assumptions
- 2. Executive Summary
- 2.1. Market Snapshot
- 3. Market Dynamics
- 3.1. Market Drivers
- 3.2. Market Restrains
- 3.3. Market Trends
- 3.4. Market Opportunities
- 4. Market Factor Analysis
- 4.1. Porters Five Forces
- 4.1.1. Bargaining Power of Suppliers
- 4.1.2. Bargaining Power of Buyers
- 4.1.3. Threat of New Entrants
- 4.1.4. Threat of Substitutes
- 4.1.5. Competitive Rivalry
- 4.2. PESTEL analysis
- 4.3. BCG Analysis
- 4.3.1. Stars (High Growth, High Market Share)
- 4.3.2. Cash Cows (Low Growth, High Market Share)
- 4.3.3. Question Mark (High Growth, Low Market Share)
- 4.3.4. Dogs (Low Growth, Low Market Share)
- 4.4. Ansoff Matrix Analysis
- 4.5. Supply Chain Analysis
- 4.6. Regulatory Landscape
- 4.7. Current Market Potential and Opportunity Assessment (TAM–SAM–SOM Framework)
- 4.8. PMV Analyst Note
- 4.1. Porters Five Forces
- 5. Market Analysis, Insights and Forecast 2021-2033
- 5.1. Market Analysis, Insights and Forecast - by End User
- 5.1.1. Commercial
- 5.1.2. Industrial
- 5.2. Market Analysis, Insights and Forecast - by Region
- 5.2.1. North America
- 5.2.2. Europe
- 5.2.3. Asia Pacific
- 5.2.4. South America
- 5.2.5. Middle East and Africa
- 5.1. Market Analysis, Insights and Forecast - by End User
- 6. Global Energy as a Service Industry Analysis, Insights and Forecast, 2021-2033
- 6.1. Market Analysis, Insights and Forecast - by End User
- 6.1.1. Commercial
- 6.1.2. Industrial
- 6.1. Market Analysis, Insights and Forecast - by End User
- 7. North America Energy as a Service Industry Analysis, Insights and Forecast, 2020-2032
- 7.1. Market Analysis, Insights and Forecast - by End User
- 7.1.1. Commercial
- 7.1.2. Industrial
- 7.1. Market Analysis, Insights and Forecast - by End User
- 8. Europe Energy as a Service Industry Analysis, Insights and Forecast, 2020-2032
- 8.1. Market Analysis, Insights and Forecast - by End User
- 8.1.1. Commercial
- 8.1.2. Industrial
- 8.1. Market Analysis, Insights and Forecast - by End User
- 9. Asia Pacific Energy as a Service Industry Analysis, Insights and Forecast, 2020-2032
- 9.1. Market Analysis, Insights and Forecast - by End User
- 9.1.1. Commercial
- 9.1.2. Industrial
- 9.1. Market Analysis, Insights and Forecast - by End User
- 10. South America Energy as a Service Industry Analysis, Insights and Forecast, 2020-2032
- 10.1. Market Analysis, Insights and Forecast - by End User
- 10.1.1. Commercial
- 10.1.2. Industrial
- 10.1. Market Analysis, Insights and Forecast - by End User
- 11. Middle East and Africa Energy as a Service Industry Analysis, Insights and Forecast, 2020-2032
- 11.1. Market Analysis, Insights and Forecast - by End User
- 11.1.1. Commercial
- 11.1.2. Industrial
- 11.1. Market Analysis, Insights and Forecast - by End User
- 12. Competitive Analysis
- 12.1. Company Profiles
- 12.1.1 Honeywell International Inc
- 12.1.1.1. Company Overview
- 12.1.1.2. Products
- 12.1.1.3. Company Financials
- 12.1.1.4. SWOT Analysis
- 12.1.2 Bernhard
- 12.1.2.1. Company Overview
- 12.1.2.2. Products
- 12.1.2.3. Company Financials
- 12.1.2.4. SWOT Analysis
- 12.1.3 Johnson Controls International PLC
- 12.1.3.1. Company Overview
- 12.1.3.2. Products
- 12.1.3.3. Company Financials
- 12.1.3.4. SWOT Analysis
- 12.1.4 Engie SA
- 12.1.4.1. Company Overview
- 12.1.4.2. Products
- 12.1.4.3. Company Financials
- 12.1.4.4. SWOT Analysis
- 12.1.5 Enel SpA
- 12.1.5.1. Company Overview
- 12.1.5.2. Products
- 12.1.5.3. Company Financials
- 12.1.5.4. SWOT Analysis
- 12.1.6 Spark Community Investment Co
- 12.1.6.1. Company Overview
- 12.1.6.2. Products
- 12.1.6.3. Company Financials
- 12.1.6.4. SWOT Analysis
- 12.1.7 Schneider Electric SE
- 12.1.7.1. Company Overview
- 12.1.7.2. Products
- 12.1.7.3. Company Financials
- 12.1.7.4. SWOT Analysis
- 12.1.8 Veolia Environnement SA
- 12.1.8.1. Company Overview
- 12.1.8.2. Products
- 12.1.8.3. Company Financials
- 12.1.8.4. SWOT Analysis
- 12.1.9 Electricite de France (EDF) SA
- 12.1.9.1. Company Overview
- 12.1.9.2. Products
- 12.1.9.3. Company Financials
- 12.1.9.4. SWOT Analysis
- 12.1.1 Honeywell International Inc
- 12.2. Market Entropy
- 12.2.1 Company's Key Areas Served
- 12.2.2 Recent Developments
- 12.3. Company Market Share Analysis 2025
- 12.3.1 Top 5 Companies Market Share Analysis
- 12.3.2 Top 3 Companies Market Share Analysis
- 12.4. List of Potential Customers
- 13. Research Methodology
List of Figures
- Figure 1: Global Energy as a Service Industry Revenue Breakdown (Million, %) by Region 2025 & 2033
- Figure 2: North America Energy as a Service Industry Revenue (Million), by End User 2025 & 2033
- Figure 3: North America Energy as a Service Industry Revenue Share (%), by End User 2025 & 2033
- Figure 4: North America Energy as a Service Industry Revenue (Million), by Country 2025 & 2033
- Figure 5: North America Energy as a Service Industry Revenue Share (%), by Country 2025 & 2033
- Figure 6: Europe Energy as a Service Industry Revenue (Million), by End User 2025 & 2033
- Figure 7: Europe Energy as a Service Industry Revenue Share (%), by End User 2025 & 2033
- Figure 8: Europe Energy as a Service Industry Revenue (Million), by Country 2025 & 2033
- Figure 9: Europe Energy as a Service Industry Revenue Share (%), by Country 2025 & 2033
- Figure 10: Asia Pacific Energy as a Service Industry Revenue (Million), by End User 2025 & 2033
- Figure 11: Asia Pacific Energy as a Service Industry Revenue Share (%), by End User 2025 & 2033
- Figure 12: Asia Pacific Energy as a Service Industry Revenue (Million), by Country 2025 & 2033
- Figure 13: Asia Pacific Energy as a Service Industry Revenue Share (%), by Country 2025 & 2033
- Figure 14: South America Energy as a Service Industry Revenue (Million), by End User 2025 & 2033
- Figure 15: South America Energy as a Service Industry Revenue Share (%), by End User 2025 & 2033
- Figure 16: South America Energy as a Service Industry Revenue (Million), by Country 2025 & 2033
- Figure 17: South America Energy as a Service Industry Revenue Share (%), by Country 2025 & 2033
- Figure 18: Middle East and Africa Energy as a Service Industry Revenue (Million), by End User 2025 & 2033
- Figure 19: Middle East and Africa Energy as a Service Industry Revenue Share (%), by End User 2025 & 2033
- Figure 20: Middle East and Africa Energy as a Service Industry Revenue (Million), by Country 2025 & 2033
- Figure 21: Middle East and Africa Energy as a Service Industry Revenue Share (%), by Country 2025 & 2033
List of Tables
- Table 1: Global Energy as a Service Industry Revenue Million Forecast, by End User 2020 & 2033
- Table 2: Global Energy as a Service Industry Revenue Million Forecast, by Region 2020 & 2033
- Table 3: Global Energy as a Service Industry Revenue Million Forecast, by End User 2020 & 2033
- Table 4: Global Energy as a Service Industry Revenue Million Forecast, by Country 2020 & 2033
- Table 5: United States Energy as a Service Industry Revenue (Million) Forecast, by Application 2020 & 2033
- Table 6: Canada Energy as a Service Industry Revenue (Million) Forecast, by Application 2020 & 2033
- Table 7: Rest of North America Energy as a Service Industry Revenue (Million) Forecast, by Application 2020 & 2033
- Table 8: Global Energy as a Service Industry Revenue Million Forecast, by End User 2020 & 2033
- Table 9: Global Energy as a Service Industry Revenue Million Forecast, by Country 2020 & 2033
- Table 10: Germany Energy as a Service Industry Revenue (Million) Forecast, by Application 2020 & 2033
- Table 11: France Energy as a Service Industry Revenue (Million) Forecast, by Application 2020 & 2033
- Table 12: United Kingdom Energy as a Service Industry Revenue (Million) Forecast, by Application 2020 & 2033
- Table 13: Rest of Europe Energy as a Service Industry Revenue (Million) Forecast, by Application 2020 & 2033
- Table 14: Global Energy as a Service Industry Revenue Million Forecast, by End User 2020 & 2033
- Table 15: Global Energy as a Service Industry Revenue Million Forecast, by Country 2020 & 2033
- Table 16: China Energy as a Service Industry Revenue (Million) Forecast, by Application 2020 & 2033
- Table 17: India Energy as a Service Industry Revenue (Million) Forecast, by Application 2020 & 2033
- Table 18: Japan Energy as a Service Industry Revenue (Million) Forecast, by Application 2020 & 2033
- Table 19: South Korea Energy as a Service Industry Revenue (Million) Forecast, by Application 2020 & 2033
- Table 20: Rest of Asia Pacific Energy as a Service Industry Revenue (Million) Forecast, by Application 2020 & 2033
- Table 21: Global Energy as a Service Industry Revenue Million Forecast, by End User 2020 & 2033
- Table 22: Global Energy as a Service Industry Revenue Million Forecast, by Country 2020 & 2033
- Table 23: Brazil Energy as a Service Industry Revenue (Million) Forecast, by Application 2020 & 2033
- Table 24: Argentina Energy as a Service Industry Revenue (Million) Forecast, by Application 2020 & 2033
- Table 25: Rest of South America Energy as a Service Industry Revenue (Million) Forecast, by Application 2020 & 2033
- Table 26: Global Energy as a Service Industry Revenue Million Forecast, by End User 2020 & 2033
- Table 27: Global Energy as a Service Industry Revenue Million Forecast, by Country 2020 & 2033
- Table 28: Saudi Arabia Energy as a Service Industry Revenue (Million) Forecast, by Application 2020 & 2033
- Table 29: United Arab Emirates Energy as a Service Industry Revenue (Million) Forecast, by Application 2020 & 2033
- Table 30: South Africa Energy as a Service Industry Revenue (Million) Forecast, by Application 2020 & 2033
- Table 31: Rest of Middle East and Africa Energy as a Service Industry Revenue (Million) Forecast, by Application 2020 & 2033
Frequently Asked Questions
1. What is the projected Compound Annual Growth Rate (CAGR) of the Energy as a Service Industry?
The projected CAGR is approximately 12.48%.
2. Which companies are prominent players in the Energy as a Service Industry?
Key companies in the market include Honeywell International Inc, Bernhard, Johnson Controls International PLC, Engie SA, Enel SpA, Spark Community Investment Co, Schneider Electric SE, Veolia Environnement SA, Electricite de France (EDF) SA.
3. What are the main segments of the Energy as a Service Industry?
The market segments include End User.
4. Can you provide details about the market size?
The market size is estimated to be USD 94.16 Million as of 2022.
5. What are some drivers contributing to market growth?
4.; Growing Demand for Energy As A Service4.; Increasing Adoption of Distributed Energy Generation in Commercial and Industrial Sectors.
6. What are the notable trends driving market growth?
Commercial Segment to Dominate the Market.
7. Are there any restraints impacting market growth?
4.; Lack of Awareness in Developing Economies and High Technological Costs.
8. Can you provide examples of recent developments in the market?
April 2023: Capstone Green Energy Corporation announced that its southern U.S. distributor, Lone Star Power Solutions, contracted with a large West Texas energy company to deliver an additional C800S Signature Series microturbine following Energy-as-a-Service (EaaS) for 3.6 MW contract earlier this year.
9. What pricing options are available for accessing the report?
Pricing options include single-user, multi-user, and enterprise licenses priced at USD 4750, USD 5250, and USD 8750 respectively.
10. Is the market size provided in terms of value or volume?
The market size is provided in terms of value, measured in Million.
11. Are there any specific market keywords associated with the report?
Yes, the market keyword associated with the report is "Energy as a Service Industry," which aids in identifying and referencing the specific market segment covered.
12. How do I determine which pricing option suits my needs best?
The pricing options vary based on user requirements and access needs. Individual users may opt for single-user licenses, while businesses requiring broader access may choose multi-user or enterprise licenses for cost-effective access to the report.
13. Are there any additional resources or data provided in the Energy as a Service Industry report?
While the report offers comprehensive insights, it's advisable to review the specific contents or supplementary materials provided to ascertain if additional resources or data are available.
14. How can I stay updated on further developments or reports in the Energy as a Service Industry?
To stay informed about further developments, trends, and reports in the Energy as a Service Industry, consider subscribing to industry newsletters, following relevant companies and organizations, or regularly checking reputable industry news sources and publications.
Methodology
Step 1 - Identification of Relevant Samples Size from Population Database


Step 2 - Approaches for Defining Global Market Size (Value, Volume* & Price*)

Note*: In applicable scenarios
Step 3 - Data Sources
Primary Research
- Web Analytics
- Survey Reports
- Research Institute
- Latest Research Reports
- Opinion Leaders
Secondary Research
- Annual Reports
- White Paper
- Latest Press Release
- Industry Association
- Paid Database
- Investor Presentations

Step 4 - Data Triangulation
Involves using different sources of information in order to increase the validity of a study
These sources are likely to be stakeholders in a program - participants, other researchers, program staff, other community members, and so on.
Then we put all data in single framework & apply various statistical tools to find out the dynamic on the market.
During the analysis stage, feedback from the stakeholder groups would be compared to determine areas of agreement as well as areas of divergence