

Key Insights
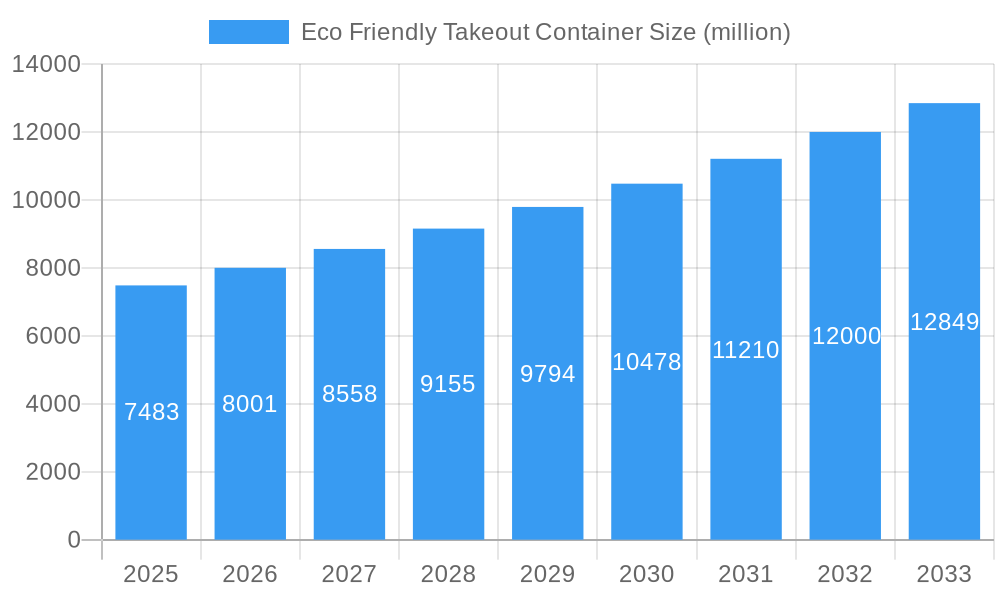
The Eco-Friendly Takeout Container market is poised for significant expansion, projected to reach $7483 million by 2025, demonstrating a robust Compound Annual Growth Rate (CAGR) of 6.5% through the forecast period of 2025-2033. This surge is primarily driven by a confluence of increasing consumer awareness regarding environmental sustainability and stringent governmental regulations promoting the adoption of eco-friendly packaging solutions. The growing demand for convenient food services, particularly from the restaurant and café sectors, is a major catalyst, as businesses increasingly seek to align their brand image with environmentally responsible practices. Key trends include the rising popularity of compostable and biodegradable materials, innovations in plant-based packaging derived from sources like sugarcane and cornstarch, and a growing preference for reusable container programs. The market is also witnessing a push towards customizable and aesthetically pleasing designs that do not compromise on functionality and eco-credentials.
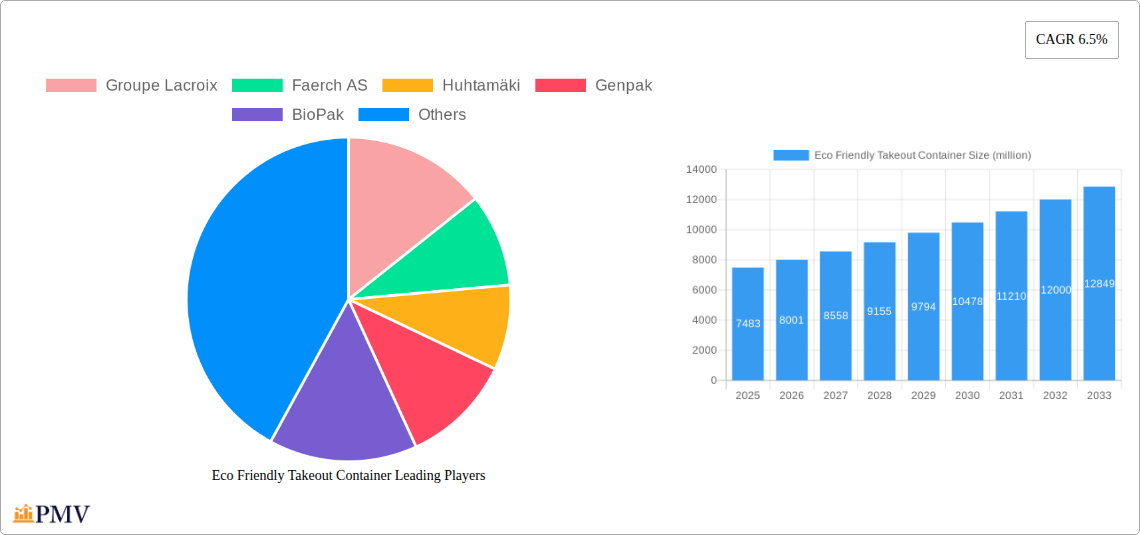
Eco Friendly Takeout Container Market Size (In Billion)
However, certain factors could temper this growth. The restrains impacting the market include the potentially higher upfront cost of eco-friendly containers compared to traditional plastic or styrofoam alternatives, which can be a deterrent for smaller businesses. Supply chain disruptions and the availability of raw materials for sustainable packaging can also pose challenges. Furthermore, variations in local recycling and composting infrastructure can affect the perceived effectiveness and convenience of these products in different regions. Despite these hurdles, the overarching shift towards a circular economy and a collective global commitment to reducing plastic waste are expected to propel the eco-friendly takeout container market forward, fostering innovation and driving down costs over time. The market is segmented across various applications like restaurants, café shops, and other food service providers, with types including clamshell packaging, food boxes, bowls, and other specialized containers.
Eco Friendly Takeout Container Company Market Share
This in-depth report provides a detailed market analysis of the Eco Friendly Takeout Container industry, encompassing market structure, competitive dynamics, key trends, dominant segments, product innovations, growth drivers, challenges, leading players, recent developments, and a strategic future outlook. Designed for industry stakeholders, this report offers actionable insights to navigate the evolving landscape of sustainable food packaging. The study covers the historical period from 2019 to 2024, with the base year set at 2025 and an extensive forecast period extending from 2025 to 2033.
Eco Friendly Takeout Container Market Structure & Competitive Dynamics
The eco friendly takeout container market exhibits a moderately concentrated structure, with key players like Huhtamäki, Pactiv Evergreen, and Dart Container holding significant market share, estimated to be in the hundreds of millions of dollars. Innovation ecosystems are robust, driven by material science advancements and increasing consumer demand for sustainable alternatives. Regulatory frameworks, particularly concerning single-use plastics and mandated recycling, are increasingly shaping market entry and product development. Product substitutes, ranging from reusable containers to alternative disposable materials, present a dynamic competitive landscape. End-user trends are heavily influenced by environmental consciousness, with consumers actively seeking out brands committed to sustainability. Mergers and acquisitions (M&A) are a notable feature, with strategic acquisitions by larger entities to expand their eco-friendly product portfolios and market reach. Estimated M&A deal values are in the tens to hundreds of millions of dollars, reflecting the strategic importance of this segment.
- Market Concentration: Moderately concentrated, with top players holding substantial market share.
- Innovation Ecosystems: Driven by material science and consumer demand.
- Regulatory Frameworks: Increasing influence of environmental legislation.
- Product Substitutes: Diverse range of alternatives impacting market share.
- End-User Trends: Growing consumer preference for sustainable packaging.
- M&A Activities: Strategic acquisitions to enhance market position and product offerings.
Eco Friendly Takeout Container Industry Trends & Insights
The eco friendly takeout container industry is experiencing significant growth, propelled by a confluence of factors. The increasing global awareness of environmental issues, coupled with stringent government regulations aimed at reducing plastic waste, serves as a primary market growth driver. Technological disruptions, including advancements in biodegradable and compostable materials such as plant-based fibers, sugarcane bagasse, and advanced bioplastics, are enabling the development of high-performance and cost-effective eco-friendly containers. Consumer preferences are rapidly shifting towards sustainable options, with a growing segment of the population willing to pay a premium for environmentally responsible packaging. This shift is compelling restaurants and food service providers to adopt eco-friendly solutions to meet customer expectations and enhance their brand image. Competitive dynamics are intensifying, with established packaging manufacturers expanding their sustainable product lines and new entrants focusing exclusively on eco-friendly innovations. Market penetration of eco-friendly takeout containers is projected to witness a Compound Annual Growth Rate (CAGR) of approximately xx% over the forecast period, indicating a robust expansion trajectory. The market size for eco-friendly takeout containers is anticipated to reach several hundred million dollars by 2033, driven by both increasing adoption and evolving product capabilities. The demand for innovative solutions that offer superior barrier properties, heat resistance, and leak-proof performance, while remaining compostable or recyclable, is a key area of focus. Furthermore, the rise of e-commerce and food delivery services has amplified the need for robust and sustainable packaging solutions that can withstand transportation and maintain food integrity.
Dominant Markets & Segments in Eco Friendly Takeout Container
The global eco friendly takeout container market is characterized by strong regional dominance and segmented growth across various applications and product types. North America and Europe currently represent the largest markets, driven by proactive environmental policies, high consumer awareness, and a well-established food service industry. Within these regions, countries like the United States and Germany are at the forefront of adoption.
Application Segment Dominance:
- Restaurants: This segment holds the largest market share, estimated in the hundreds of millions of dollars, owing to the widespread use of takeout and delivery services. Increasing consumer demand for sustainable options by restaurant chains and independent eateries fuels this dominance. Economic policies encouraging waste reduction and supporting eco-friendly businesses further bolster this segment.
- Café Shops: While smaller than restaurants, café shops are witnessing rapid growth in their adoption of eco friendly takeout containers. The convenience-oriented nature of café offerings, coupled with a growing customer base seeking sustainable choices, makes this segment a significant contributor to market expansion.
- Others: This segment, encompassing catering services, corporate canteens, and event venues, also contributes significantly. The increasing focus on corporate social responsibility and sustainable event planning is a key driver here.
Type Segment Dominance:
- Clamshell Packaging: This type of packaging is highly dominant, estimated to account for a substantial portion of the market value, in the hundreds of millions of dollars. Its versatility for a wide range of food items, from sandwiches to salads, makes it a preferred choice for takeout.
- Foodbox: Traditional food boxes, particularly those designed for meal prep and larger portions, are also a significant segment. Their reusability potential and growing availability in eco-friendly materials are key drivers.
- Bowl: Bowls are increasingly popular for salads, grain bowls, and soups, driving demand for eco-friendly bowl options. The segment's growth is linked to evolving culinary trends.
- Other: This category includes various specialized containers such as cups, trays, and cutlery, which are also seeing a shift towards sustainable materials.
Infrastructure development supporting composting and recycling facilities plays a crucial role in the growth and dominance of these segments, particularly for compostable packaging options.
Eco Friendly Takeout Container Product Innovations
Product innovations in the eco friendly takeout container market are focused on enhancing sustainability, functionality, and cost-effectiveness. Developments include advanced biodegradable and compostable materials derived from renewable resources, offering improved grease and moisture resistance. Innovations also encompass optimized designs for stacking, shipping, and consumer convenience, while minimizing material usage. These advancements provide competitive advantages by addressing specific end-user needs for leak-proof, heat-resistant, and visually appealing packaging.
Report Segmentation & Scope
This report segments the eco friendly takeout container market based on key application and type categories. The Application segmentation includes Restaurants, Café Shops, and Others, each representing distinct market dynamics and growth trajectories. Restaurants are projected to maintain their leading position, driven by high volume demand. Café Shops are anticipated to exhibit the highest CAGR due to their growing embrace of sustainable practices. The Type segmentation encompasses Clamshell Packaging, Foodbox, Bowl, and Other types. Clamshell packaging is expected to dominate in terms of market share, while bowls are poised for significant growth driven by culinary trends. The competitive dynamics within each segment are influenced by material innovation, pricing strategies, and regulatory compliance.
Key Drivers of Eco Friendly Takeout Container Growth
The eco friendly takeout container market is propelled by several key drivers.
- Environmental Consciousness: Growing global awareness of plastic pollution and climate change is a primary motivator for consumers and businesses.
- Regulatory Mandates: Government regulations worldwide are increasingly restricting single-use plastics and promoting sustainable packaging alternatives.
- Technological Advancements: Innovations in biodegradable, compostable, and recyclable materials offer improved performance and cost-effectiveness.
- Consumer Demand: A significant and growing segment of consumers actively seeks out and prefers products packaged sustainably.
- Corporate Sustainability Initiatives: Companies are adopting eco-friendly packaging as part of their broader corporate social responsibility (CSR) efforts to enhance brand image and meet stakeholder expectations.
Challenges in the Eco Friendly Takeout Container Sector
Despite robust growth, the eco friendly takeout container sector faces several challenges.
- Cost Competitiveness: Many eco-friendly materials are currently more expensive than traditional plastics, posing a barrier to widespread adoption, especially for price-sensitive businesses.
- Infrastructure Limitations: The availability and accessibility of proper composting and recycling facilities are critical for the effective end-of-life management of biodegradable and compostable containers, which is not uniform globally.
- Performance Gaps: Some eco-friendly materials may still lag behind traditional plastics in terms of barrier properties, heat resistance, or durability for certain applications.
- Consumer Confusion: Misinformation and confusion regarding the biodegradability, compostability, and recyclability of different materials can hinder effective waste sorting and disposal.
- Supply Chain Volatility: Ensuring a consistent and reliable supply of sustainable raw materials can be challenging due to agricultural yields, geopolitical factors, and global demand fluctuations.
Leading Players in the Eco Friendly Takeout Container Market
- Groupe Lacroix
- Faerch AS
- Huhtamäki
- Genpak
- BioPak
- Vegware
- Van De Velde Packaging
- Sabert
- Reynolds
- Dart Container
- Graphic Packaging
- Dixie Consumer Products
- Karat Packaging
- PakPlast
- Pactiv Evergreen
Key Developments in Eco Friendly Takeout Container Sector
- 2023: Huhtamäki launched a new line of molded fiber packaging solutions made from sustainably sourced wood pulp, targeting the food service industry.
- 2023: Vegware expanded its international presence with new distribution partnerships in Asia, increasing access to its compostable food packaging range.
- 2023: Pactiv Evergreen announced significant investments in expanding its production capacity for sustainable foodservice packaging, including compostable and recyclable options.
- 2022: Faerch AS acquired another packaging manufacturer to bolster its portfolio of sustainable food packaging solutions, particularly in plastic recycling.
- 2022: BioPak introduced innovative sugarcane bagasse containers with improved grease resistance and microwaveability features.
- 2021: Dart Container expanded its offerings of paper-based and compostable alternatives to traditional plastic cups and containers.
- 2021: Karat Packaging introduced a new range of compostable food containers made from bamboo and sugarcane fibers.
Strategic Eco Friendly Takeout Container Market Outlook
The strategic outlook for the eco friendly takeout container market remains highly positive, driven by persistent environmental concerns and evolving consumer behavior. Future growth will be fueled by continued innovation in material science, leading to more cost-effective and high-performance sustainable packaging options. The expansion of robust waste management infrastructure, including industrial composting facilities, will be crucial for unlocking the full potential of compostable packaging. Strategic opportunities lie in developing customized solutions for niche food service applications and leveraging the growing demand for aesthetically pleasing and functional eco-friendly packaging. Partnerships between packaging manufacturers, food service providers, and waste management companies will be key to driving market penetration and ensuring a circular economy for these products. The market is expected to see continued consolidation through M&A as larger players seek to strengthen their sustainable offerings and expand their global reach.
Eco Friendly Takeout Container Segmentation
-
1. Application
- 1.1. Restaurants
- 1.2. Café Shops
- 1.3. Others
-
2. Type
- 2.1. Clamshell Packaging
- 2.2. Foodbox
- 2.3. Bowl
- 2.4. Other
Eco Friendly Takeout Container Segmentation By Geography
-
1. North America
- 1.1. United States
- 1.2. Canada
- 1.3. Mexico
-
2. South America
- 2.1. Brazil
- 2.2. Argentina
- 2.3. Rest of South America
-
3. Europe
- 3.1. United Kingdom
- 3.2. Germany
- 3.3. France
- 3.4. Italy
- 3.5. Spain
- 3.6. Russia
- 3.7. Benelux
- 3.8. Nordics
- 3.9. Rest of Europe
-
4. Middle East & Africa
- 4.1. Turkey
- 4.2. Israel
- 4.3. GCC
- 4.4. North Africa
- 4.5. South Africa
- 4.6. Rest of Middle East & Africa
-
5. Asia Pacific
- 5.1. China
- 5.2. India
- 5.3. Japan
- 5.4. South Korea
- 5.5. ASEAN
- 5.6. Oceania
- 5.7. Rest of Asia Pacific
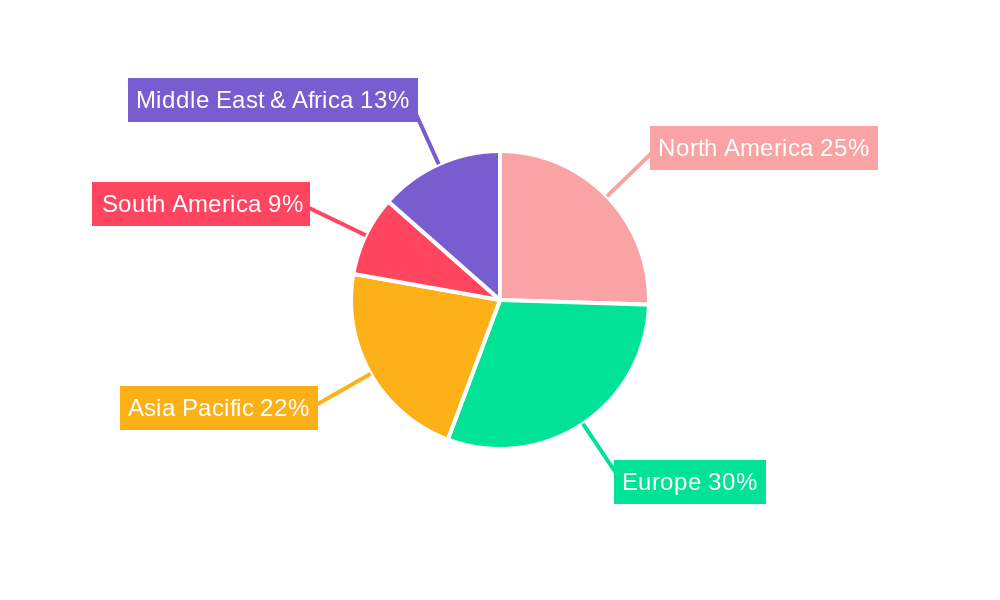
Eco Friendly Takeout Container Regional Market Share
Geographic Coverage of Eco Friendly Takeout Container
Eco Friendly Takeout Container REPORT HIGHLIGHTS
| Aspects | Details |
|---|---|
| Study Period | 2020-2034 |
| Base Year | 2025 |
| Estimated Year | 2026 |
| Forecast Period | 2026-2034 |
| Historical Period | 2020-2025 |
| Growth Rate | CAGR of 6.5% from 2020-2034 |
| Segmentation |
|
Table of Contents
- 1. Introduction
- 1.1. Research Scope
- 1.2. Market Segmentation
- 1.3. Research Methodology
- 1.4. Definitions and Assumptions
- 2. Executive Summary
- 2.1. Introduction
- 3. Market Dynamics
- 3.1. Introduction
- 3.2. Market Drivers
- 3.3. Market Restrains
- 3.4. Market Trends
- 4. Market Factor Analysis
- 4.1. Porters Five Forces
- 4.2. Supply/Value Chain
- 4.3. PESTEL analysis
- 4.4. Market Entropy
- 4.5. Patent/Trademark Analysis
- 5. Global Eco Friendly Takeout Container Analysis, Insights and Forecast, 2020-2032
- 5.1. Market Analysis, Insights and Forecast - by Application
- 5.1.1. Restaurants
- 5.1.2. Café Shops
- 5.1.3. Others
- 5.2. Market Analysis, Insights and Forecast - by Type
- 5.2.1. Clamshell Packaging
- 5.2.2. Foodbox
- 5.2.3. Bowl
- 5.2.4. Other
- 5.3. Market Analysis, Insights and Forecast - by Region
- 5.3.1. North America
- 5.3.2. South America
- 5.3.3. Europe
- 5.3.4. Middle East & Africa
- 5.3.5. Asia Pacific
- 5.1. Market Analysis, Insights and Forecast - by Application
- 6. North America Eco Friendly Takeout Container Analysis, Insights and Forecast, 2020-2032
- 6.1. Market Analysis, Insights and Forecast - by Application
- 6.1.1. Restaurants
- 6.1.2. Café Shops
- 6.1.3. Others
- 6.2. Market Analysis, Insights and Forecast - by Type
- 6.2.1. Clamshell Packaging
- 6.2.2. Foodbox
- 6.2.3. Bowl
- 6.2.4. Other
- 6.1. Market Analysis, Insights and Forecast - by Application
- 7. South America Eco Friendly Takeout Container Analysis, Insights and Forecast, 2020-2032
- 7.1. Market Analysis, Insights and Forecast - by Application
- 7.1.1. Restaurants
- 7.1.2. Café Shops
- 7.1.3. Others
- 7.2. Market Analysis, Insights and Forecast - by Type
- 7.2.1. Clamshell Packaging
- 7.2.2. Foodbox
- 7.2.3. Bowl
- 7.2.4. Other
- 7.1. Market Analysis, Insights and Forecast - by Application
- 8. Europe Eco Friendly Takeout Container Analysis, Insights and Forecast, 2020-2032
- 8.1. Market Analysis, Insights and Forecast - by Application
- 8.1.1. Restaurants
- 8.1.2. Café Shops
- 8.1.3. Others
- 8.2. Market Analysis, Insights and Forecast - by Type
- 8.2.1. Clamshell Packaging
- 8.2.2. Foodbox
- 8.2.3. Bowl
- 8.2.4. Other
- 8.1. Market Analysis, Insights and Forecast - by Application
- 9. Middle East & Africa Eco Friendly Takeout Container Analysis, Insights and Forecast, 2020-2032
- 9.1. Market Analysis, Insights and Forecast - by Application
- 9.1.1. Restaurants
- 9.1.2. Café Shops
- 9.1.3. Others
- 9.2. Market Analysis, Insights and Forecast - by Type
- 9.2.1. Clamshell Packaging
- 9.2.2. Foodbox
- 9.2.3. Bowl
- 9.2.4. Other
- 9.1. Market Analysis, Insights and Forecast - by Application
- 10. Asia Pacific Eco Friendly Takeout Container Analysis, Insights and Forecast, 2020-2032
- 10.1. Market Analysis, Insights and Forecast - by Application
- 10.1.1. Restaurants
- 10.1.2. Café Shops
- 10.1.3. Others
- 10.2. Market Analysis, Insights and Forecast - by Type
- 10.2.1. Clamshell Packaging
- 10.2.2. Foodbox
- 10.2.3. Bowl
- 10.2.4. Other
- 10.1. Market Analysis, Insights and Forecast - by Application
- 11. Competitive Analysis
- 11.1. Global Market Share Analysis 2025
- 11.2. Company Profiles
- 11.2.1 Groupe Lacroix
- 11.2.1.1. Overview
- 11.2.1.2. Products
- 11.2.1.3. SWOT Analysis
- 11.2.1.4. Recent Developments
- 11.2.1.5. Financials (Based on Availability)
- 11.2.2 Faerch AS
- 11.2.2.1. Overview
- 11.2.2.2. Products
- 11.2.2.3. SWOT Analysis
- 11.2.2.4. Recent Developments
- 11.2.2.5. Financials (Based on Availability)
- 11.2.3 Huhtamäki
- 11.2.3.1. Overview
- 11.2.3.2. Products
- 11.2.3.3. SWOT Analysis
- 11.2.3.4. Recent Developments
- 11.2.3.5. Financials (Based on Availability)
- 11.2.4 Genpak
- 11.2.4.1. Overview
- 11.2.4.2. Products
- 11.2.4.3. SWOT Analysis
- 11.2.4.4. Recent Developments
- 11.2.4.5. Financials (Based on Availability)
- 11.2.5 BioPak
- 11.2.5.1. Overview
- 11.2.5.2. Products
- 11.2.5.3. SWOT Analysis
- 11.2.5.4. Recent Developments
- 11.2.5.5. Financials (Based on Availability)
- 11.2.6 Vegware
- 11.2.6.1. Overview
- 11.2.6.2. Products
- 11.2.6.3. SWOT Analysis
- 11.2.6.4. Recent Developments
- 11.2.6.5. Financials (Based on Availability)
- 11.2.7 Van De Velde Packaging
- 11.2.7.1. Overview
- 11.2.7.2. Products
- 11.2.7.3. SWOT Analysis
- 11.2.7.4. Recent Developments
- 11.2.7.5. Financials (Based on Availability)
- 11.2.8 Sabert
- 11.2.8.1. Overview
- 11.2.8.2. Products
- 11.2.8.3. SWOT Analysis
- 11.2.8.4. Recent Developments
- 11.2.8.5. Financials (Based on Availability)
- 11.2.9 Reynolds
- 11.2.9.1. Overview
- 11.2.9.2. Products
- 11.2.9.3. SWOT Analysis
- 11.2.9.4. Recent Developments
- 11.2.9.5. Financials (Based on Availability)
- 11.2.10 Dart Container
- 11.2.10.1. Overview
- 11.2.10.2. Products
- 11.2.10.3. SWOT Analysis
- 11.2.10.4. Recent Developments
- 11.2.10.5. Financials (Based on Availability)
- 11.2.11 Graphic Packaging
- 11.2.11.1. Overview
- 11.2.11.2. Products
- 11.2.11.3. SWOT Analysis
- 11.2.11.4. Recent Developments
- 11.2.11.5. Financials (Based on Availability)
- 11.2.12 Dixie Consumer Products
- 11.2.12.1. Overview
- 11.2.12.2. Products
- 11.2.12.3. SWOT Analysis
- 11.2.12.4. Recent Developments
- 11.2.12.5. Financials (Based on Availability)
- 11.2.13 Karat Packaging
- 11.2.13.1. Overview
- 11.2.13.2. Products
- 11.2.13.3. SWOT Analysis
- 11.2.13.4. Recent Developments
- 11.2.13.5. Financials (Based on Availability)
- 11.2.14 PakPlast
- 11.2.14.1. Overview
- 11.2.14.2. Products
- 11.2.14.3. SWOT Analysis
- 11.2.14.4. Recent Developments
- 11.2.14.5. Financials (Based on Availability)
- 11.2.15 Pactiv Evergreen
- 11.2.15.1. Overview
- 11.2.15.2. Products
- 11.2.15.3. SWOT Analysis
- 11.2.15.4. Recent Developments
- 11.2.15.5. Financials (Based on Availability)
- 11.2.1 Groupe Lacroix
List of Figures
- Figure 1: Global Eco Friendly Takeout Container Revenue Breakdown (million, %) by Region 2025 & 2033
- Figure 2: Global Eco Friendly Takeout Container Volume Breakdown (K, %) by Region 2025 & 2033
- Figure 3: North America Eco Friendly Takeout Container Revenue (million), by Application 2025 & 2033
- Figure 4: North America Eco Friendly Takeout Container Volume (K), by Application 2025 & 2033
- Figure 5: North America Eco Friendly Takeout Container Revenue Share (%), by Application 2025 & 2033
- Figure 6: North America Eco Friendly Takeout Container Volume Share (%), by Application 2025 & 2033
- Figure 7: North America Eco Friendly Takeout Container Revenue (million), by Type 2025 & 2033
- Figure 8: North America Eco Friendly Takeout Container Volume (K), by Type 2025 & 2033
- Figure 9: North America Eco Friendly Takeout Container Revenue Share (%), by Type 2025 & 2033
- Figure 10: North America Eco Friendly Takeout Container Volume Share (%), by Type 2025 & 2033
- Figure 11: North America Eco Friendly Takeout Container Revenue (million), by Country 2025 & 2033
- Figure 12: North America Eco Friendly Takeout Container Volume (K), by Country 2025 & 2033
- Figure 13: North America Eco Friendly Takeout Container Revenue Share (%), by Country 2025 & 2033
- Figure 14: North America Eco Friendly Takeout Container Volume Share (%), by Country 2025 & 2033
- Figure 15: South America Eco Friendly Takeout Container Revenue (million), by Application 2025 & 2033
- Figure 16: South America Eco Friendly Takeout Container Volume (K), by Application 2025 & 2033
- Figure 17: South America Eco Friendly Takeout Container Revenue Share (%), by Application 2025 & 2033
- Figure 18: South America Eco Friendly Takeout Container Volume Share (%), by Application 2025 & 2033
- Figure 19: South America Eco Friendly Takeout Container Revenue (million), by Type 2025 & 2033
- Figure 20: South America Eco Friendly Takeout Container Volume (K), by Type 2025 & 2033
- Figure 21: South America Eco Friendly Takeout Container Revenue Share (%), by Type 2025 & 2033
- Figure 22: South America Eco Friendly Takeout Container Volume Share (%), by Type 2025 & 2033
- Figure 23: South America Eco Friendly Takeout Container Revenue (million), by Country 2025 & 2033
- Figure 24: South America Eco Friendly Takeout Container Volume (K), by Country 2025 & 2033
- Figure 25: South America Eco Friendly Takeout Container Revenue Share (%), by Country 2025 & 2033
- Figure 26: South America Eco Friendly Takeout Container Volume Share (%), by Country 2025 & 2033
- Figure 27: Europe Eco Friendly Takeout Container Revenue (million), by Application 2025 & 2033
- Figure 28: Europe Eco Friendly Takeout Container Volume (K), by Application 2025 & 2033
- Figure 29: Europe Eco Friendly Takeout Container Revenue Share (%), by Application 2025 & 2033
- Figure 30: Europe Eco Friendly Takeout Container Volume Share (%), by Application 2025 & 2033
- Figure 31: Europe Eco Friendly Takeout Container Revenue (million), by Type 2025 & 2033
- Figure 32: Europe Eco Friendly Takeout Container Volume (K), by Type 2025 & 2033
- Figure 33: Europe Eco Friendly Takeout Container Revenue Share (%), by Type 2025 & 2033
- Figure 34: Europe Eco Friendly Takeout Container Volume Share (%), by Type 2025 & 2033
- Figure 35: Europe Eco Friendly Takeout Container Revenue (million), by Country 2025 & 2033
- Figure 36: Europe Eco Friendly Takeout Container Volume (K), by Country 2025 & 2033
- Figure 37: Europe Eco Friendly Takeout Container Revenue Share (%), by Country 2025 & 2033
- Figure 38: Europe Eco Friendly Takeout Container Volume Share (%), by Country 2025 & 2033
- Figure 39: Middle East & Africa Eco Friendly Takeout Container Revenue (million), by Application 2025 & 2033
- Figure 40: Middle East & Africa Eco Friendly Takeout Container Volume (K), by Application 2025 & 2033
- Figure 41: Middle East & Africa Eco Friendly Takeout Container Revenue Share (%), by Application 2025 & 2033
- Figure 42: Middle East & Africa Eco Friendly Takeout Container Volume Share (%), by Application 2025 & 2033
- Figure 43: Middle East & Africa Eco Friendly Takeout Container Revenue (million), by Type 2025 & 2033
- Figure 44: Middle East & Africa Eco Friendly Takeout Container Volume (K), by Type 2025 & 2033
- Figure 45: Middle East & Africa Eco Friendly Takeout Container Revenue Share (%), by Type 2025 & 2033
- Figure 46: Middle East & Africa Eco Friendly Takeout Container Volume Share (%), by Type 2025 & 2033
- Figure 47: Middle East & Africa Eco Friendly Takeout Container Revenue (million), by Country 2025 & 2033
- Figure 48: Middle East & Africa Eco Friendly Takeout Container Volume (K), by Country 2025 & 2033
- Figure 49: Middle East & Africa Eco Friendly Takeout Container Revenue Share (%), by Country 2025 & 2033
- Figure 50: Middle East & Africa Eco Friendly Takeout Container Volume Share (%), by Country 2025 & 2033
- Figure 51: Asia Pacific Eco Friendly Takeout Container Revenue (million), by Application 2025 & 2033
- Figure 52: Asia Pacific Eco Friendly Takeout Container Volume (K), by Application 2025 & 2033
- Figure 53: Asia Pacific Eco Friendly Takeout Container Revenue Share (%), by Application 2025 & 2033
- Figure 54: Asia Pacific Eco Friendly Takeout Container Volume Share (%), by Application 2025 & 2033
- Figure 55: Asia Pacific Eco Friendly Takeout Container Revenue (million), by Type 2025 & 2033
- Figure 56: Asia Pacific Eco Friendly Takeout Container Volume (K), by Type 2025 & 2033
- Figure 57: Asia Pacific Eco Friendly Takeout Container Revenue Share (%), by Type 2025 & 2033
- Figure 58: Asia Pacific Eco Friendly Takeout Container Volume Share (%), by Type 2025 & 2033
- Figure 59: Asia Pacific Eco Friendly Takeout Container Revenue (million), by Country 2025 & 2033
- Figure 60: Asia Pacific Eco Friendly Takeout Container Volume (K), by Country 2025 & 2033
- Figure 61: Asia Pacific Eco Friendly Takeout Container Revenue Share (%), by Country 2025 & 2033
- Figure 62: Asia Pacific Eco Friendly Takeout Container Volume Share (%), by Country 2025 & 2033
List of Tables
- Table 1: Global Eco Friendly Takeout Container Revenue million Forecast, by Application 2020 & 2033
- Table 2: Global Eco Friendly Takeout Container Volume K Forecast, by Application 2020 & 2033
- Table 3: Global Eco Friendly Takeout Container Revenue million Forecast, by Type 2020 & 2033
- Table 4: Global Eco Friendly Takeout Container Volume K Forecast, by Type 2020 & 2033
- Table 5: Global Eco Friendly Takeout Container Revenue million Forecast, by Region 2020 & 2033
- Table 6: Global Eco Friendly Takeout Container Volume K Forecast, by Region 2020 & 2033
- Table 7: Global Eco Friendly Takeout Container Revenue million Forecast, by Application 2020 & 2033
- Table 8: Global Eco Friendly Takeout Container Volume K Forecast, by Application 2020 & 2033
- Table 9: Global Eco Friendly Takeout Container Revenue million Forecast, by Type 2020 & 2033
- Table 10: Global Eco Friendly Takeout Container Volume K Forecast, by Type 2020 & 2033
- Table 11: Global Eco Friendly Takeout Container Revenue million Forecast, by Country 2020 & 2033
- Table 12: Global Eco Friendly Takeout Container Volume K Forecast, by Country 2020 & 2033
- Table 13: United States Eco Friendly Takeout Container Revenue (million) Forecast, by Application 2020 & 2033
- Table 14: United States Eco Friendly Takeout Container Volume (K) Forecast, by Application 2020 & 2033
- Table 15: Canada Eco Friendly Takeout Container Revenue (million) Forecast, by Application 2020 & 2033
- Table 16: Canada Eco Friendly Takeout Container Volume (K) Forecast, by Application 2020 & 2033
- Table 17: Mexico Eco Friendly Takeout Container Revenue (million) Forecast, by Application 2020 & 2033
- Table 18: Mexico Eco Friendly Takeout Container Volume (K) Forecast, by Application 2020 & 2033
- Table 19: Global Eco Friendly Takeout Container Revenue million Forecast, by Application 2020 & 2033
- Table 20: Global Eco Friendly Takeout Container Volume K Forecast, by Application 2020 & 2033
- Table 21: Global Eco Friendly Takeout Container Revenue million Forecast, by Type 2020 & 2033
- Table 22: Global Eco Friendly Takeout Container Volume K Forecast, by Type 2020 & 2033
- Table 23: Global Eco Friendly Takeout Container Revenue million Forecast, by Country 2020 & 2033
- Table 24: Global Eco Friendly Takeout Container Volume K Forecast, by Country 2020 & 2033
- Table 25: Brazil Eco Friendly Takeout Container Revenue (million) Forecast, by Application 2020 & 2033
- Table 26: Brazil Eco Friendly Takeout Container Volume (K) Forecast, by Application 2020 & 2033
- Table 27: Argentina Eco Friendly Takeout Container Revenue (million) Forecast, by Application 2020 & 2033
- Table 28: Argentina Eco Friendly Takeout Container Volume (K) Forecast, by Application 2020 & 2033
- Table 29: Rest of South America Eco Friendly Takeout Container Revenue (million) Forecast, by Application 2020 & 2033
- Table 30: Rest of South America Eco Friendly Takeout Container Volume (K) Forecast, by Application 2020 & 2033
- Table 31: Global Eco Friendly Takeout Container Revenue million Forecast, by Application 2020 & 2033
- Table 32: Global Eco Friendly Takeout Container Volume K Forecast, by Application 2020 & 2033
- Table 33: Global Eco Friendly Takeout Container Revenue million Forecast, by Type 2020 & 2033
- Table 34: Global Eco Friendly Takeout Container Volume K Forecast, by Type 2020 & 2033
- Table 35: Global Eco Friendly Takeout Container Revenue million Forecast, by Country 2020 & 2033
- Table 36: Global Eco Friendly Takeout Container Volume K Forecast, by Country 2020 & 2033
- Table 37: United Kingdom Eco Friendly Takeout Container Revenue (million) Forecast, by Application 2020 & 2033
- Table 38: United Kingdom Eco Friendly Takeout Container Volume (K) Forecast, by Application 2020 & 2033
- Table 39: Germany Eco Friendly Takeout Container Revenue (million) Forecast, by Application 2020 & 2033
- Table 40: Germany Eco Friendly Takeout Container Volume (K) Forecast, by Application 2020 & 2033
- Table 41: France Eco Friendly Takeout Container Revenue (million) Forecast, by Application 2020 & 2033
- Table 42: France Eco Friendly Takeout Container Volume (K) Forecast, by Application 2020 & 2033
- Table 43: Italy Eco Friendly Takeout Container Revenue (million) Forecast, by Application 2020 & 2033
- Table 44: Italy Eco Friendly Takeout Container Volume (K) Forecast, by Application 2020 & 2033
- Table 45: Spain Eco Friendly Takeout Container Revenue (million) Forecast, by Application 2020 & 2033
- Table 46: Spain Eco Friendly Takeout Container Volume (K) Forecast, by Application 2020 & 2033
- Table 47: Russia Eco Friendly Takeout Container Revenue (million) Forecast, by Application 2020 & 2033
- Table 48: Russia Eco Friendly Takeout Container Volume (K) Forecast, by Application 2020 & 2033
- Table 49: Benelux Eco Friendly Takeout Container Revenue (million) Forecast, by Application 2020 & 2033
- Table 50: Benelux Eco Friendly Takeout Container Volume (K) Forecast, by Application 2020 & 2033
- Table 51: Nordics Eco Friendly Takeout Container Revenue (million) Forecast, by Application 2020 & 2033
- Table 52: Nordics Eco Friendly Takeout Container Volume (K) Forecast, by Application 2020 & 2033
- Table 53: Rest of Europe Eco Friendly Takeout Container Revenue (million) Forecast, by Application 2020 & 2033
- Table 54: Rest of Europe Eco Friendly Takeout Container Volume (K) Forecast, by Application 2020 & 2033
- Table 55: Global Eco Friendly Takeout Container Revenue million Forecast, by Application 2020 & 2033
- Table 56: Global Eco Friendly Takeout Container Volume K Forecast, by Application 2020 & 2033
- Table 57: Global Eco Friendly Takeout Container Revenue million Forecast, by Type 2020 & 2033
- Table 58: Global Eco Friendly Takeout Container Volume K Forecast, by Type 2020 & 2033
- Table 59: Global Eco Friendly Takeout Container Revenue million Forecast, by Country 2020 & 2033
- Table 60: Global Eco Friendly Takeout Container Volume K Forecast, by Country 2020 & 2033
- Table 61: Turkey Eco Friendly Takeout Container Revenue (million) Forecast, by Application 2020 & 2033
- Table 62: Turkey Eco Friendly Takeout Container Volume (K) Forecast, by Application 2020 & 2033
- Table 63: Israel Eco Friendly Takeout Container Revenue (million) Forecast, by Application 2020 & 2033
- Table 64: Israel Eco Friendly Takeout Container Volume (K) Forecast, by Application 2020 & 2033
- Table 65: GCC Eco Friendly Takeout Container Revenue (million) Forecast, by Application 2020 & 2033
- Table 66: GCC Eco Friendly Takeout Container Volume (K) Forecast, by Application 2020 & 2033
- Table 67: North Africa Eco Friendly Takeout Container Revenue (million) Forecast, by Application 2020 & 2033
- Table 68: North Africa Eco Friendly Takeout Container Volume (K) Forecast, by Application 2020 & 2033
- Table 69: South Africa Eco Friendly Takeout Container Revenue (million) Forecast, by Application 2020 & 2033
- Table 70: South Africa Eco Friendly Takeout Container Volume (K) Forecast, by Application 2020 & 2033
- Table 71: Rest of Middle East & Africa Eco Friendly Takeout Container Revenue (million) Forecast, by Application 2020 & 2033
- Table 72: Rest of Middle East & Africa Eco Friendly Takeout Container Volume (K) Forecast, by Application 2020 & 2033
- Table 73: Global Eco Friendly Takeout Container Revenue million Forecast, by Application 2020 & 2033
- Table 74: Global Eco Friendly Takeout Container Volume K Forecast, by Application 2020 & 2033
- Table 75: Global Eco Friendly Takeout Container Revenue million Forecast, by Type 2020 & 2033
- Table 76: Global Eco Friendly Takeout Container Volume K Forecast, by Type 2020 & 2033
- Table 77: Global Eco Friendly Takeout Container Revenue million Forecast, by Country 2020 & 2033
- Table 78: Global Eco Friendly Takeout Container Volume K Forecast, by Country 2020 & 2033
- Table 79: China Eco Friendly Takeout Container Revenue (million) Forecast, by Application 2020 & 2033
- Table 80: China Eco Friendly Takeout Container Volume (K) Forecast, by Application 2020 & 2033
- Table 81: India Eco Friendly Takeout Container Revenue (million) Forecast, by Application 2020 & 2033
- Table 82: India Eco Friendly Takeout Container Volume (K) Forecast, by Application 2020 & 2033
- Table 83: Japan Eco Friendly Takeout Container Revenue (million) Forecast, by Application 2020 & 2033
- Table 84: Japan Eco Friendly Takeout Container Volume (K) Forecast, by Application 2020 & 2033
- Table 85: South Korea Eco Friendly Takeout Container Revenue (million) Forecast, by Application 2020 & 2033
- Table 86: South Korea Eco Friendly Takeout Container Volume (K) Forecast, by Application 2020 & 2033
- Table 87: ASEAN Eco Friendly Takeout Container Revenue (million) Forecast, by Application 2020 & 2033
- Table 88: ASEAN Eco Friendly Takeout Container Volume (K) Forecast, by Application 2020 & 2033
- Table 89: Oceania Eco Friendly Takeout Container Revenue (million) Forecast, by Application 2020 & 2033
- Table 90: Oceania Eco Friendly Takeout Container Volume (K) Forecast, by Application 2020 & 2033
- Table 91: Rest of Asia Pacific Eco Friendly Takeout Container Revenue (million) Forecast, by Application 2020 & 2033
- Table 92: Rest of Asia Pacific Eco Friendly Takeout Container Volume (K) Forecast, by Application 2020 & 2033
Frequently Asked Questions
1. What is the projected Compound Annual Growth Rate (CAGR) of the Eco Friendly Takeout Container?
The projected CAGR is approximately 6.5%.
2. Which companies are prominent players in the Eco Friendly Takeout Container?
Key companies in the market include Groupe Lacroix, Faerch AS, Huhtamäki, Genpak, BioPak, Vegware, Van De Velde Packaging, Sabert, Reynolds, Dart Container, Graphic Packaging, Dixie Consumer Products, Karat Packaging, PakPlast, Pactiv Evergreen.
3. What are the main segments of the Eco Friendly Takeout Container?
The market segments include Application, Type.
4. Can you provide details about the market size?
The market size is estimated to be USD 7483 million as of 2022.
5. What are some drivers contributing to market growth?
N/A
6. What are the notable trends driving market growth?
N/A
7. Are there any restraints impacting market growth?
N/A
8. Can you provide examples of recent developments in the market?
N/A
9. What pricing options are available for accessing the report?
Pricing options include single-user, multi-user, and enterprise licenses priced at USD 3950.00, USD 5925.00, and USD 7900.00 respectively.
10. Is the market size provided in terms of value or volume?
The market size is provided in terms of value, measured in million and volume, measured in K.
11. Are there any specific market keywords associated with the report?
Yes, the market keyword associated with the report is "Eco Friendly Takeout Container," which aids in identifying and referencing the specific market segment covered.
12. How do I determine which pricing option suits my needs best?
The pricing options vary based on user requirements and access needs. Individual users may opt for single-user licenses, while businesses requiring broader access may choose multi-user or enterprise licenses for cost-effective access to the report.
13. Are there any additional resources or data provided in the Eco Friendly Takeout Container report?
While the report offers comprehensive insights, it's advisable to review the specific contents or supplementary materials provided to ascertain if additional resources or data are available.
14. How can I stay updated on further developments or reports in the Eco Friendly Takeout Container?
To stay informed about further developments, trends, and reports in the Eco Friendly Takeout Container, consider subscribing to industry newsletters, following relevant companies and organizations, or regularly checking reputable industry news sources and publications.
Methodology
Step 1 - Identification of Relevant Samples Size from Population Database


Step 2 - Approaches for Defining Global Market Size (Value, Volume* & Price*)

Note*: In applicable scenarios
Step 3 - Data Sources
Primary Research
- Web Analytics
- Survey Reports
- Research Institute
- Latest Research Reports
- Opinion Leaders
Secondary Research
- Annual Reports
- White Paper
- Latest Press Release
- Industry Association
- Paid Database
- Investor Presentations

Step 4 - Data Triangulation
Involves using different sources of information in order to increase the validity of a study
These sources are likely to be stakeholders in a program - participants, other researchers, program staff, other community members, and so on.
Then we put all data in single framework & apply various statistical tools to find out the dynamic on the market.
During the analysis stage, feedback from the stakeholder groups would be compared to determine areas of agreement as well as areas of divergence