

Key Insights
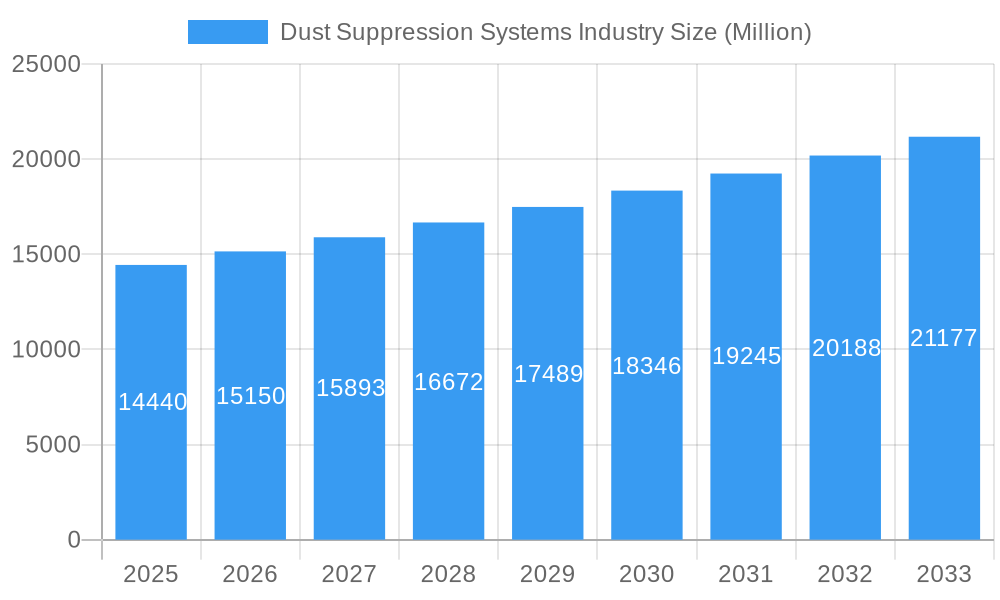
The dust suppression systems market, valued at $14.44 billion in 2025, is projected to experience robust growth, driven by increasing regulatory pressure to minimize particulate matter emissions across various industries. Stringent environmental regulations, particularly concerning occupational health and air quality, are compelling businesses in sectors like mining, construction, and manufacturing to adopt advanced dust suppression technologies. Furthermore, the rising awareness of respiratory health issues associated with dust inhalation fuels the demand for effective and efficient suppression systems. Technological advancements, such as the development of more sustainable and automated solutions, are also contributing to market expansion. Growth is anticipated across both chemical providers, offering specialized suppressants, and system providers, offering integrated solutions tailored to specific applications. The market's segmentation reflects the diversity of industrial needs, with various chemical compositions and system designs catering to unique environmental and operational conditions. Competition among key players, including established chemical manufacturers and specialized system integrators, drives innovation and fosters market competitiveness, benefiting end-users with a broader range of choices and improved cost-effectiveness.
Dust Suppression Systems Industry Market Size (In Billion)
The forecast period from 2025 to 2033 anticipates a compound annual growth rate (CAGR) of 4.73%, indicating a steady and sustained expansion. This growth trajectory is underpinned by ongoing industrialization and urbanization, which inevitably lead to increased dust generation. However, economic fluctuations and variations in raw material costs could potentially pose challenges to consistent market growth. Furthermore, the market's success will depend on continued technological innovation, focusing on energy efficiency and environmental sustainability of dust suppression methods. The market's regional distribution is expected to mirror global industrial activity, with mature economies exhibiting high adoption rates and emerging economies demonstrating significant growth potential as industrial development accelerates. Future research will likely focus on the integration of IoT and AI technologies to optimize dust suppression operations and provide real-time monitoring and control.
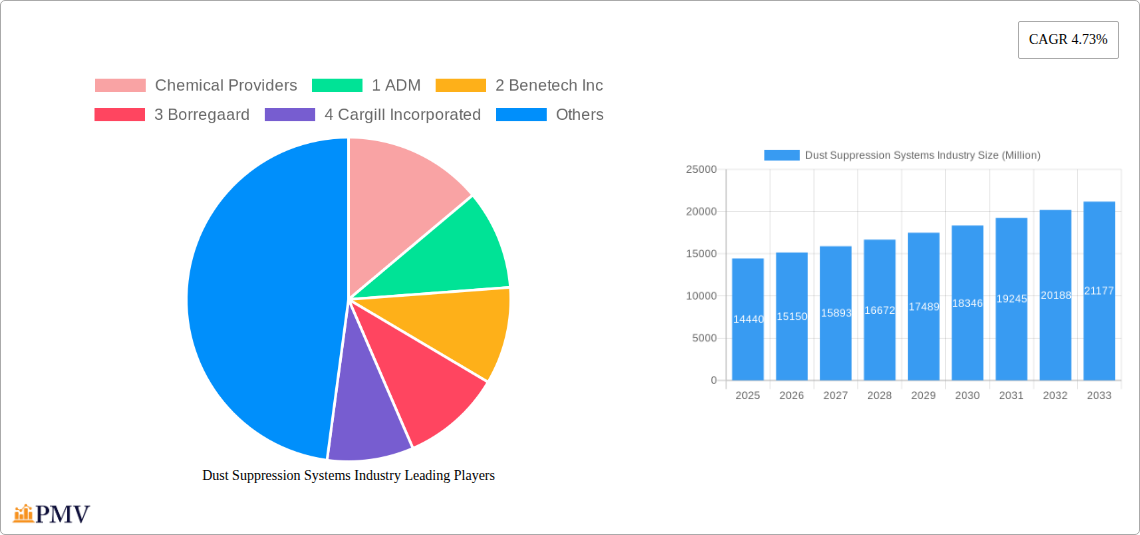
Dust Suppression Systems Industry Company Market Share
Dust Suppression Systems Industry Market Report: 2019-2033
This comprehensive report provides an in-depth analysis of the Dust Suppression Systems industry, offering valuable insights for businesses, investors, and stakeholders seeking to understand the market's current state and future trajectory. Covering the period from 2019 to 2033, with a base year of 2025 and a forecast period of 2025-2033, this report delivers critical data and analysis on market size, growth drivers, challenges, and key players. The market is projected to reach xx Million by 2033, exhibiting a CAGR of xx% during the forecast period.
Dust Suppression Systems Industry Market Structure & Competitive Dynamics
The Dust Suppression Systems market is characterized by a moderately concentrated structure, with several dominant players and a growing number of niche players. Market share is largely determined by technological innovation, brand reputation, and established customer relationships. The industry is witnessing increasing M&A activity, driven by a need for expansion and diversification. Deal values have fluctuated in recent years, with larger transactions exceeding xx Million and smaller acquisitions averaging xx Million. Key aspects driving the competitive landscape include:
- Market Concentration: The top 5 players hold approximately xx% of the market share in 2025, indicating a moderately concentrated market structure.
- Innovation Ecosystems: Significant investments in R&D are fostering innovation in dust suppression technologies, leading to the development of more efficient and environmentally friendly solutions.
- Regulatory Frameworks: Stringent environmental regulations are driving demand for advanced dust suppression systems, especially in industries with high dust emissions.
- Product Substitutes: The availability of alternative dust control methods influences the competitive landscape, though the effectiveness and cost-effectiveness of dust suppression systems often provide a competitive advantage.
- End-User Trends: Increasing awareness of health hazards associated with dust exposure is driving demand across various end-user industries.
- M&A Activities: Consolidation within the industry is expected to continue, with strategic acquisitions aiming to expand market reach and technological capabilities.
Dust Suppression Systems Industry Industry Trends & Insights
The Dust Suppression Systems industry is experiencing robust growth, fueled by several key factors. Stringent environmental regulations globally are mandating the adoption of dust control technologies across various industries. Technological advancements are leading to the development of more efficient, cost-effective, and environmentally friendly systems. Moreover, increasing awareness of the health risks associated with dust exposure is driving demand, particularly in sectors like mining, construction, and manufacturing. The market is witnessing a shift towards automated and intelligent systems, improving efficiency and reducing operational costs. Key trends include:
- A rising adoption rate of advanced dust suppression technologies, such as water misting systems and filtration devices, is a primary driver of market expansion.
- Technological advancements, including the integration of IoT sensors and AI-powered analytics, are enhancing the efficiency and effectiveness of dust suppression systems.
- Growing consumer preferences for sustainable and environmentally friendly solutions are shaping product development and market trends.
- Increased competition is driving innovation and price optimization, benefitting end-users.
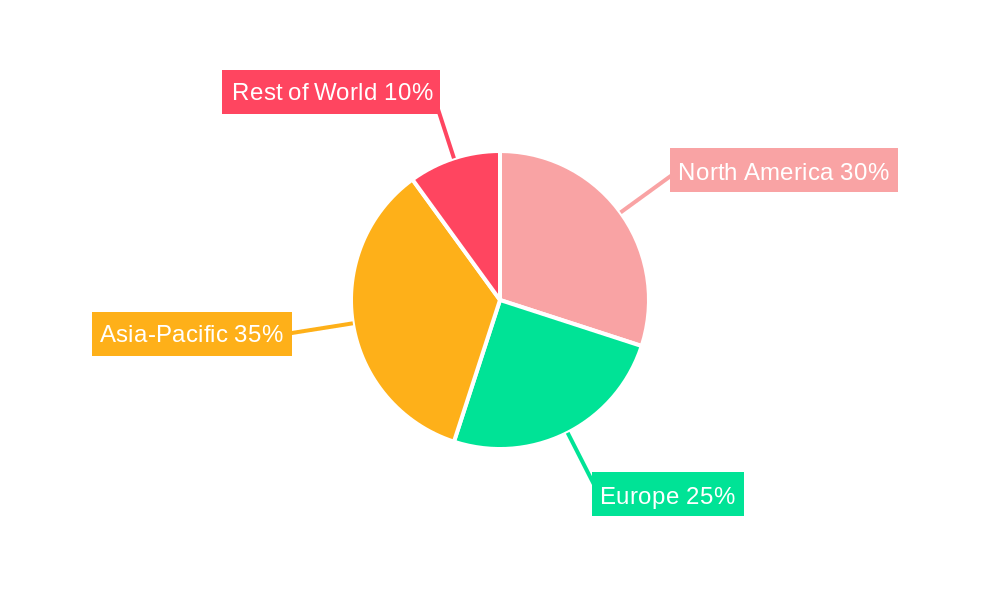
Dominant Markets & Segments in Dust Suppression Systems Industry
The North American region currently holds the largest market share in the Dust Suppression Systems industry, driven primarily by stringent environmental regulations and robust industrial activity. Within this region, the United States represents the largest national market. Key factors driving dominance include:
- Economic Policies: Government incentives and subsidies for adopting cleaner technologies are boosting demand.
- Infrastructure Development: Ongoing infrastructure projects across the region are creating significant demand for effective dust suppression solutions.
- Stringent Environmental Regulations: Stricter emission standards are compelling industries to adopt advanced dust suppression technologies.
Dust Suppression Systems Industry Product Innovations
Recent innovations include the development of more efficient water misting systems with advanced nozzle designs, improved filtration technologies with higher dust-holding capacities, and the integration of smart sensors for real-time monitoring and control. These advancements offer improved dust suppression effectiveness, reduced operational costs, and enhanced environmental compliance, leading to improved market fit and stronger competitive advantages.
Report Segmentation & Scope
This report segments the Dust Suppression Systems market based on several key factors: By Type (Water Misting Systems, Dry Dust Suppression Systems, Others), By Application (Mining, Construction, Manufacturing, Agriculture, Others), By Technology (Wet Scrubbers, Baghouses, Cyclone Separators, Electrostatic Precipitators), and By Region (North America, Europe, Asia Pacific, Middle East & Africa, South America). Each segment's growth projections, market size, and competitive dynamics are thoroughly analyzed in this report.
Key Drivers of Dust Suppression Systems Industry Growth
The growth of the Dust Suppression Systems industry is fueled by a confluence of factors, including stringent environmental regulations enforcing emission controls, the increasing demand for improved worker safety and health, technological advancements leading to enhanced efficiency and cost-effectiveness, and the expansion of industries such as mining and construction. The rising adoption of automated systems further contributes to industry growth.
Challenges in the Dust Suppression Systems Industry Sector
The Dust Suppression Systems industry faces challenges such as high initial investment costs for advanced systems, the need for skilled labor for installation and maintenance, potential supply chain disruptions impacting raw material availability, and intense competition from established and emerging players. Regulatory compliance requirements and fluctuations in raw material prices pose further challenges. These factors impact market growth and profitability, requiring strategic adaptation by industry players.
Leading Players in the Dust Suppression Systems Industry Market
- ADM
- Benetech Inc
- Borregaard
- Cargill Incorporated
- Chemtex Speciality Limited
- Evonik Industries AG
- GelTech Solutions
- Hexion
- Quaker Houghton (Quaker Chemical Corporation)
- Shaw Almex Industries Ltd
- SUEZ
- Ecolab
- BossTek
- Camfil
- CW Machine Worx
- Donaldson Company Inc
- DSH Systems Ltd
- Duztech AB
- Nederman Holding AB
- SLY Inc
- The ACT Group
Key Developments in Dust Suppression Systems Industry Sector
- March 2024: Camfil Air Pollution Control (APC) launched the Gold Series Timer (GST), an innovative dust collection controller for pulse-jet cleaning in baghouses. This enhances efficiency and simplifies operation of dust collection systems.
- February 2023: BOSSTEK introduced the DustBoss DB-45 Surge, expanding its portable dust suppression equipment line. This innovative model offers improved dust control capabilities, regardless of weather conditions.
Strategic Dust Suppression Systems Industry Market Outlook
The Dust Suppression Systems industry presents significant growth opportunities, driven by increasing environmental concerns, technological advancements, and expanding industrial activity globally. Strategic partnerships, investments in R&D, and expansion into emerging markets will be crucial for players seeking to capitalize on future market potential. Focus on sustainable and cost-effective solutions will be key to success.
Dust Suppression Systems Industry Segmentation
-
1. Chemical Type
- 1.1. Lignin Sulfonate
- 1.2. Calcium Chloride
- 1.3. Magnesium Chloride
- 1.4. Asphalt Emulsions
- 1.5. Oil Emulsions
- 1.6. Polymeric Emulsions
- 1.7. Other Chemical Types
-
2. System Type
- 2.1. Dry Collection
- 2.2. Wet Suppression
-
3. End-user Industry
- 3.1. Mining
- 3.2. Construction
- 3.3. Food and Beverage
- 3.4. Oil and Gas and Petrochemical
- 3.5. Pharmaceutical
- 3.6. Other End-user Industries
Dust Suppression Systems Industry Segmentation By Geography
-
1. Asia Pacific
- 1.1. China
- 1.2. India
- 1.3. Japan
- 1.4. South Korea
- 1.5. Malaysia
- 1.6. Thailand
- 1.7. Indonesia
- 1.8. Vietnam
- 1.9. Rest of Asia Pacific
-
2. North America
- 2.1. United States
- 2.2. Canada
- 2.3. Mexico
-
3. Europe
- 3.1. Germany
- 3.2. United Kingdom
- 3.3. Italy
- 3.4. France
- 3.5. Italy
- 3.6. Spain
- 3.7. Nordic Countries
- 3.8. Turkey
- 3.9. Russia
- 3.10. Rest of Europe
-
4. South America
- 4.1. Brazil
- 4.2. Argentina
- 4.3. Colombia
- 4.4. Rest of South America
-
5. Middle East and Africa
- 5.1. Saudi Arabia
- 5.2. Qatar
- 5.3. United Arab Emirates
- 5.4. Nigeria
- 5.5. Egypt
- 5.6. South Africa
- 5.7. Rest of Middle East and Africa
Dust Suppression Systems Industry Regional Market Share
Geographic Coverage of Dust Suppression Systems Industry
Dust Suppression Systems Industry REPORT HIGHLIGHTS
| Aspects | Details |
|---|---|
| Study Period | 2020-2034 |
| Base Year | 2025 |
| Estimated Year | 2026 |
| Forecast Period | 2026-2034 |
| Historical Period | 2020-2025 |
| Growth Rate | CAGR of 4.73% from 2020-2034 |
| Segmentation |
|
Table of Contents
- 1. Introduction
- 1.1. Research Scope
- 1.2. Market Segmentation
- 1.3. Research Objective
- 1.4. Definitions and Assumptions
- 2. Executive Summary
- 2.1. Market Snapshot
- 3. Market Dynamics
- 3.1. Market Drivers
- 3.2. Market Restrains
- 3.3. Market Trends
- 3.4. Market Opportunities
- 4. Market Factor Analysis
- 4.1. Porters Five Forces
- 4.1.1. Bargaining Power of Suppliers
- 4.1.2. Bargaining Power of Buyers
- 4.1.3. Threat of New Entrants
- 4.1.4. Threat of Substitutes
- 4.1.5. Competitive Rivalry
- 4.2. PESTEL analysis
- 4.3. BCG Analysis
- 4.3.1. Stars (High Growth, High Market Share)
- 4.3.2. Cash Cows (Low Growth, High Market Share)
- 4.3.3. Question Mark (High Growth, Low Market Share)
- 4.3.4. Dogs (Low Growth, Low Market Share)
- 4.4. Ansoff Matrix Analysis
- 4.5. Supply Chain Analysis
- 4.6. Regulatory Landscape
- 4.7. Current Market Potential and Opportunity Assessment (TAM–SAM–SOM Framework)
- 4.8. PMV Analyst Note
- 4.1. Porters Five Forces
- 5. Market Analysis, Insights and Forecast 2021-2033
- 5.1. Market Analysis, Insights and Forecast - by Chemical Type
- 5.1.1. Lignin Sulfonate
- 5.1.2. Calcium Chloride
- 5.1.3. Magnesium Chloride
- 5.1.4. Asphalt Emulsions
- 5.1.5. Oil Emulsions
- 5.1.6. Polymeric Emulsions
- 5.1.7. Other Chemical Types
- 5.2. Market Analysis, Insights and Forecast - by System Type
- 5.2.1. Dry Collection
- 5.2.2. Wet Suppression
- 5.3. Market Analysis, Insights and Forecast - by End-user Industry
- 5.3.1. Mining
- 5.3.2. Construction
- 5.3.3. Food and Beverage
- 5.3.4. Oil and Gas and Petrochemical
- 5.3.5. Pharmaceutical
- 5.3.6. Other End-user Industries
- 5.4. Market Analysis, Insights and Forecast - by Region
- 5.4.1. Asia Pacific
- 5.4.2. North America
- 5.4.3. Europe
- 5.4.4. South America
- 5.4.5. Middle East and Africa
- 5.1. Market Analysis, Insights and Forecast - by Chemical Type
- 6. Global Dust Suppression Systems Industry Analysis, Insights and Forecast, 2021-2033
- 6.1. Market Analysis, Insights and Forecast - by Chemical Type
- 6.1.1. Lignin Sulfonate
- 6.1.2. Calcium Chloride
- 6.1.3. Magnesium Chloride
- 6.1.4. Asphalt Emulsions
- 6.1.5. Oil Emulsions
- 6.1.6. Polymeric Emulsions
- 6.1.7. Other Chemical Types
- 6.2. Market Analysis, Insights and Forecast - by System Type
- 6.2.1. Dry Collection
- 6.2.2. Wet Suppression
- 6.3. Market Analysis, Insights and Forecast - by End-user Industry
- 6.3.1. Mining
- 6.3.2. Construction
- 6.3.3. Food and Beverage
- 6.3.4. Oil and Gas and Petrochemical
- 6.3.5. Pharmaceutical
- 6.3.6. Other End-user Industries
- 6.1. Market Analysis, Insights and Forecast - by Chemical Type
- 7. Asia Pacific Dust Suppression Systems Industry Analysis, Insights and Forecast, 2020-2032
- 7.1. Market Analysis, Insights and Forecast - by Chemical Type
- 7.1.1. Lignin Sulfonate
- 7.1.2. Calcium Chloride
- 7.1.3. Magnesium Chloride
- 7.1.4. Asphalt Emulsions
- 7.1.5. Oil Emulsions
- 7.1.6. Polymeric Emulsions
- 7.1.7. Other Chemical Types
- 7.2. Market Analysis, Insights and Forecast - by System Type
- 7.2.1. Dry Collection
- 7.2.2. Wet Suppression
- 7.3. Market Analysis, Insights and Forecast - by End-user Industry
- 7.3.1. Mining
- 7.3.2. Construction
- 7.3.3. Food and Beverage
- 7.3.4. Oil and Gas and Petrochemical
- 7.3.5. Pharmaceutical
- 7.3.6. Other End-user Industries
- 7.1. Market Analysis, Insights and Forecast - by Chemical Type
- 8. North America Dust Suppression Systems Industry Analysis, Insights and Forecast, 2020-2032
- 8.1. Market Analysis, Insights and Forecast - by Chemical Type
- 8.1.1. Lignin Sulfonate
- 8.1.2. Calcium Chloride
- 8.1.3. Magnesium Chloride
- 8.1.4. Asphalt Emulsions
- 8.1.5. Oil Emulsions
- 8.1.6. Polymeric Emulsions
- 8.1.7. Other Chemical Types
- 8.2. Market Analysis, Insights and Forecast - by System Type
- 8.2.1. Dry Collection
- 8.2.2. Wet Suppression
- 8.3. Market Analysis, Insights and Forecast - by End-user Industry
- 8.3.1. Mining
- 8.3.2. Construction
- 8.3.3. Food and Beverage
- 8.3.4. Oil and Gas and Petrochemical
- 8.3.5. Pharmaceutical
- 8.3.6. Other End-user Industries
- 8.1. Market Analysis, Insights and Forecast - by Chemical Type
- 9. Europe Dust Suppression Systems Industry Analysis, Insights and Forecast, 2020-2032
- 9.1. Market Analysis, Insights and Forecast - by Chemical Type
- 9.1.1. Lignin Sulfonate
- 9.1.2. Calcium Chloride
- 9.1.3. Magnesium Chloride
- 9.1.4. Asphalt Emulsions
- 9.1.5. Oil Emulsions
- 9.1.6. Polymeric Emulsions
- 9.1.7. Other Chemical Types
- 9.2. Market Analysis, Insights and Forecast - by System Type
- 9.2.1. Dry Collection
- 9.2.2. Wet Suppression
- 9.3. Market Analysis, Insights and Forecast - by End-user Industry
- 9.3.1. Mining
- 9.3.2. Construction
- 9.3.3. Food and Beverage
- 9.3.4. Oil and Gas and Petrochemical
- 9.3.5. Pharmaceutical
- 9.3.6. Other End-user Industries
- 9.1. Market Analysis, Insights and Forecast - by Chemical Type
- 10. South America Dust Suppression Systems Industry Analysis, Insights and Forecast, 2020-2032
- 10.1. Market Analysis, Insights and Forecast - by Chemical Type
- 10.1.1. Lignin Sulfonate
- 10.1.2. Calcium Chloride
- 10.1.3. Magnesium Chloride
- 10.1.4. Asphalt Emulsions
- 10.1.5. Oil Emulsions
- 10.1.6. Polymeric Emulsions
- 10.1.7. Other Chemical Types
- 10.2. Market Analysis, Insights and Forecast - by System Type
- 10.2.1. Dry Collection
- 10.2.2. Wet Suppression
- 10.3. Market Analysis, Insights and Forecast - by End-user Industry
- 10.3.1. Mining
- 10.3.2. Construction
- 10.3.3. Food and Beverage
- 10.3.4. Oil and Gas and Petrochemical
- 10.3.5. Pharmaceutical
- 10.3.6. Other End-user Industries
- 10.1. Market Analysis, Insights and Forecast - by Chemical Type
- 11. Middle East and Africa Dust Suppression Systems Industry Analysis, Insights and Forecast, 2020-2032
- 11.1. Market Analysis, Insights and Forecast - by Chemical Type
- 11.1.1. Lignin Sulfonate
- 11.1.2. Calcium Chloride
- 11.1.3. Magnesium Chloride
- 11.1.4. Asphalt Emulsions
- 11.1.5. Oil Emulsions
- 11.1.6. Polymeric Emulsions
- 11.1.7. Other Chemical Types
- 11.2. Market Analysis, Insights and Forecast - by System Type
- 11.2.1. Dry Collection
- 11.2.2. Wet Suppression
- 11.3. Market Analysis, Insights and Forecast - by End-user Industry
- 11.3.1. Mining
- 11.3.2. Construction
- 11.3.3. Food and Beverage
- 11.3.4. Oil and Gas and Petrochemical
- 11.3.5. Pharmaceutical
- 11.3.6. Other End-user Industries
- 11.1. Market Analysis, Insights and Forecast - by Chemical Type
- 12. Competitive Analysis
- 12.1. Company Profiles
- 12.1.1 Chemical Providers
- 12.1.1.1. Company Overview
- 12.1.1.2. Products
- 12.1.1.3. Company Financials
- 12.1.1.4. SWOT Analysis
- 12.1.2 1 ADM
- 12.1.2.1. Company Overview
- 12.1.2.2. Products
- 12.1.2.3. Company Financials
- 12.1.2.4. SWOT Analysis
- 12.1.3 2 Benetech Inc
- 12.1.3.1. Company Overview
- 12.1.3.2. Products
- 12.1.3.3. Company Financials
- 12.1.3.4. SWOT Analysis
- 12.1.4 3 Borregaard
- 12.1.4.1. Company Overview
- 12.1.4.2. Products
- 12.1.4.3. Company Financials
- 12.1.4.4. SWOT Analysis
- 12.1.5 4 Cargill Incorporated
- 12.1.5.1. Company Overview
- 12.1.5.2. Products
- 12.1.5.3. Company Financials
- 12.1.5.4. SWOT Analysis
- 12.1.6 5 Chemtex Speciality Limited
- 12.1.6.1. Company Overview
- 12.1.6.2. Products
- 12.1.6.3. Company Financials
- 12.1.6.4. SWOT Analysis
- 12.1.7 6 Evonik Industries AG
- 12.1.7.1. Company Overview
- 12.1.7.2. Products
- 12.1.7.3. Company Financials
- 12.1.7.4. SWOT Analysis
- 12.1.8 7 GelTech Solutions
- 12.1.8.1. Company Overview
- 12.1.8.2. Products
- 12.1.8.3. Company Financials
- 12.1.8.4. SWOT Analysis
- 12.1.9 8 Hexion
- 12.1.9.1. Company Overview
- 12.1.9.2. Products
- 12.1.9.3. Company Financials
- 12.1.9.4. SWOT Analysis
- 12.1.10 9 Quaker Houghton (Quaker Chemical Corporation)
- 12.1.10.1. Company Overview
- 12.1.10.2. Products
- 12.1.10.3. Company Financials
- 12.1.10.4. SWOT Analysis
- 12.1.11 10 Shaw Almex Industries Ltd
- 12.1.11.1. Company Overview
- 12.1.11.2. Products
- 12.1.11.3. Company Financials
- 12.1.11.4. SWOT Analysis
- 12.1.12 11 SUEZ
- 12.1.12.1. Company Overview
- 12.1.12.2. Products
- 12.1.12.3. Company Financials
- 12.1.12.4. SWOT Analysis
- 12.1.13 12 Ecolab
- 12.1.13.1. Company Overview
- 12.1.13.2. Products
- 12.1.13.3. Company Financials
- 12.1.13.4. SWOT Analysis
- 12.1.14 System Providers
- 12.1.14.1. Company Overview
- 12.1.14.2. Products
- 12.1.14.3. Company Financials
- 12.1.14.4. SWOT Analysis
- 12.1.15 1 BossTek
- 12.1.15.1. Company Overview
- 12.1.15.2. Products
- 12.1.15.3. Company Financials
- 12.1.15.4. SWOT Analysis
- 12.1.16 2 Camfil
- 12.1.16.1. Company Overview
- 12.1.16.2. Products
- 12.1.16.3. Company Financials
- 12.1.16.4. SWOT Analysis
- 12.1.17 3 CW Machine Worx
- 12.1.17.1. Company Overview
- 12.1.17.2. Products
- 12.1.17.3. Company Financials
- 12.1.17.4. SWOT Analysis
- 12.1.18 4 Donaldson Company Inc
- 12.1.18.1. Company Overview
- 12.1.18.2. Products
- 12.1.18.3. Company Financials
- 12.1.18.4. SWOT Analysis
- 12.1.19 5 DSH Systems Ltd
- 12.1.19.1. Company Overview
- 12.1.19.2. Products
- 12.1.19.3. Company Financials
- 12.1.19.4. SWOT Analysis
- 12.1.20 6 Duztech AB
- 12.1.20.1. Company Overview
- 12.1.20.2. Products
- 12.1.20.3. Company Financials
- 12.1.20.4. SWOT Analysis
- 12.1.21 7 Nederman Holding AB
- 12.1.21.1. Company Overview
- 12.1.21.2. Products
- 12.1.21.3. Company Financials
- 12.1.21.4. SWOT Analysis
- 12.1.22 8 SLY Inc
- 12.1.22.1. Company Overview
- 12.1.22.2. Products
- 12.1.22.3. Company Financials
- 12.1.22.4. SWOT Analysis
- 12.1.23 9 The ACT Group*List Not Exhaustive
- 12.1.23.1. Company Overview
- 12.1.23.2. Products
- 12.1.23.3. Company Financials
- 12.1.23.4. SWOT Analysis
- 12.1.1 Chemical Providers
- 12.2. Market Entropy
- 12.2.1 Company's Key Areas Served
- 12.2.2 Recent Developments
- 12.3. Company Market Share Analysis 2025
- 12.3.1 Top 5 Companies Market Share Analysis
- 12.3.2 Top 3 Companies Market Share Analysis
- 12.4. List of Potential Customers
- 13. Research Methodology
List of Figures
- Figure 1: Global Dust Suppression Systems Industry Revenue Breakdown (Million, %) by Region 2025 & 2033
- Figure 2: Global Dust Suppression Systems Industry Volume Breakdown (Billion, %) by Region 2025 & 2033
- Figure 3: Asia Pacific Dust Suppression Systems Industry Revenue (Million), by Chemical Type 2025 & 2033
- Figure 4: Asia Pacific Dust Suppression Systems Industry Volume (Billion), by Chemical Type 2025 & 2033
- Figure 5: Asia Pacific Dust Suppression Systems Industry Revenue Share (%), by Chemical Type 2025 & 2033
- Figure 6: Asia Pacific Dust Suppression Systems Industry Volume Share (%), by Chemical Type 2025 & 2033
- Figure 7: Asia Pacific Dust Suppression Systems Industry Revenue (Million), by System Type 2025 & 2033
- Figure 8: Asia Pacific Dust Suppression Systems Industry Volume (Billion), by System Type 2025 & 2033
- Figure 9: Asia Pacific Dust Suppression Systems Industry Revenue Share (%), by System Type 2025 & 2033
- Figure 10: Asia Pacific Dust Suppression Systems Industry Volume Share (%), by System Type 2025 & 2033
- Figure 11: Asia Pacific Dust Suppression Systems Industry Revenue (Million), by End-user Industry 2025 & 2033
- Figure 12: Asia Pacific Dust Suppression Systems Industry Volume (Billion), by End-user Industry 2025 & 2033
- Figure 13: Asia Pacific Dust Suppression Systems Industry Revenue Share (%), by End-user Industry 2025 & 2033
- Figure 14: Asia Pacific Dust Suppression Systems Industry Volume Share (%), by End-user Industry 2025 & 2033
- Figure 15: Asia Pacific Dust Suppression Systems Industry Revenue (Million), by Country 2025 & 2033
- Figure 16: Asia Pacific Dust Suppression Systems Industry Volume (Billion), by Country 2025 & 2033
- Figure 17: Asia Pacific Dust Suppression Systems Industry Revenue Share (%), by Country 2025 & 2033
- Figure 18: Asia Pacific Dust Suppression Systems Industry Volume Share (%), by Country 2025 & 2033
- Figure 19: North America Dust Suppression Systems Industry Revenue (Million), by Chemical Type 2025 & 2033
- Figure 20: North America Dust Suppression Systems Industry Volume (Billion), by Chemical Type 2025 & 2033
- Figure 21: North America Dust Suppression Systems Industry Revenue Share (%), by Chemical Type 2025 & 2033
- Figure 22: North America Dust Suppression Systems Industry Volume Share (%), by Chemical Type 2025 & 2033
- Figure 23: North America Dust Suppression Systems Industry Revenue (Million), by System Type 2025 & 2033
- Figure 24: North America Dust Suppression Systems Industry Volume (Billion), by System Type 2025 & 2033
- Figure 25: North America Dust Suppression Systems Industry Revenue Share (%), by System Type 2025 & 2033
- Figure 26: North America Dust Suppression Systems Industry Volume Share (%), by System Type 2025 & 2033
- Figure 27: North America Dust Suppression Systems Industry Revenue (Million), by End-user Industry 2025 & 2033
- Figure 28: North America Dust Suppression Systems Industry Volume (Billion), by End-user Industry 2025 & 2033
- Figure 29: North America Dust Suppression Systems Industry Revenue Share (%), by End-user Industry 2025 & 2033
- Figure 30: North America Dust Suppression Systems Industry Volume Share (%), by End-user Industry 2025 & 2033
- Figure 31: North America Dust Suppression Systems Industry Revenue (Million), by Country 2025 & 2033
- Figure 32: North America Dust Suppression Systems Industry Volume (Billion), by Country 2025 & 2033
- Figure 33: North America Dust Suppression Systems Industry Revenue Share (%), by Country 2025 & 2033
- Figure 34: North America Dust Suppression Systems Industry Volume Share (%), by Country 2025 & 2033
- Figure 35: Europe Dust Suppression Systems Industry Revenue (Million), by Chemical Type 2025 & 2033
- Figure 36: Europe Dust Suppression Systems Industry Volume (Billion), by Chemical Type 2025 & 2033
- Figure 37: Europe Dust Suppression Systems Industry Revenue Share (%), by Chemical Type 2025 & 2033
- Figure 38: Europe Dust Suppression Systems Industry Volume Share (%), by Chemical Type 2025 & 2033
- Figure 39: Europe Dust Suppression Systems Industry Revenue (Million), by System Type 2025 & 2033
- Figure 40: Europe Dust Suppression Systems Industry Volume (Billion), by System Type 2025 & 2033
- Figure 41: Europe Dust Suppression Systems Industry Revenue Share (%), by System Type 2025 & 2033
- Figure 42: Europe Dust Suppression Systems Industry Volume Share (%), by System Type 2025 & 2033
- Figure 43: Europe Dust Suppression Systems Industry Revenue (Million), by End-user Industry 2025 & 2033
- Figure 44: Europe Dust Suppression Systems Industry Volume (Billion), by End-user Industry 2025 & 2033
- Figure 45: Europe Dust Suppression Systems Industry Revenue Share (%), by End-user Industry 2025 & 2033
- Figure 46: Europe Dust Suppression Systems Industry Volume Share (%), by End-user Industry 2025 & 2033
- Figure 47: Europe Dust Suppression Systems Industry Revenue (Million), by Country 2025 & 2033
- Figure 48: Europe Dust Suppression Systems Industry Volume (Billion), by Country 2025 & 2033
- Figure 49: Europe Dust Suppression Systems Industry Revenue Share (%), by Country 2025 & 2033
- Figure 50: Europe Dust Suppression Systems Industry Volume Share (%), by Country 2025 & 2033
- Figure 51: South America Dust Suppression Systems Industry Revenue (Million), by Chemical Type 2025 & 2033
- Figure 52: South America Dust Suppression Systems Industry Volume (Billion), by Chemical Type 2025 & 2033
- Figure 53: South America Dust Suppression Systems Industry Revenue Share (%), by Chemical Type 2025 & 2033
- Figure 54: South America Dust Suppression Systems Industry Volume Share (%), by Chemical Type 2025 & 2033
- Figure 55: South America Dust Suppression Systems Industry Revenue (Million), by System Type 2025 & 2033
- Figure 56: South America Dust Suppression Systems Industry Volume (Billion), by System Type 2025 & 2033
- Figure 57: South America Dust Suppression Systems Industry Revenue Share (%), by System Type 2025 & 2033
- Figure 58: South America Dust Suppression Systems Industry Volume Share (%), by System Type 2025 & 2033
- Figure 59: South America Dust Suppression Systems Industry Revenue (Million), by End-user Industry 2025 & 2033
- Figure 60: South America Dust Suppression Systems Industry Volume (Billion), by End-user Industry 2025 & 2033
- Figure 61: South America Dust Suppression Systems Industry Revenue Share (%), by End-user Industry 2025 & 2033
- Figure 62: South America Dust Suppression Systems Industry Volume Share (%), by End-user Industry 2025 & 2033
- Figure 63: South America Dust Suppression Systems Industry Revenue (Million), by Country 2025 & 2033
- Figure 64: South America Dust Suppression Systems Industry Volume (Billion), by Country 2025 & 2033
- Figure 65: South America Dust Suppression Systems Industry Revenue Share (%), by Country 2025 & 2033
- Figure 66: South America Dust Suppression Systems Industry Volume Share (%), by Country 2025 & 2033
- Figure 67: Middle East and Africa Dust Suppression Systems Industry Revenue (Million), by Chemical Type 2025 & 2033
- Figure 68: Middle East and Africa Dust Suppression Systems Industry Volume (Billion), by Chemical Type 2025 & 2033
- Figure 69: Middle East and Africa Dust Suppression Systems Industry Revenue Share (%), by Chemical Type 2025 & 2033
- Figure 70: Middle East and Africa Dust Suppression Systems Industry Volume Share (%), by Chemical Type 2025 & 2033
- Figure 71: Middle East and Africa Dust Suppression Systems Industry Revenue (Million), by System Type 2025 & 2033
- Figure 72: Middle East and Africa Dust Suppression Systems Industry Volume (Billion), by System Type 2025 & 2033
- Figure 73: Middle East and Africa Dust Suppression Systems Industry Revenue Share (%), by System Type 2025 & 2033
- Figure 74: Middle East and Africa Dust Suppression Systems Industry Volume Share (%), by System Type 2025 & 2033
- Figure 75: Middle East and Africa Dust Suppression Systems Industry Revenue (Million), by End-user Industry 2025 & 2033
- Figure 76: Middle East and Africa Dust Suppression Systems Industry Volume (Billion), by End-user Industry 2025 & 2033
- Figure 77: Middle East and Africa Dust Suppression Systems Industry Revenue Share (%), by End-user Industry 2025 & 2033
- Figure 78: Middle East and Africa Dust Suppression Systems Industry Volume Share (%), by End-user Industry 2025 & 2033
- Figure 79: Middle East and Africa Dust Suppression Systems Industry Revenue (Million), by Country 2025 & 2033
- Figure 80: Middle East and Africa Dust Suppression Systems Industry Volume (Billion), by Country 2025 & 2033
- Figure 81: Middle East and Africa Dust Suppression Systems Industry Revenue Share (%), by Country 2025 & 2033
- Figure 82: Middle East and Africa Dust Suppression Systems Industry Volume Share (%), by Country 2025 & 2033
List of Tables
- Table 1: Global Dust Suppression Systems Industry Revenue Million Forecast, by Chemical Type 2020 & 2033
- Table 2: Global Dust Suppression Systems Industry Volume Billion Forecast, by Chemical Type 2020 & 2033
- Table 3: Global Dust Suppression Systems Industry Revenue Million Forecast, by System Type 2020 & 2033
- Table 4: Global Dust Suppression Systems Industry Volume Billion Forecast, by System Type 2020 & 2033
- Table 5: Global Dust Suppression Systems Industry Revenue Million Forecast, by End-user Industry 2020 & 2033
- Table 6: Global Dust Suppression Systems Industry Volume Billion Forecast, by End-user Industry 2020 & 2033
- Table 7: Global Dust Suppression Systems Industry Revenue Million Forecast, by Region 2020 & 2033
- Table 8: Global Dust Suppression Systems Industry Volume Billion Forecast, by Region 2020 & 2033
- Table 9: Global Dust Suppression Systems Industry Revenue Million Forecast, by Chemical Type 2020 & 2033
- Table 10: Global Dust Suppression Systems Industry Volume Billion Forecast, by Chemical Type 2020 & 2033
- Table 11: Global Dust Suppression Systems Industry Revenue Million Forecast, by System Type 2020 & 2033
- Table 12: Global Dust Suppression Systems Industry Volume Billion Forecast, by System Type 2020 & 2033
- Table 13: Global Dust Suppression Systems Industry Revenue Million Forecast, by End-user Industry 2020 & 2033
- Table 14: Global Dust Suppression Systems Industry Volume Billion Forecast, by End-user Industry 2020 & 2033
- Table 15: Global Dust Suppression Systems Industry Revenue Million Forecast, by Country 2020 & 2033
- Table 16: Global Dust Suppression Systems Industry Volume Billion Forecast, by Country 2020 & 2033
- Table 17: China Dust Suppression Systems Industry Revenue (Million) Forecast, by Application 2020 & 2033
- Table 18: China Dust Suppression Systems Industry Volume (Billion) Forecast, by Application 2020 & 2033
- Table 19: India Dust Suppression Systems Industry Revenue (Million) Forecast, by Application 2020 & 2033
- Table 20: India Dust Suppression Systems Industry Volume (Billion) Forecast, by Application 2020 & 2033
- Table 21: Japan Dust Suppression Systems Industry Revenue (Million) Forecast, by Application 2020 & 2033
- Table 22: Japan Dust Suppression Systems Industry Volume (Billion) Forecast, by Application 2020 & 2033
- Table 23: South Korea Dust Suppression Systems Industry Revenue (Million) Forecast, by Application 2020 & 2033
- Table 24: South Korea Dust Suppression Systems Industry Volume (Billion) Forecast, by Application 2020 & 2033
- Table 25: Malaysia Dust Suppression Systems Industry Revenue (Million) Forecast, by Application 2020 & 2033
- Table 26: Malaysia Dust Suppression Systems Industry Volume (Billion) Forecast, by Application 2020 & 2033
- Table 27: Thailand Dust Suppression Systems Industry Revenue (Million) Forecast, by Application 2020 & 2033
- Table 28: Thailand Dust Suppression Systems Industry Volume (Billion) Forecast, by Application 2020 & 2033
- Table 29: Indonesia Dust Suppression Systems Industry Revenue (Million) Forecast, by Application 2020 & 2033
- Table 30: Indonesia Dust Suppression Systems Industry Volume (Billion) Forecast, by Application 2020 & 2033
- Table 31: Vietnam Dust Suppression Systems Industry Revenue (Million) Forecast, by Application 2020 & 2033
- Table 32: Vietnam Dust Suppression Systems Industry Volume (Billion) Forecast, by Application 2020 & 2033
- Table 33: Rest of Asia Pacific Dust Suppression Systems Industry Revenue (Million) Forecast, by Application 2020 & 2033
- Table 34: Rest of Asia Pacific Dust Suppression Systems Industry Volume (Billion) Forecast, by Application 2020 & 2033
- Table 35: Global Dust Suppression Systems Industry Revenue Million Forecast, by Chemical Type 2020 & 2033
- Table 36: Global Dust Suppression Systems Industry Volume Billion Forecast, by Chemical Type 2020 & 2033
- Table 37: Global Dust Suppression Systems Industry Revenue Million Forecast, by System Type 2020 & 2033
- Table 38: Global Dust Suppression Systems Industry Volume Billion Forecast, by System Type 2020 & 2033
- Table 39: Global Dust Suppression Systems Industry Revenue Million Forecast, by End-user Industry 2020 & 2033
- Table 40: Global Dust Suppression Systems Industry Volume Billion Forecast, by End-user Industry 2020 & 2033
- Table 41: Global Dust Suppression Systems Industry Revenue Million Forecast, by Country 2020 & 2033
- Table 42: Global Dust Suppression Systems Industry Volume Billion Forecast, by Country 2020 & 2033
- Table 43: United States Dust Suppression Systems Industry Revenue (Million) Forecast, by Application 2020 & 2033
- Table 44: United States Dust Suppression Systems Industry Volume (Billion) Forecast, by Application 2020 & 2033
- Table 45: Canada Dust Suppression Systems Industry Revenue (Million) Forecast, by Application 2020 & 2033
- Table 46: Canada Dust Suppression Systems Industry Volume (Billion) Forecast, by Application 2020 & 2033
- Table 47: Mexico Dust Suppression Systems Industry Revenue (Million) Forecast, by Application 2020 & 2033
- Table 48: Mexico Dust Suppression Systems Industry Volume (Billion) Forecast, by Application 2020 & 2033
- Table 49: Global Dust Suppression Systems Industry Revenue Million Forecast, by Chemical Type 2020 & 2033
- Table 50: Global Dust Suppression Systems Industry Volume Billion Forecast, by Chemical Type 2020 & 2033
- Table 51: Global Dust Suppression Systems Industry Revenue Million Forecast, by System Type 2020 & 2033
- Table 52: Global Dust Suppression Systems Industry Volume Billion Forecast, by System Type 2020 & 2033
- Table 53: Global Dust Suppression Systems Industry Revenue Million Forecast, by End-user Industry 2020 & 2033
- Table 54: Global Dust Suppression Systems Industry Volume Billion Forecast, by End-user Industry 2020 & 2033
- Table 55: Global Dust Suppression Systems Industry Revenue Million Forecast, by Country 2020 & 2033
- Table 56: Global Dust Suppression Systems Industry Volume Billion Forecast, by Country 2020 & 2033
- Table 57: Germany Dust Suppression Systems Industry Revenue (Million) Forecast, by Application 2020 & 2033
- Table 58: Germany Dust Suppression Systems Industry Volume (Billion) Forecast, by Application 2020 & 2033
- Table 59: United Kingdom Dust Suppression Systems Industry Revenue (Million) Forecast, by Application 2020 & 2033
- Table 60: United Kingdom Dust Suppression Systems Industry Volume (Billion) Forecast, by Application 2020 & 2033
- Table 61: Italy Dust Suppression Systems Industry Revenue (Million) Forecast, by Application 2020 & 2033
- Table 62: Italy Dust Suppression Systems Industry Volume (Billion) Forecast, by Application 2020 & 2033
- Table 63: France Dust Suppression Systems Industry Revenue (Million) Forecast, by Application 2020 & 2033
- Table 64: France Dust Suppression Systems Industry Volume (Billion) Forecast, by Application 2020 & 2033
- Table 65: Italy Dust Suppression Systems Industry Revenue (Million) Forecast, by Application 2020 & 2033
- Table 66: Italy Dust Suppression Systems Industry Volume (Billion) Forecast, by Application 2020 & 2033
- Table 67: Spain Dust Suppression Systems Industry Revenue (Million) Forecast, by Application 2020 & 2033
- Table 68: Spain Dust Suppression Systems Industry Volume (Billion) Forecast, by Application 2020 & 2033
- Table 69: Nordic Countries Dust Suppression Systems Industry Revenue (Million) Forecast, by Application 2020 & 2033
- Table 70: Nordic Countries Dust Suppression Systems Industry Volume (Billion) Forecast, by Application 2020 & 2033
- Table 71: Turkey Dust Suppression Systems Industry Revenue (Million) Forecast, by Application 2020 & 2033
- Table 72: Turkey Dust Suppression Systems Industry Volume (Billion) Forecast, by Application 2020 & 2033
- Table 73: Russia Dust Suppression Systems Industry Revenue (Million) Forecast, by Application 2020 & 2033
- Table 74: Russia Dust Suppression Systems Industry Volume (Billion) Forecast, by Application 2020 & 2033
- Table 75: Rest of Europe Dust Suppression Systems Industry Revenue (Million) Forecast, by Application 2020 & 2033
- Table 76: Rest of Europe Dust Suppression Systems Industry Volume (Billion) Forecast, by Application 2020 & 2033
- Table 77: Global Dust Suppression Systems Industry Revenue Million Forecast, by Chemical Type 2020 & 2033
- Table 78: Global Dust Suppression Systems Industry Volume Billion Forecast, by Chemical Type 2020 & 2033
- Table 79: Global Dust Suppression Systems Industry Revenue Million Forecast, by System Type 2020 & 2033
- Table 80: Global Dust Suppression Systems Industry Volume Billion Forecast, by System Type 2020 & 2033
- Table 81: Global Dust Suppression Systems Industry Revenue Million Forecast, by End-user Industry 2020 & 2033
- Table 82: Global Dust Suppression Systems Industry Volume Billion Forecast, by End-user Industry 2020 & 2033
- Table 83: Global Dust Suppression Systems Industry Revenue Million Forecast, by Country 2020 & 2033
- Table 84: Global Dust Suppression Systems Industry Volume Billion Forecast, by Country 2020 & 2033
- Table 85: Brazil Dust Suppression Systems Industry Revenue (Million) Forecast, by Application 2020 & 2033
- Table 86: Brazil Dust Suppression Systems Industry Volume (Billion) Forecast, by Application 2020 & 2033
- Table 87: Argentina Dust Suppression Systems Industry Revenue (Million) Forecast, by Application 2020 & 2033
- Table 88: Argentina Dust Suppression Systems Industry Volume (Billion) Forecast, by Application 2020 & 2033
- Table 89: Colombia Dust Suppression Systems Industry Revenue (Million) Forecast, by Application 2020 & 2033
- Table 90: Colombia Dust Suppression Systems Industry Volume (Billion) Forecast, by Application 2020 & 2033
- Table 91: Rest of South America Dust Suppression Systems Industry Revenue (Million) Forecast, by Application 2020 & 2033
- Table 92: Rest of South America Dust Suppression Systems Industry Volume (Billion) Forecast, by Application 2020 & 2033
- Table 93: Global Dust Suppression Systems Industry Revenue Million Forecast, by Chemical Type 2020 & 2033
- Table 94: Global Dust Suppression Systems Industry Volume Billion Forecast, by Chemical Type 2020 & 2033
- Table 95: Global Dust Suppression Systems Industry Revenue Million Forecast, by System Type 2020 & 2033
- Table 96: Global Dust Suppression Systems Industry Volume Billion Forecast, by System Type 2020 & 2033
- Table 97: Global Dust Suppression Systems Industry Revenue Million Forecast, by End-user Industry 2020 & 2033
- Table 98: Global Dust Suppression Systems Industry Volume Billion Forecast, by End-user Industry 2020 & 2033
- Table 99: Global Dust Suppression Systems Industry Revenue Million Forecast, by Country 2020 & 2033
- Table 100: Global Dust Suppression Systems Industry Volume Billion Forecast, by Country 2020 & 2033
- Table 101: Saudi Arabia Dust Suppression Systems Industry Revenue (Million) Forecast, by Application 2020 & 2033
- Table 102: Saudi Arabia Dust Suppression Systems Industry Volume (Billion) Forecast, by Application 2020 & 2033
- Table 103: Qatar Dust Suppression Systems Industry Revenue (Million) Forecast, by Application 2020 & 2033
- Table 104: Qatar Dust Suppression Systems Industry Volume (Billion) Forecast, by Application 2020 & 2033
- Table 105: United Arab Emirates Dust Suppression Systems Industry Revenue (Million) Forecast, by Application 2020 & 2033
- Table 106: United Arab Emirates Dust Suppression Systems Industry Volume (Billion) Forecast, by Application 2020 & 2033
- Table 107: Nigeria Dust Suppression Systems Industry Revenue (Million) Forecast, by Application 2020 & 2033
- Table 108: Nigeria Dust Suppression Systems Industry Volume (Billion) Forecast, by Application 2020 & 2033
- Table 109: Egypt Dust Suppression Systems Industry Revenue (Million) Forecast, by Application 2020 & 2033
- Table 110: Egypt Dust Suppression Systems Industry Volume (Billion) Forecast, by Application 2020 & 2033
- Table 111: South Africa Dust Suppression Systems Industry Revenue (Million) Forecast, by Application 2020 & 2033
- Table 112: South Africa Dust Suppression Systems Industry Volume (Billion) Forecast, by Application 2020 & 2033
- Table 113: Rest of Middle East and Africa Dust Suppression Systems Industry Revenue (Million) Forecast, by Application 2020 & 2033
- Table 114: Rest of Middle East and Africa Dust Suppression Systems Industry Volume (Billion) Forecast, by Application 2020 & 2033
Frequently Asked Questions
1. What is the projected Compound Annual Growth Rate (CAGR) of the Dust Suppression Systems Industry?
The projected CAGR is approximately 4.73%.
2. Which companies are prominent players in the Dust Suppression Systems Industry?
Key companies in the market include Chemical Providers, 1 ADM, 2 Benetech Inc, 3 Borregaard, 4 Cargill Incorporated, 5 Chemtex Speciality Limited, 6 Evonik Industries AG, 7 GelTech Solutions, 8 Hexion, 9 Quaker Houghton (Quaker Chemical Corporation), 10 Shaw Almex Industries Ltd, 11 SUEZ, 12 Ecolab, System Providers, 1 BossTek, 2 Camfil, 3 CW Machine Worx, 4 Donaldson Company Inc, 5 DSH Systems Ltd, 6 Duztech AB, 7 Nederman Holding AB, 8 SLY Inc, 9 The ACT Group*List Not Exhaustive.
3. What are the main segments of the Dust Suppression Systems Industry?
The market segments include Chemical Type, System Type, End-user Industry.
4. Can you provide details about the market size?
The market size is estimated to be USD 14.44 Million as of 2022.
5. What are some drivers contributing to market growth?
Growth in Construction and Infrastructure in Asia-Pacific; Increase in Regulatory Compliances; Other Drivers.
6. What are the notable trends driving market growth?
Construction Industry to Dominate the Market.
7. Are there any restraints impacting market growth?
Growth in Construction and Infrastructure in Asia-Pacific; Increase in Regulatory Compliances; Other Drivers.
8. Can you provide examples of recent developments in the market?
March 2024: Camfil Air Pollution Control (APC) has unveiled its newest offering, the Gold Series Timer (GST), an innovative-edge dust collection controller. The GST serves as a straightforward yet powerful tool for managing pulse-jet cleaning in various industrial dust collection systems, such as baghouses. With its state-of-the-art design, the GST provides an intuitive and easily implementable solution for pulse-jet cleaning in industrial dust collection systems.February 2023: BOSSTEK, renowned for its portable dust-suppression equipment, has unveiled the DustBoss DB-45 Surge, the newest addition to its acclaimed Surge line. This innovative-edge technology features an innovative pressurized center nozzle, complemented by the OEM's trusted fan and misting ring system, empowering users to effectively manage dust, regardless of weather conditions.
9. What pricing options are available for accessing the report?
Pricing options include single-user, multi-user, and enterprise licenses priced at USD 4750, USD 5250, and USD 8750 respectively.
10. Is the market size provided in terms of value or volume?
The market size is provided in terms of value, measured in Million and volume, measured in Billion.
11. Are there any specific market keywords associated with the report?
Yes, the market keyword associated with the report is "Dust Suppression Systems Industry," which aids in identifying and referencing the specific market segment covered.
12. How do I determine which pricing option suits my needs best?
The pricing options vary based on user requirements and access needs. Individual users may opt for single-user licenses, while businesses requiring broader access may choose multi-user or enterprise licenses for cost-effective access to the report.
13. Are there any additional resources or data provided in the Dust Suppression Systems Industry report?
While the report offers comprehensive insights, it's advisable to review the specific contents or supplementary materials provided to ascertain if additional resources or data are available.
14. How can I stay updated on further developments or reports in the Dust Suppression Systems Industry?
To stay informed about further developments, trends, and reports in the Dust Suppression Systems Industry, consider subscribing to industry newsletters, following relevant companies and organizations, or regularly checking reputable industry news sources and publications.
Methodology
Step 1 - Identification of Relevant Samples Size from Population Database


Step 2 - Approaches for Defining Global Market Size (Value, Volume* & Price*)

Note*: In applicable scenarios
Step 3 - Data Sources
Primary Research
- Web Analytics
- Survey Reports
- Research Institute
- Latest Research Reports
- Opinion Leaders
Secondary Research
- Annual Reports
- White Paper
- Latest Press Release
- Industry Association
- Paid Database
- Investor Presentations

Step 4 - Data Triangulation
Involves using different sources of information in order to increase the validity of a study
These sources are likely to be stakeholders in a program - participants, other researchers, program staff, other community members, and so on.
Then we put all data in single framework & apply various statistical tools to find out the dynamic on the market.
During the analysis stage, feedback from the stakeholder groups would be compared to determine areas of agreement as well as areas of divergence