Dry Chilies Industry Insights: Growth at XX CAGR Through 2033

Dry Chilies Industry by Production Analysis, by Consumption Analysis, by Import Market Analysis (Value & Volume), by Export Market Analysis (Value & Volume), by Price Trend Analysis, by North America (United States, Canada, Mexico), by Europe (United Kingdom, Germany, France, Spain), by Asia Pacific (China, Australia, India), by South America (Brazil, Argentina), by Africa (South Africa, Egypt) Forecast 2025-2033

Jul 2 2025
Base Year: 2024

234 Pages
Main Logo

Dry Chilies Industry Insights: Growth at XX CAGR Through 2033


Home
Industries
Agriculture
sponsor image

Tailored for you

  • In-depth Analysis Tailored to Specified Regions or Segments
  • Company Profiles Customized to User Preferences
  • Comprehensive Insights Focused on Specific Segments or Regions
  • Customized Evaluation of Competitive Landscape to Meet Your Needs
  • Tailored Customization to Address Other Specific Requirements
Ask for customization


Key Insights

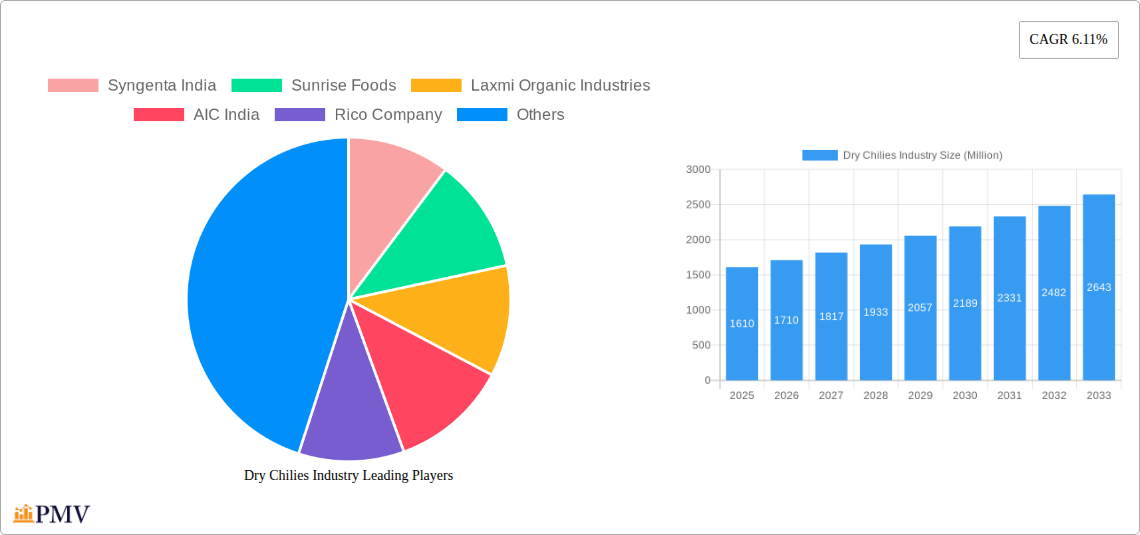
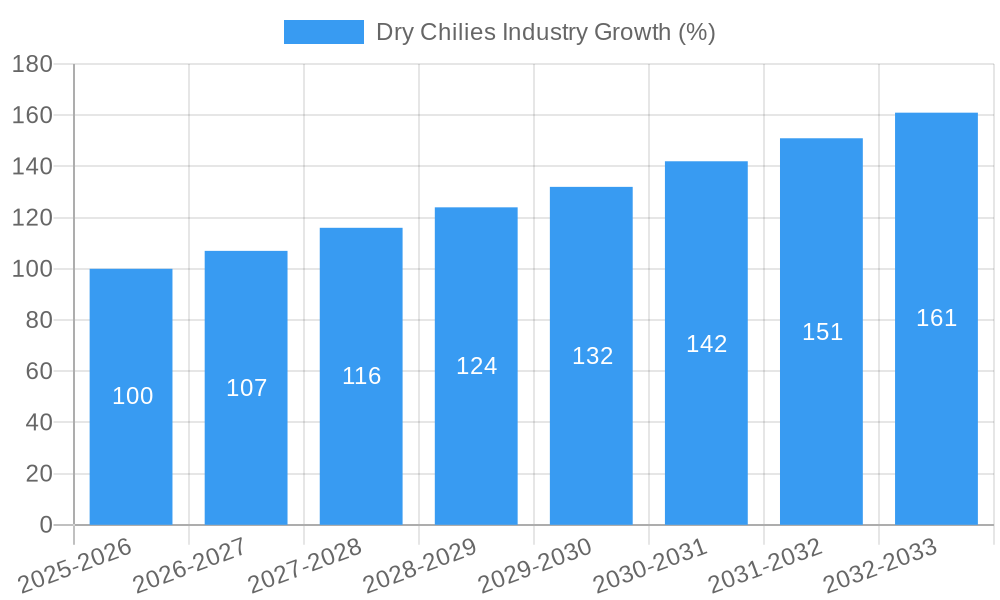
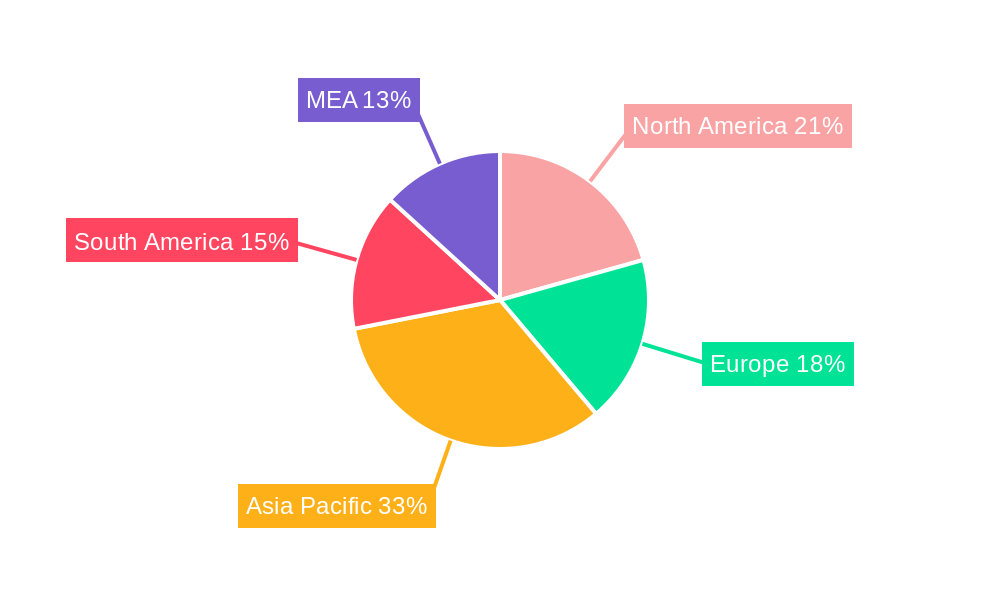
The global dry chilies market, valued at $1.61 billion in 2025, is projected to experience robust growth, driven by a compound annual growth rate (CAGR) of 6.11% from 2025 to 2033. This expansion is fueled by several key factors. The increasing demand for chili peppers in diverse culinary applications across the food and beverage industry is a primary driver. Consumers' growing preference for spicy food, coupled with the expanding global food processing sector, fuels market growth. Furthermore, the utilization of dry chilies in pharmaceuticals, cosmetics, and even pesticides presents emerging avenues for market expansion. The rising adoption of natural and organic ingredients across various industries further contributes to the market's positive trajectory. Regional variations in consumption patterns are noteworthy. North America and Europe, with established spice markets and strong demand for processed food, represent significant market segments. However, the Asia-Pacific region, particularly India and China, are anticipated to exhibit faster growth rates due to expanding populations and changing dietary habits. While challenges exist, including fluctuating chili pepper prices due to weather patterns and supply chain disruptions, the overall market outlook remains optimistic, indicating sustained growth potential in the coming years.

The market segmentation reveals significant opportunities within specific product types and applications. Guajillo, ancho, chipotle, pasilla, and California chili peppers each command a portion of the market, reflecting diverse consumer preferences and culinary traditions. The food and beverage segment dominates market share, with significant potential for further growth within processed foods, sauces, and ready-to-eat meals. The pharmaceuticals and cosmetics sectors, while smaller, offer niche markets with opportunities for growth as consumer awareness of natural ingredients increases. Key players, including Syngenta India, Sunrise Foods, Laxmi Organic Industries, AIC India, and Rico Company, are strategically positioned to capitalize on these market dynamics. Their success hinges on innovation in product development, supply chain optimization, and effective marketing strategies aimed at diverse consumer segments across different geographical regions. Competitive landscape analysis reveals a mix of established players and emerging companies, suggesting healthy competition and continuous market evolution.

This comprehensive report provides an in-depth analysis of the global dry chilies industry, offering valuable insights for businesses, investors, and stakeholders. Covering the period 2019-2033, with a base year of 2025 and a forecast period of 2025-2033, this report delves into market structure, competitive dynamics, industry trends, dominant segments, product innovations, and future growth prospects. The global dry chilies market is projected to reach xx Million by 2033, exhibiting a CAGR of xx% during the forecast period.

Dry Chilies Industry Research Report - Market Size, Growth & Forecast

Dry Chilies Industry Market Structure & Competitive Dynamics

The dry chilies industry exhibits a moderately fragmented market structure. While a few large players like Syngenta India, Laxmi Organic Industries, and Rico Company hold significant market share, numerous smaller regional players also contribute substantially. Market concentration is influenced by factors including geographical location, access to resources, and processing capabilities. The industry's innovation ecosystem is dynamic, driven by advancements in seed technology, farming practices, and processing techniques. Regulatory frameworks vary across different regions, impacting production, labeling, and trade. Product substitutes, such as other spices and flavorings, exert a competitive pressure, though the unique flavor profile of dry chilies maintains strong demand. End-user trends towards healthier and more diverse food options are bolstering the market. M&A activities are relatively infrequent but can significantly reshape market dynamics. For instance, a hypothetical merger valued at xx Million could significantly alter the competitive landscape. Market share data indicates that the top three players account for approximately xx% of the global market, while the remaining share is distributed among numerous smaller participants.

Dry Chilies Industry Industry Trends & Insights

The global dry chilies market is experiencing robust growth, driven by several key factors. The increasing demand for chili peppers in the food and beverage industry, particularly in the rapidly expanding Asian and Latin American markets, is a major catalyst. Technological advancements in farming techniques, such as improved irrigation and the adoption of hybrid seeds, are increasing yields and enhancing product quality. Changing consumer preferences, with a growing emphasis on spicy and flavorful foods, are further fueling market growth. The market penetration of dry chilies in various applications, including pharmaceuticals, cosmetics, and pesticides, is steadily increasing. However, volatile weather patterns and climate change pose challenges to production, creating price fluctuations and impacting supply chains. The overall market is expected to witness a CAGR of xx% during the forecast period, reaching xx Million by 2033.

Dry Chilies Industry Growth

Dominant Markets & Segments in Dry Chilies Industry

The food and beverage industry remains the dominant application segment for dry chilies, accounting for over xx% of the overall market. Within product types, the Guajillo, Ancho, and Chipotle varieties are particularly popular, driven by their distinct flavor profiles and versatility in culinary applications.

  • Key Drivers in the Food and Beverage Segment:
    • Growing global demand for spicy food
    • Increasing popularity of ethnic cuisines
    • Expansion of the food processing industry

Geographically, India, Mexico, and China are the leading producers and consumers of dry chilies, collectively accounting for a significant portion of the global market.

  • Key Drivers in Leading Regions:
    • Favourable climatic conditions for chili cultivation
    • Established agricultural infrastructure
    • Government support for chili farming

Detailed dominance analysis reveals that India's dominance stems from its large-scale production, favourable climate, and extensive agricultural infrastructure. Mexico's strong position is tied to its heritage of chili pepper cultivation and diverse chili varieties. China's significance is linked to its substantial domestic consumption and growing export market.

Dry Chilies Industry Product Innovations

Recent innovations in the dry chilies industry focus on improving crop yields, enhancing processing techniques, and expanding product applications. Advancements in seed technology, such as the development of hybrid varieties with increased disease resistance and higher yields, are transforming chili farming. Improved drying and processing techniques ensure better quality, longer shelf life, and consistent flavor profiles. The exploration of novel applications, such as utilizing chili extracts in cosmetics and pharmaceuticals, is broadening the market reach of dry chilies.

Report Segmentation & Scope

This report segments the dry chilies market based on product type (Guajillo, Ancho, Chipotle, Pasilla, California Chili) and application (food and beverage industry, pharmaceuticals, cosmetics, pesticides). Each segment's growth projections, market size, and competitive dynamics are thoroughly analyzed. The food and beverage segment is projected to maintain its dominant position, while the pharmaceutical and cosmetic segments are expected to exhibit significant growth due to the increasing interest in natural ingredients. Competitive dynamics vary across segments, with varying levels of market concentration and competitive pressures.

Key Drivers of Dry Chilies Industry Growth

Several key factors are driving the growth of the dry chilies industry. Firstly, the rising global demand for spicy food, fuelled by the popularity of international cuisines, significantly impacts market expansion. Secondly, technological advancements in farming and processing techniques are improving yields and product quality. Finally, supportive government policies and investments in agricultural infrastructure in key producing regions provide further impetus to growth.

Challenges in the Dry Chilies Industry Sector

The dry chilies industry faces challenges such as unpredictable weather patterns, susceptibility to diseases and pests, and fluctuations in global prices. Supply chain disruptions due to geopolitical events and logistical complexities also impact production and distribution. Furthermore, competition from substitute spices and stringent regulatory compliance requirements pose significant challenges to industry players. These factors together contribute to xx Million in estimated losses annually.

Leading Players in the Dry Chilies Industry Market

  • Syngenta India
  • Sunrise Foods
  • Laxmi Organic Industries
  • AIC India
  • Rico Company

Key Developments in Dry Chilies Industry Sector

  • June 2022: Syngenta India partnered with the Agriculture Insurance Company of India (AIC) to mitigate price volatility risks for chili farmers. This initiative aims to enhance the stability and resilience of the chili supply chain.
  • November 2022: The Indonesian government implemented strategic policies to boost domestic chili production, reducing reliance on imports. These policies included promoting hybrid seeds, improving irrigation, and upgrading farming infrastructure. This initiative is expected to significantly impact regional supply and pricing.

Strategic Dry Chilies Industry Market Outlook

The future of the dry chilies industry appears promising, with significant growth potential driven by increasing consumer demand, technological advancements, and strategic investments. The focus on sustainable farming practices, innovative product development, and expansion into new applications will shape the industry's trajectory. Exploiting the growing demand in emerging markets and strategic partnerships will be key success factors for industry players. The overall market outlook is positive, with opportunities for substantial growth and market share gains for those companies that adapt effectively to the evolving market dynamics.

Dry Chilies Industry Segmentation

  • 1. Production Analysis
  • 2. Consumption Analysis
  • 3. Import Market Analysis (Value & Volume)
  • 4. Export Market Analysis (Value & Volume)
  • 5. Price Trend Analysis

Dry Chilies Industry Segmentation By Geography

  • 1. North America
    • 1.1. United States
    • 1.2. Canada
    • 1.3. Mexico
  • 2. Europe
    • 2.1. United Kingdom
    • 2.2. Germany
    • 2.3. France
    • 2.4. Spain
  • 3. Asia Pacific
    • 3.1. China
    • 3.2. Australia
    • 3.3. India
  • 4. South America
    • 4.1. Brazil
    • 4.2. Argentina
  • 5. Africa
    • 5.1. South Africa
    • 5.2. Egypt
Dry Chilies Industry Regional Share


Dry Chilies Industry REPORT HIGHLIGHTS

AspectsDetails
Study Period 2019-2033
Base Year 2024
Estimated Year 2025
Forecast Period2025-2033
Historical Period2019-2024
Growth RateCAGR of 6.11% from 2019-2033
Segmentation
    • By Production Analysis
    • By Consumption Analysis
    • By Import Market Analysis (Value & Volume)
    • By Export Market Analysis (Value & Volume)
    • By Price Trend Analysis
  • By Geography
    • North America
      • United States
      • Canada
      • Mexico
    • Europe
      • United Kingdom
      • Germany
      • France
      • Spain
    • Asia Pacific
      • China
      • Australia
      • India
    • South America
      • Brazil
      • Argentina
    • Africa
      • South Africa
      • Egypt


Table of Contents

  1. 1. Introduction
    • 1.1. Research Scope
    • 1.2. Market Segmentation
    • 1.3. Research Methodology
    • 1.4. Definitions and Assumptions
  2. 2. Executive Summary
    • 2.1. Introduction
  3. 3. Market Dynamics
    • 3.1. Introduction
      • 3.2. Market Drivers
        • 3.2.1. Increasing Berry Consumption for Health Benefits; Increasing Adoption of High-Technology Farm Practices; Growing Usage of Berries in the Food and Beverage Industries
      • 3.3. Market Restrains
        • 3.3.1. High Production Cost Involved in Berry Production; Increasing Disease and Pest Infestations
      • 3.4. Market Trends
        • 3.4.1. High Demand for the Exotic and Spicy Oriental Dishes
  4. 4. Market Factor Analysis
    • 4.1. Porters Five Forces
    • 4.2. Supply/Value Chain
    • 4.3. PESTEL analysis
    • 4.4. Market Entropy
    • 4.5. Patent/Trademark Analysis
  5. 5. Global Dry Chilies Industry Analysis, Insights and Forecast, 2019-2031
    • 5.1. Market Analysis, Insights and Forecast - by Production Analysis
      • 5.2. Market Analysis, Insights and Forecast - by Consumption Analysis
        • 5.3. Market Analysis, Insights and Forecast - by Import Market Analysis (Value & Volume)
          • 5.4. Market Analysis, Insights and Forecast - by Export Market Analysis (Value & Volume)
            • 5.5. Market Analysis, Insights and Forecast - by Price Trend Analysis
              • 5.6. Market Analysis, Insights and Forecast - by Region
                • 5.6.1. North America
                • 5.6.2. Europe
                • 5.6.3. Asia Pacific
                • 5.6.4. South America
                • 5.6.5. Africa
            • 6. North America Dry Chilies Industry Analysis, Insights and Forecast, 2019-2031
              • 6.1. Market Analysis, Insights and Forecast - by Production Analysis
                • 6.2. Market Analysis, Insights and Forecast - by Consumption Analysis
                  • 6.3. Market Analysis, Insights and Forecast - by Import Market Analysis (Value & Volume)
                    • 6.4. Market Analysis, Insights and Forecast - by Export Market Analysis (Value & Volume)
                      • 6.5. Market Analysis, Insights and Forecast - by Price Trend Analysis
                      • 7. Europe Dry Chilies Industry Analysis, Insights and Forecast, 2019-2031
                        • 7.1. Market Analysis, Insights and Forecast - by Production Analysis
                          • 7.2. Market Analysis, Insights and Forecast - by Consumption Analysis
                            • 7.3. Market Analysis, Insights and Forecast - by Import Market Analysis (Value & Volume)
                              • 7.4. Market Analysis, Insights and Forecast - by Export Market Analysis (Value & Volume)
                                • 7.5. Market Analysis, Insights and Forecast - by Price Trend Analysis
                                • 8. Asia Pacific Dry Chilies Industry Analysis, Insights and Forecast, 2019-2031
                                  • 8.1. Market Analysis, Insights and Forecast - by Production Analysis
                                    • 8.2. Market Analysis, Insights and Forecast - by Consumption Analysis
                                      • 8.3. Market Analysis, Insights and Forecast - by Import Market Analysis (Value & Volume)
                                        • 8.4. Market Analysis, Insights and Forecast - by Export Market Analysis (Value & Volume)
                                          • 8.5. Market Analysis, Insights and Forecast - by Price Trend Analysis
                                          • 9. South America Dry Chilies Industry Analysis, Insights and Forecast, 2019-2031
                                            • 9.1. Market Analysis, Insights and Forecast - by Production Analysis
                                              • 9.2. Market Analysis, Insights and Forecast - by Consumption Analysis
                                                • 9.3. Market Analysis, Insights and Forecast - by Import Market Analysis (Value & Volume)
                                                  • 9.4. Market Analysis, Insights and Forecast - by Export Market Analysis (Value & Volume)
                                                    • 9.5. Market Analysis, Insights and Forecast - by Price Trend Analysis
                                                    • 10. Africa Dry Chilies Industry Analysis, Insights and Forecast, 2019-2031
                                                      • 10.1. Market Analysis, Insights and Forecast - by Production Analysis
                                                        • 10.2. Market Analysis, Insights and Forecast - by Consumption Analysis
                                                          • 10.3. Market Analysis, Insights and Forecast - by Import Market Analysis (Value & Volume)
                                                            • 10.4. Market Analysis, Insights and Forecast - by Export Market Analysis (Value & Volume)
                                                              • 10.5. Market Analysis, Insights and Forecast - by Price Trend Analysis
                                                              • 11. North America Dry Chilies Industry Analysis, Insights and Forecast, 2019-2031
                                                                  • 11.1. Market Analysis, Insights and Forecast - By Country/Sub-region
                                                                    • 11.1.1 United States
                                                                    • 11.1.2 Canada
                                                                    • 11.1.3 Mexico
                                                              • 12. Europe Dry Chilies Industry Analysis, Insights and Forecast, 2019-2031
                                                                  • 12.1. Market Analysis, Insights and Forecast - By Country/Sub-region
                                                                    • 12.1.1 Germany
                                                                    • 12.1.2 United Kingdom
                                                                    • 12.1.3 France
                                                                    • 12.1.4 Spain
                                                                    • 12.1.5 Italy
                                                                    • 12.1.6 Spain
                                                                    • 12.1.7 Belgium
                                                                    • 12.1.8 Netherland
                                                                    • 12.1.9 Nordics
                                                                    • 12.1.10 Rest of Europe
                                                              • 13. Asia Pacific Dry Chilies Industry Analysis, Insights and Forecast, 2019-2031
                                                                  • 13.1. Market Analysis, Insights and Forecast - By Country/Sub-region
                                                                    • 13.1.1 China
                                                                    • 13.1.2 Japan
                                                                    • 13.1.3 India
                                                                    • 13.1.4 South Korea
                                                                    • 13.1.5 Southeast Asia
                                                                    • 13.1.6 Australia
                                                                    • 13.1.7 Indonesia
                                                                    • 13.1.8 Phillipes
                                                                    • 13.1.9 Singapore
                                                                    • 13.1.10 Thailandc
                                                                    • 13.1.11 Rest of Asia Pacific
                                                              • 14. South America Dry Chilies Industry Analysis, Insights and Forecast, 2019-2031
                                                                  • 14.1. Market Analysis, Insights and Forecast - By Country/Sub-region
                                                                    • 14.1.1 Brazil
                                                                    • 14.1.2 Argentina
                                                                    • 14.1.3 Peru
                                                                    • 14.1.4 Chile
                                                                    • 14.1.5 Colombia
                                                                    • 14.1.6 Ecuador
                                                                    • 14.1.7 Venezuela
                                                                    • 14.1.8 Rest of South America
                                                              • 15. MEA Dry Chilies Industry Analysis, Insights and Forecast, 2019-2031
                                                                  • 15.1. Market Analysis, Insights and Forecast - By Country/Sub-region
                                                                    • 15.1.1 United Arab Emirates
                                                                    • 15.1.2 Saudi Arabia
                                                                    • 15.1.3 South Africa
                                                                    • 15.1.4 Rest of Middle East and Africa
                                                              • 16. Competitive Analysis
                                                                • 16.1. Global Market Share Analysis 2024
                                                                  • 16.2. Company Profiles
                                                                    • 16.2.1 Syngenta India
                                                                      • 16.2.1.1. Overview
                                                                      • 16.2.1.2. Products
                                                                      • 16.2.1.3. SWOT Analysis
                                                                      • 16.2.1.4. Recent Developments
                                                                      • 16.2.1.5. Financials (Based on Availability)
                                                                    • 16.2.2 Sunrise Foods
                                                                      • 16.2.2.1. Overview
                                                                      • 16.2.2.2. Products
                                                                      • 16.2.2.3. SWOT Analysis
                                                                      • 16.2.2.4. Recent Developments
                                                                      • 16.2.2.5. Financials (Based on Availability)
                                                                    • 16.2.3 Laxmi Organic Industries
                                                                      • 16.2.3.1. Overview
                                                                      • 16.2.3.2. Products
                                                                      • 16.2.3.3. SWOT Analysis
                                                                      • 16.2.3.4. Recent Developments
                                                                      • 16.2.3.5. Financials (Based on Availability)
                                                                    • 16.2.4 AIC India
                                                                      • 16.2.4.1. Overview
                                                                      • 16.2.4.2. Products
                                                                      • 16.2.4.3. SWOT Analysis
                                                                      • 16.2.4.4. Recent Developments
                                                                      • 16.2.4.5. Financials (Based on Availability)
                                                                    • 16.2.5 Rico Company
                                                                      • 16.2.5.1. Overview
                                                                      • 16.2.5.2. Products
                                                                      • 16.2.5.3. SWOT Analysis
                                                                      • 16.2.5.4. Recent Developments
                                                                      • 16.2.5.5. Financials (Based on Availability)

                                                              List of Figures

                                                              1. Figure 1: Global Dry Chilies Industry Revenue Breakdown (Million, %) by Region 2024 & 2032
                                                              2. Figure 2: North America Dry Chilies Industry Revenue (Million), by Country 2024 & 2032
                                                              3. Figure 3: North America Dry Chilies Industry Revenue Share (%), by Country 2024 & 2032
                                                              4. Figure 4: Europe Dry Chilies Industry Revenue (Million), by Country 2024 & 2032
                                                              5. Figure 5: Europe Dry Chilies Industry Revenue Share (%), by Country 2024 & 2032
                                                              6. Figure 6: Asia Pacific Dry Chilies Industry Revenue (Million), by Country 2024 & 2032
                                                              7. Figure 7: Asia Pacific Dry Chilies Industry Revenue Share (%), by Country 2024 & 2032
                                                              8. Figure 8: South America Dry Chilies Industry Revenue (Million), by Country 2024 & 2032
                                                              9. Figure 9: South America Dry Chilies Industry Revenue Share (%), by Country 2024 & 2032
                                                              10. Figure 10: MEA Dry Chilies Industry Revenue (Million), by Country 2024 & 2032
                                                              11. Figure 11: MEA Dry Chilies Industry Revenue Share (%), by Country 2024 & 2032
                                                              12. Figure 12: North America Dry Chilies Industry Revenue (Million), by Production Analysis 2024 & 2032
                                                              13. Figure 13: North America Dry Chilies Industry Revenue Share (%), by Production Analysis 2024 & 2032
                                                              14. Figure 14: North America Dry Chilies Industry Revenue (Million), by Consumption Analysis 2024 & 2032
                                                              15. Figure 15: North America Dry Chilies Industry Revenue Share (%), by Consumption Analysis 2024 & 2032
                                                              16. Figure 16: North America Dry Chilies Industry Revenue (Million), by Import Market Analysis (Value & Volume) 2024 & 2032
                                                              17. Figure 17: North America Dry Chilies Industry Revenue Share (%), by Import Market Analysis (Value & Volume) 2024 & 2032
                                                              18. Figure 18: North America Dry Chilies Industry Revenue (Million), by Export Market Analysis (Value & Volume) 2024 & 2032
                                                              19. Figure 19: North America Dry Chilies Industry Revenue Share (%), by Export Market Analysis (Value & Volume) 2024 & 2032
                                                              20. Figure 20: North America Dry Chilies Industry Revenue (Million), by Price Trend Analysis 2024 & 2032
                                                              21. Figure 21: North America Dry Chilies Industry Revenue Share (%), by Price Trend Analysis 2024 & 2032
                                                              22. Figure 22: North America Dry Chilies Industry Revenue (Million), by Country 2024 & 2032
                                                              23. Figure 23: North America Dry Chilies Industry Revenue Share (%), by Country 2024 & 2032
                                                              24. Figure 24: Europe Dry Chilies Industry Revenue (Million), by Production Analysis 2024 & 2032
                                                              25. Figure 25: Europe Dry Chilies Industry Revenue Share (%), by Production Analysis 2024 & 2032
                                                              26. Figure 26: Europe Dry Chilies Industry Revenue (Million), by Consumption Analysis 2024 & 2032
                                                              27. Figure 27: Europe Dry Chilies Industry Revenue Share (%), by Consumption Analysis 2024 & 2032
                                                              28. Figure 28: Europe Dry Chilies Industry Revenue (Million), by Import Market Analysis (Value & Volume) 2024 & 2032
                                                              29. Figure 29: Europe Dry Chilies Industry Revenue Share (%), by Import Market Analysis (Value & Volume) 2024 & 2032
                                                              30. Figure 30: Europe Dry Chilies Industry Revenue (Million), by Export Market Analysis (Value & Volume) 2024 & 2032
                                                              31. Figure 31: Europe Dry Chilies Industry Revenue Share (%), by Export Market Analysis (Value & Volume) 2024 & 2032
                                                              32. Figure 32: Europe Dry Chilies Industry Revenue (Million), by Price Trend Analysis 2024 & 2032
                                                              33. Figure 33: Europe Dry Chilies Industry Revenue Share (%), by Price Trend Analysis 2024 & 2032
                                                              34. Figure 34: Europe Dry Chilies Industry Revenue (Million), by Country 2024 & 2032
                                                              35. Figure 35: Europe Dry Chilies Industry Revenue Share (%), by Country 2024 & 2032
                                                              36. Figure 36: Asia Pacific Dry Chilies Industry Revenue (Million), by Production Analysis 2024 & 2032
                                                              37. Figure 37: Asia Pacific Dry Chilies Industry Revenue Share (%), by Production Analysis 2024 & 2032
                                                              38. Figure 38: Asia Pacific Dry Chilies Industry Revenue (Million), by Consumption Analysis 2024 & 2032
                                                              39. Figure 39: Asia Pacific Dry Chilies Industry Revenue Share (%), by Consumption Analysis 2024 & 2032
                                                              40. Figure 40: Asia Pacific Dry Chilies Industry Revenue (Million), by Import Market Analysis (Value & Volume) 2024 & 2032
                                                              41. Figure 41: Asia Pacific Dry Chilies Industry Revenue Share (%), by Import Market Analysis (Value & Volume) 2024 & 2032
                                                              42. Figure 42: Asia Pacific Dry Chilies Industry Revenue (Million), by Export Market Analysis (Value & Volume) 2024 & 2032
                                                              43. Figure 43: Asia Pacific Dry Chilies Industry Revenue Share (%), by Export Market Analysis (Value & Volume) 2024 & 2032
                                                              44. Figure 44: Asia Pacific Dry Chilies Industry Revenue (Million), by Price Trend Analysis 2024 & 2032
                                                              45. Figure 45: Asia Pacific Dry Chilies Industry Revenue Share (%), by Price Trend Analysis 2024 & 2032
                                                              46. Figure 46: Asia Pacific Dry Chilies Industry Revenue (Million), by Country 2024 & 2032
                                                              47. Figure 47: Asia Pacific Dry Chilies Industry Revenue Share (%), by Country 2024 & 2032
                                                              48. Figure 48: South America Dry Chilies Industry Revenue (Million), by Production Analysis 2024 & 2032
                                                              49. Figure 49: South America Dry Chilies Industry Revenue Share (%), by Production Analysis 2024 & 2032
                                                              50. Figure 50: South America Dry Chilies Industry Revenue (Million), by Consumption Analysis 2024 & 2032
                                                              51. Figure 51: South America Dry Chilies Industry Revenue Share (%), by Consumption Analysis 2024 & 2032
                                                              52. Figure 52: South America Dry Chilies Industry Revenue (Million), by Import Market Analysis (Value & Volume) 2024 & 2032
                                                              53. Figure 53: South America Dry Chilies Industry Revenue Share (%), by Import Market Analysis (Value & Volume) 2024 & 2032
                                                              54. Figure 54: South America Dry Chilies Industry Revenue (Million), by Export Market Analysis (Value & Volume) 2024 & 2032
                                                              55. Figure 55: South America Dry Chilies Industry Revenue Share (%), by Export Market Analysis (Value & Volume) 2024 & 2032
                                                              56. Figure 56: South America Dry Chilies Industry Revenue (Million), by Price Trend Analysis 2024 & 2032
                                                              57. Figure 57: South America Dry Chilies Industry Revenue Share (%), by Price Trend Analysis 2024 & 2032
                                                              58. Figure 58: South America Dry Chilies Industry Revenue (Million), by Country 2024 & 2032
                                                              59. Figure 59: South America Dry Chilies Industry Revenue Share (%), by Country 2024 & 2032
                                                              60. Figure 60: Africa Dry Chilies Industry Revenue (Million), by Production Analysis 2024 & 2032
                                                              61. Figure 61: Africa Dry Chilies Industry Revenue Share (%), by Production Analysis 2024 & 2032
                                                              62. Figure 62: Africa Dry Chilies Industry Revenue (Million), by Consumption Analysis 2024 & 2032
                                                              63. Figure 63: Africa Dry Chilies Industry Revenue Share (%), by Consumption Analysis 2024 & 2032
                                                              64. Figure 64: Africa Dry Chilies Industry Revenue (Million), by Import Market Analysis (Value & Volume) 2024 & 2032
                                                              65. Figure 65: Africa Dry Chilies Industry Revenue Share (%), by Import Market Analysis (Value & Volume) 2024 & 2032
                                                              66. Figure 66: Africa Dry Chilies Industry Revenue (Million), by Export Market Analysis (Value & Volume) 2024 & 2032
                                                              67. Figure 67: Africa Dry Chilies Industry Revenue Share (%), by Export Market Analysis (Value & Volume) 2024 & 2032
                                                              68. Figure 68: Africa Dry Chilies Industry Revenue (Million), by Price Trend Analysis 2024 & 2032
                                                              69. Figure 69: Africa Dry Chilies Industry Revenue Share (%), by Price Trend Analysis 2024 & 2032
                                                              70. Figure 70: Africa Dry Chilies Industry Revenue (Million), by Country 2024 & 2032
                                                              71. Figure 71: Africa Dry Chilies Industry Revenue Share (%), by Country 2024 & 2032

                                                              List of Tables

                                                              1. Table 1: Global Dry Chilies Industry Revenue Million Forecast, by Region 2019 & 2032
                                                              2. Table 2: Global Dry Chilies Industry Revenue Million Forecast, by Production Analysis 2019 & 2032
                                                              3. Table 3: Global Dry Chilies Industry Revenue Million Forecast, by Consumption Analysis 2019 & 2032
                                                              4. Table 4: Global Dry Chilies Industry Revenue Million Forecast, by Import Market Analysis (Value & Volume) 2019 & 2032
                                                              5. Table 5: Global Dry Chilies Industry Revenue Million Forecast, by Export Market Analysis (Value & Volume) 2019 & 2032
                                                              6. Table 6: Global Dry Chilies Industry Revenue Million Forecast, by Price Trend Analysis 2019 & 2032
                                                              7. Table 7: Global Dry Chilies Industry Revenue Million Forecast, by Region 2019 & 2032
                                                              8. Table 8: Global Dry Chilies Industry Revenue Million Forecast, by Country 2019 & 2032
                                                              9. Table 9: United States Dry Chilies Industry Revenue (Million) Forecast, by Application 2019 & 2032
                                                              10. Table 10: Canada Dry Chilies Industry Revenue (Million) Forecast, by Application 2019 & 2032
                                                              11. Table 11: Mexico Dry Chilies Industry Revenue (Million) Forecast, by Application 2019 & 2032
                                                              12. Table 12: Global Dry Chilies Industry Revenue Million Forecast, by Country 2019 & 2032
                                                              13. Table 13: Germany Dry Chilies Industry Revenue (Million) Forecast, by Application 2019 & 2032
                                                              14. Table 14: United Kingdom Dry Chilies Industry Revenue (Million) Forecast, by Application 2019 & 2032
                                                              15. Table 15: France Dry Chilies Industry Revenue (Million) Forecast, by Application 2019 & 2032
                                                              16. Table 16: Spain Dry Chilies Industry Revenue (Million) Forecast, by Application 2019 & 2032
                                                              17. Table 17: Italy Dry Chilies Industry Revenue (Million) Forecast, by Application 2019 & 2032
                                                              18. Table 18: Spain Dry Chilies Industry Revenue (Million) Forecast, by Application 2019 & 2032
                                                              19. Table 19: Belgium Dry Chilies Industry Revenue (Million) Forecast, by Application 2019 & 2032
                                                              20. Table 20: Netherland Dry Chilies Industry Revenue (Million) Forecast, by Application 2019 & 2032
                                                              21. Table 21: Nordics Dry Chilies Industry Revenue (Million) Forecast, by Application 2019 & 2032
                                                              22. Table 22: Rest of Europe Dry Chilies Industry Revenue (Million) Forecast, by Application 2019 & 2032
                                                              23. Table 23: Global Dry Chilies Industry Revenue Million Forecast, by Country 2019 & 2032
                                                              24. Table 24: China Dry Chilies Industry Revenue (Million) Forecast, by Application 2019 & 2032
                                                              25. Table 25: Japan Dry Chilies Industry Revenue (Million) Forecast, by Application 2019 & 2032
                                                              26. Table 26: India Dry Chilies Industry Revenue (Million) Forecast, by Application 2019 & 2032
                                                              27. Table 27: South Korea Dry Chilies Industry Revenue (Million) Forecast, by Application 2019 & 2032
                                                              28. Table 28: Southeast Asia Dry Chilies Industry Revenue (Million) Forecast, by Application 2019 & 2032
                                                              29. Table 29: Australia Dry Chilies Industry Revenue (Million) Forecast, by Application 2019 & 2032
                                                              30. Table 30: Indonesia Dry Chilies Industry Revenue (Million) Forecast, by Application 2019 & 2032
                                                              31. Table 31: Phillipes Dry Chilies Industry Revenue (Million) Forecast, by Application 2019 & 2032
                                                              32. Table 32: Singapore Dry Chilies Industry Revenue (Million) Forecast, by Application 2019 & 2032
                                                              33. Table 33: Thailandc Dry Chilies Industry Revenue (Million) Forecast, by Application 2019 & 2032
                                                              34. Table 34: Rest of Asia Pacific Dry Chilies Industry Revenue (Million) Forecast, by Application 2019 & 2032
                                                              35. Table 35: Global Dry Chilies Industry Revenue Million Forecast, by Country 2019 & 2032
                                                              36. Table 36: Brazil Dry Chilies Industry Revenue (Million) Forecast, by Application 2019 & 2032
                                                              37. Table 37: Argentina Dry Chilies Industry Revenue (Million) Forecast, by Application 2019 & 2032
                                                              38. Table 38: Peru Dry Chilies Industry Revenue (Million) Forecast, by Application 2019 & 2032
                                                              39. Table 39: Chile Dry Chilies Industry Revenue (Million) Forecast, by Application 2019 & 2032
                                                              40. Table 40: Colombia Dry Chilies Industry Revenue (Million) Forecast, by Application 2019 & 2032
                                                              41. Table 41: Ecuador Dry Chilies Industry Revenue (Million) Forecast, by Application 2019 & 2032
                                                              42. Table 42: Venezuela Dry Chilies Industry Revenue (Million) Forecast, by Application 2019 & 2032
                                                              43. Table 43: Rest of South America Dry Chilies Industry Revenue (Million) Forecast, by Application 2019 & 2032
                                                              44. Table 44: Global Dry Chilies Industry Revenue Million Forecast, by Country 2019 & 2032
                                                              45. Table 45: United Arab Emirates Dry Chilies Industry Revenue (Million) Forecast, by Application 2019 & 2032
                                                              46. Table 46: Saudi Arabia Dry Chilies Industry Revenue (Million) Forecast, by Application 2019 & 2032
                                                              47. Table 47: South Africa Dry Chilies Industry Revenue (Million) Forecast, by Application 2019 & 2032
                                                              48. Table 48: Rest of Middle East and Africa Dry Chilies Industry Revenue (Million) Forecast, by Application 2019 & 2032
                                                              49. Table 49: Global Dry Chilies Industry Revenue Million Forecast, by Production Analysis 2019 & 2032
                                                              50. Table 50: Global Dry Chilies Industry Revenue Million Forecast, by Consumption Analysis 2019 & 2032
                                                              51. Table 51: Global Dry Chilies Industry Revenue Million Forecast, by Import Market Analysis (Value & Volume) 2019 & 2032
                                                              52. Table 52: Global Dry Chilies Industry Revenue Million Forecast, by Export Market Analysis (Value & Volume) 2019 & 2032
                                                              53. Table 53: Global Dry Chilies Industry Revenue Million Forecast, by Price Trend Analysis 2019 & 2032
                                                              54. Table 54: Global Dry Chilies Industry Revenue Million Forecast, by Country 2019 & 2032
                                                              55. Table 55: United States Dry Chilies Industry Revenue (Million) Forecast, by Application 2019 & 2032
                                                              56. Table 56: Canada Dry Chilies Industry Revenue (Million) Forecast, by Application 2019 & 2032
                                                              57. Table 57: Mexico Dry Chilies Industry Revenue (Million) Forecast, by Application 2019 & 2032
                                                              58. Table 58: Global Dry Chilies Industry Revenue Million Forecast, by Production Analysis 2019 & 2032
                                                              59. Table 59: Global Dry Chilies Industry Revenue Million Forecast, by Consumption Analysis 2019 & 2032
                                                              60. Table 60: Global Dry Chilies Industry Revenue Million Forecast, by Import Market Analysis (Value & Volume) 2019 & 2032
                                                              61. Table 61: Global Dry Chilies Industry Revenue Million Forecast, by Export Market Analysis (Value & Volume) 2019 & 2032
                                                              62. Table 62: Global Dry Chilies Industry Revenue Million Forecast, by Price Trend Analysis 2019 & 2032
                                                              63. Table 63: Global Dry Chilies Industry Revenue Million Forecast, by Country 2019 & 2032
                                                              64. Table 64: United Kingdom Dry Chilies Industry Revenue (Million) Forecast, by Application 2019 & 2032
                                                              65. Table 65: Germany Dry Chilies Industry Revenue (Million) Forecast, by Application 2019 & 2032
                                                              66. Table 66: France Dry Chilies Industry Revenue (Million) Forecast, by Application 2019 & 2032
                                                              67. Table 67: Spain Dry Chilies Industry Revenue (Million) Forecast, by Application 2019 & 2032
                                                              68. Table 68: Global Dry Chilies Industry Revenue Million Forecast, by Production Analysis 2019 & 2032
                                                              69. Table 69: Global Dry Chilies Industry Revenue Million Forecast, by Consumption Analysis 2019 & 2032
                                                              70. Table 70: Global Dry Chilies Industry Revenue Million Forecast, by Import Market Analysis (Value & Volume) 2019 & 2032
                                                              71. Table 71: Global Dry Chilies Industry Revenue Million Forecast, by Export Market Analysis (Value & Volume) 2019 & 2032
                                                              72. Table 72: Global Dry Chilies Industry Revenue Million Forecast, by Price Trend Analysis 2019 & 2032
                                                              73. Table 73: Global Dry Chilies Industry Revenue Million Forecast, by Country 2019 & 2032
                                                              74. Table 74: China Dry Chilies Industry Revenue (Million) Forecast, by Application 2019 & 2032
                                                              75. Table 75: Australia Dry Chilies Industry Revenue (Million) Forecast, by Application 2019 & 2032
                                                              76. Table 76: India Dry Chilies Industry Revenue (Million) Forecast, by Application 2019 & 2032
                                                              77. Table 77: Global Dry Chilies Industry Revenue Million Forecast, by Production Analysis 2019 & 2032
                                                              78. Table 78: Global Dry Chilies Industry Revenue Million Forecast, by Consumption Analysis 2019 & 2032
                                                              79. Table 79: Global Dry Chilies Industry Revenue Million Forecast, by Import Market Analysis (Value & Volume) 2019 & 2032
                                                              80. Table 80: Global Dry Chilies Industry Revenue Million Forecast, by Export Market Analysis (Value & Volume) 2019 & 2032
                                                              81. Table 81: Global Dry Chilies Industry Revenue Million Forecast, by Price Trend Analysis 2019 & 2032
                                                              82. Table 82: Global Dry Chilies Industry Revenue Million Forecast, by Country 2019 & 2032
                                                              83. Table 83: Brazil Dry Chilies Industry Revenue (Million) Forecast, by Application 2019 & 2032
                                                              84. Table 84: Argentina Dry Chilies Industry Revenue (Million) Forecast, by Application 2019 & 2032
                                                              85. Table 85: Global Dry Chilies Industry Revenue Million Forecast, by Production Analysis 2019 & 2032
                                                              86. Table 86: Global Dry Chilies Industry Revenue Million Forecast, by Consumption Analysis 2019 & 2032
                                                              87. Table 87: Global Dry Chilies Industry Revenue Million Forecast, by Import Market Analysis (Value & Volume) 2019 & 2032
                                                              88. Table 88: Global Dry Chilies Industry Revenue Million Forecast, by Export Market Analysis (Value & Volume) 2019 & 2032
                                                              89. Table 89: Global Dry Chilies Industry Revenue Million Forecast, by Price Trend Analysis 2019 & 2032
                                                              90. Table 90: Global Dry Chilies Industry Revenue Million Forecast, by Country 2019 & 2032
                                                              91. Table 91: South Africa Dry Chilies Industry Revenue (Million) Forecast, by Application 2019 & 2032
                                                              92. Table 92: Egypt Dry Chilies Industry Revenue (Million) Forecast, by Application 2019 & 2032


                                                              Frequently Asked Questions

                                                              1. What is the projected Compound Annual Growth Rate (CAGR) of the Dry Chilies Industry?

                                                              The projected CAGR is approximately 6.11%.

                                                              2. Which companies are prominent players in the Dry Chilies Industry?

                                                              Key companies in the market include Syngenta India, Sunrise Foods, Laxmi Organic Industries, AIC India, Rico Company.

                                                              3. What are the main segments of the Dry Chilies Industry?

                                                              The market segments include Production Analysis, Consumption Analysis, Import Market Analysis (Value & Volume), Export Market Analysis (Value & Volume), Price Trend Analysis.

                                                              4. Can you provide details about the market size?

                                                              The market size is estimated to be USD 1.61 Million as of 2022.

                                                              5. What are some drivers contributing to market growth?

                                                              Increasing Berry Consumption for Health Benefits; Increasing Adoption of High-Technology Farm Practices; Growing Usage of Berries in the Food and Beverage Industries.

                                                              6. What are the notable trends driving market growth?

                                                              High Demand for the Exotic and Spicy Oriental Dishes.

                                                              7. Are there any restraints impacting market growth?

                                                              High Production Cost Involved in Berry Production; Increasing Disease and Pest Infestations.

                                                              8. Can you provide examples of recent developments in the market?

                                                              November 2022: The Indonesian government increased domestic production of chilies rather than importing them from abroad, and to do this, it implemented strategic policies for chili development using hybrid seeds, complete and balanced fertilization, better irrigation infrastructure and farming roads, increasing the capacity of farmers' resources, and expanding the goals and market segments.

                                                              9. What pricing options are available for accessing the report?

                                                              Pricing options include single-user, multi-user, and enterprise licenses priced at USD 4750, USD 5250, and USD 8750 respectively.

                                                              10. Is the market size provided in terms of value or volume?

                                                              The market size is provided in terms of value, measured in Million.

                                                              11. Are there any specific market keywords associated with the report?

                                                              Yes, the market keyword associated with the report is "Dry Chilies Industry," which aids in identifying and referencing the specific market segment covered.

                                                              12. How do I determine which pricing option suits my needs best?

                                                              The pricing options vary based on user requirements and access needs. Individual users may opt for single-user licenses, while businesses requiring broader access may choose multi-user or enterprise licenses for cost-effective access to the report.

                                                              13. Are there any additional resources or data provided in the Dry Chilies Industry report?

                                                              While the report offers comprehensive insights, it's advisable to review the specific contents or supplementary materials provided to ascertain if additional resources or data are available.

                                                              14. How can I stay updated on further developments or reports in the Dry Chilies Industry?

                                                              To stay informed about further developments, trends, and reports in the Dry Chilies Industry, consider subscribing to industry newsletters, following relevant companies and organizations, or regularly checking reputable industry news sources and publications.


                                                              Methodology

                                                              Step 1 - Identification of Relevant Samples Size from Population Database

                                                              Step Chart
                                                              Bar Chart
                                                              Method Chart

                                                              Step 2 - Approaches for Defining Global Market Size (Value, Volume* & Price*)

                                                              Approach Chart
                                                              Top-down and bottom-up approaches are used to validate the global market size and estimate the market size for manufactures, regional segments, product, and application.

                                                              Note*: In applicable scenarios

                                                              Step 3 - Data Sources

                                                              Primary Research

                                                              • Web Analytics
                                                              • Survey Reports
                                                              • Research Institute
                                                              • Latest Research Reports
                                                              • Opinion Leaders

                                                              Secondary Research

                                                              • Annual Reports
                                                              • White Paper
                                                              • Latest Press Release
                                                              • Industry Association
                                                              • Paid Database
                                                              • Investor Presentations
                                                              Analyst Chart

                                                              Step 4 - Data Triangulation

                                                              Involves using different sources of information in order to increase the validity of a study

                                                              These sources are likely to be stakeholders in a program - participants, other researchers, program staff, other community members, and so on.

                                                              Then we put all data in single framework & apply various statistical tools to find out the dynamic on the market.

                                                              During the analysis stage, feedback from the stakeholder groups would be compared to determine areas of agreement as well as areas of divergence

                                                              Additionally, after gathering mixed and scattered data from a wide range of sources, data is triangulated and correlated to come up with estimated figures which are further validated through primary mediums or industry experts, opinion leaders.

                                                              About Precision Market View

                                                              Precision Market View offers precise market research, industry intelligence, and data analysis for healthcare, manufacturing, technology, and energy. Our reports provide the clarity you need to make informed decisions and drive growth.

                                                              Our team combines primary research, advanced analytics, and industry expertise to deliver actionable intelligence. We offer syndicated reports, custom research, and consulting services tailored to your business needs.

                                                              At Precision Market View, we are committed to quality, transparency, and client satisfaction. Every report is rigorously validated to ensure accuracy and relevance. Our global perspective and local expertise help you understand both the big picture and the finer details of your market.

                                                              Stay informed with Precision Market View. Subscribe to our newsletter for the latest updates and research highlights, and follow us on social media for real-time insights.

                                                              Precision Market View – Clarity for Your Strategic Decisions.

                                                              artwork spiralartwork spiralRelated Reports
                                                              artwork underline

                                                              Opportunities in North America Crop Protection Chemicals Industry Market 2025-2033

                                                              The North American crop protection chemicals market is booming, projected to reach [estimated 2033 market size in millions] by 2033 with a 4.34% CAGR. Discover key trends, driving forces, and major players shaping this dynamic industry, including insecticides, herbicides, fungicides, and more. Learn about regional variations and market segmentation across various crop types and application methods.

                                                              July 2025
                                                              Base Year: 2024
                                                              No Of Pages: 180
                                                              Price: $3800

                                                              Apple Industry to Grow at XX CAGR: Market Size Analysis and Forecasts 2025-2033

                                                              Discover the latest trends in the global apple industry. This in-depth market analysis reveals a steady growth trajectory, driven by consumer demand, diverse product applications, and expanding online retail. Learn about key players, regional insights, and future projections for the apple market from 2025-2033.

                                                              July 2025
                                                              Base Year: 2024
                                                              No Of Pages: 234
                                                              Price: $4750

                                                              Digital Agriculture Market 2025-2033: Preparing for Growth and Change

                                                              The booming digital agriculture market is projected to reach \$44.14 billion by 2033, fueled by precision farming, AI, and drone technology. Explore market trends, key players (AGCO, Microsoft, Deere), and regional growth in this comprehensive analysis.

                                                              July 2025
                                                              Base Year: 2024
                                                              No Of Pages: 150
                                                              Price: $4750

                                                              North America Maize Industry Charting Growth Trajectories 2025-2033: Strategic Insights and Forecasts

                                                              Discover the booming North American maize market! This comprehensive analysis reveals key trends, drivers, and restraints, including insights into hybrid seeds, field corn, sweet corn, popcorn, and major players like Bayer & Syngenta. Project your business strategy with our forecast to 2033.

                                                              July 2025
                                                              Base Year: 2024
                                                              No Of Pages: 180
                                                              Price: $3800

                                                              North America Agricultural Tractors Machinery Market 2025-2033 Overview: Trends, Competitor Dynamics, and Opportunities

                                                              Discover the booming North American agricultural tractors market! This comprehensive analysis reveals key trends, drivers, and restraints impacting the $16.39 billion industry through 2033, focusing on key players like Deere & Company and Mahindra & Mahindra. Explore market segmentation by HP and drive type, plus regional breakdowns.

                                                              July 2025
                                                              Base Year: 2024
                                                              No Of Pages: 234
                                                              Price: $4750

                                                              APAC Biofertilizers Market Growth Opportunities: Market Size Forecast to 2033

                                                              Discover the booming APAC biofertilizers market! This comprehensive analysis reveals a CAGR of 10.80%, driven by sustainable agriculture and growing demand for organic food. Explore market size projections, key segments (Rhizobium, Azospirillum, etc.), and leading companies shaping this dynamic industry.

                                                              July 2025
                                                              Base Year: 2024
                                                              No Of Pages: 180
                                                              Price: $4750

                                                              Turkey Agricultural Tractor Market Dynamics and Forecasts: 2025-2033 Strategic Insights

                                                              Discover the booming Turkish agricultural tractor market! This comprehensive analysis reveals a 6.10% CAGR, driven by government support and technological advancements. Explore market trends, segmentation by horsepower (50HP, 75HP, 100HP, 200HP+), key players, and growth projections to 2033. Invest wisely in this expanding sector!

                                                              July 2025
                                                              Base Year: 2024
                                                              No Of Pages: 197
                                                              Price: $3800

                                                              North America Herbicide Market Insightful Analysis: Trends, Competitor Dynamics, and Opportunities 2025-2033

                                                              Discover the surging North American herbicide market, projected to reach $XX million by 2033 with a 4.34% CAGR. This in-depth analysis explores key drivers, trends, restraints, and competitive landscapes, covering chemigation, foliar application, crop types, and leading companies like FMC and Bayer. Gain insights into regional market shares and future growth projections.

                                                              July 2025
                                                              Base Year: 2024
                                                              No Of Pages: 180
                                                              Price: $3800

                                                              Vietnam Agro Machinery Market Insights: Growth at XX CAGR Through 2033

                                                              Discover the booming Vietnam agro-machinery market, projected to reach [estimated value] by 2033 with a CAGR of 11.50%. This in-depth analysis explores market drivers, trends, restraints, key players (Yanmar, Kubota, VEAM), and segment insights (tractors, rice transplanters, harvesting machinery). Learn about investment opportunities and future growth potential.

                                                              July 2025
                                                              Base Year: 2024
                                                              No Of Pages: 150
                                                              Price: $3800

                                                              Exploring Key Dynamics of Honey Industry Industry

                                                              Discover the booming honey market! This comprehensive analysis reveals a $11.08B industry with a 5.20% CAGR, exploring key drivers, trends, regional insights (North America, Europe, Asia-Pacific), and leading brands like Dabur Honey and Patanjali Ayurved. Learn about raw honey, organic honey, Manuka honey, and more. Get your free market research now!

                                                              July 2025
                                                              Base Year: 2024
                                                              No Of Pages: 234
                                                              Price: $4750

                                                              Emerging Market Insights in Cotton Trade Analysis Market: 2025-2033 Overview

                                                              Discover the latest insights into the booming global cotton trade market. This comprehensive analysis reveals a $60B market (2025) projected to grow at a 4.5% CAGR through 2033, driven by textile industry growth and sustainable cotton demand. Explore key trends, restraints, and regional market shares.

                                                              July 2025
                                                              Base Year: 2024
                                                              No Of Pages: 150
                                                              Price: $4750

                                                              Asia-pacific Tomato Seed Market Projected to Grow at XX CAGR: Insights and Forecasts 2025-2033

                                                              The Asia-Pacific tomato seed market is booming, driven by rising demand and advancements in breeding technology. Discover key market trends, growth projections (2025-2033), major players, and regional insights in this comprehensive market analysis.

                                                              July 2025
                                                              Base Year: 2024
                                                              No Of Pages: 180
                                                              Price: $3800

                                                              Uganda Agriculture Industry Market Strategies for the Next Decade: 2025-2033

                                                              Discover the booming Ugandan agriculture industry! Explore market size ($4.07B in 2025), 4.20% CAGR growth projections to 2033, key players, and regional trends in cereals, oilseeds, fruits, and vegetables. Invest in Uganda's agricultural future.

                                                              July 2025
                                                              Base Year: 2024
                                                              No Of Pages: 150
                                                              Price: $3800

                                                              Artichokes Industry: Harnessing Emerging Innovations for Growth 2025-2033

                                                              Discover the booming artichoke market! Explore key trends, regional analysis, and leading companies driving growth in this $XX million industry projected to reach [estimated 2033 value] by 2033. Learn about the rising demand for fresh, canned, frozen, and marinated artichokes in the food service, household, and industrial sectors.

                                                              July 2025
                                                              Base Year: 2024
                                                              No Of Pages: 197
                                                              Price: $3800

                                                              Agricultural Inoculants Market Growth Opportunities and Market Forecast 2025-2033: A Strategic Analysis

                                                              Discover the booming agricultural inoculants market! Our comprehensive analysis reveals a CAGR of 10.50%, driven by sustainable farming trends and rising food demands. Explore market size, segmentation, key players (Bioceres, Novozymes, BASF), and regional insights for 2025-2033. Learn how bio-based solutions are revolutionizing agriculture.

                                                              July 2025
                                                              Base Year: 2024
                                                              No Of Pages: 150
                                                              Price: $4750

                                                              US Farm Equipment Industry Market’s Role in Emerging Tech: Insights and Projections 2025-2033

                                                              The US farm equipment market is booming, projected to reach [estimated 2033 value] by 2033, driven by precision agriculture, government initiatives, and rising demand. Explore market trends, key players (John Deere, Kubota, AGCO), and regional insights in this comprehensive analysis.

                                                              July 2025
                                                              Base Year: 2024
                                                              No Of Pages: 150
                                                              Price: $3800

                                                              Tanzania Fruits and Vegetables Industry Market Demand and Consumption Trends: Outlook 2025-2033

                                                              Discover the booming Tanzanian fruits and vegetables market! This comprehensive report reveals a $2.17B market in 2025, projected to grow at a 6.5% CAGR until 2033. Explore key trends, challenges, and opportunities in production, consumption, import/export, and regional analysis. Invest wisely with our detailed insights.

                                                              July 2025
                                                              Base Year: 2024
                                                              No Of Pages: 197
                                                              Price: $3800

                                                              Technological Advances in Hybrid Soybean Seeds Market Market: Trends and Opportunities 2025-2033

                                                              The booming hybrid soybean seeds market, projected to reach $X Billion by 2025 and growing at a CAGR of 10.20%, is analyzed in this comprehensive report. Discover key drivers, trends, and restraints shaping this dynamic sector, along with leading companies and regional market shares. Explore the potential of hybrid soybean seeds for increased yields and disease resistance.

                                                              July 2025
                                                              Base Year: 2024
                                                              No Of Pages: 197
                                                              Price: $3800

                                                              Farming Robots and Mechatronics Industry Market Disruption Trends and Insights

                                                              The farming robots and mechatronics market is booming, with a 20.40% CAGR. Discover key trends, market segments (autonomous tractors, UAVs, milking robots), leading companies, and regional growth projections for this rapidly expanding sector. Learn how automation is transforming agriculture and optimizing efficiency for sustainable farming practices.

                                                              July 2025
                                                              Base Year: 2024
                                                              No Of Pages: 197
                                                              Price: $3800

                                                              Europe Quinoa Seed Market Industry’s Growth Dynamics and Insights

                                                              Discover the booming European quinoa seed market! Explore key growth drivers, market trends, and competitive landscape analysis. Learn about leading companies and regional market shares in this comprehensive report covering the period 2019-2033. Projected CAGR of 5.20% indicates significant investment potential.

                                                              July 2025
                                                              Base Year: 2024
                                                              No Of Pages: 180
                                                              Price: $4750
                                                              • Home
                                                              • About Us
                                                              • Industries
                                                                • Aerospace & Defense
                                                                • Agriculture
                                                                • Animal Nutrition & Wellness
                                                                • Automotive
                                                                • Chemicals & Materials
                                                                • Consumer Goods and Services
                                                                • Energy & Power
                                                                • Financial Services and Investment Intelligence
                                                                • Food & Beverage
                                                                • Home and Property Improvement
                                                                • Hospitality and Tourism
                                                                • Logistics
                                                                • Manufacturing Products and Services
                                                                • Packaging
                                                                • Professional and Commercial Services
                                                                • Real Estate and Construction
                                                                • Retail
                                                                • Technology, Media and Telecom
                                                                • Healthcare
                                                              • Services
                                                              • Contact
                                                              Main Logo
                                                              • Home
                                                              • About Us
                                                              • Industries
                                                                • Aerospace & Defense
                                                                • Agriculture
                                                                • Animal Nutrition & Wellness
                                                                • Automotive
                                                                • Chemicals & Materials
                                                                • Consumer Goods and Services
                                                                • Energy & Power
                                                                • Financial Services and Investment Intelligence
                                                                • Food & Beverage
                                                                • Home and Property Improvement
                                                                • Hospitality and Tourism
                                                                • Logistics
                                                                • Manufacturing Products and Services
                                                                • Packaging
                                                                • Professional and Commercial Services
                                                                • Real Estate and Construction
                                                                • Retail
                                                                • Technology, Media and Telecom
                                                                • Healthcare
                                                              • Services
                                                              • Contact
                                                              +17162654855
                                                              [email protected]

                                                              +17162654855

                                                              [email protected]

                                                              Business Address

                                                              Head Office

                                                              Office no. A 5010, fifth floor, Solitaire Business Hub, Near Phoenix mall, Pune, Maharashtra 411014

                                                              Contact Information

                                                              Craig Francis

                                                              Business Development Head

                                                              +17162654855

                                                              [email protected]

                                                              Connect With Us

                                                              Secure Payment Partners

                                                              payment image
                                                              RetailLogisticsPackagingAutomotiveHealthcareAgricultureEnergy & PowerFood & BeverageAerospace & DefenseChemicals & MaterialsHospitality and TourismAnimal Nutrition & WellnessConsumer Goods and ServicesReal Estate and ConstructionHome and Property ImprovementTechnology, Media and TelecomManufacturing Products and ServicesFinancial Services and Investment Intelligence

                                                              © 2025 All rights reserved


                                                              Privacy Policy
                                                              Terms and Conditions
                                                              FAQ