Demand Patterns in Dragon Fruit Industry Market: Projections to 2033

Dragon Fruit Industry by Production Analysis, by Consumption Analysis, by Import Market Analysis (Value & Volume), by Export Market Analysis (Value & Volume), by Price Trend Analysis, by North America (United States, Canada, Mexico), by Europe (Germany, UK, France, Netherlands), by Asia Pacific (China, Vietnam, Cambodia, India, Thailand, Indonesia), by South America (Brazil, Columbia, Argentina), by Middle East and Africa (South Africa, Israel, Egypt) Forecast 2025-2033

Jun 27 2025
Base Year: 2024

234 Pages
Main Logo

Demand Patterns in Dragon Fruit Industry Market: Projections to 2033


Home
Industries
Agriculture
sponsor image

Tailored for you

  • In-depth Analysis Tailored to Specified Regions or Segments
  • Company Profiles Customized to User Preferences
  • Comprehensive Insights Focused on Specific Segments or Regions
  • Customized Evaluation of Competitive Landscape to Meet Your Needs
  • Tailored Customization to Address Other Specific Requirements
Ask for customization


Key Insights

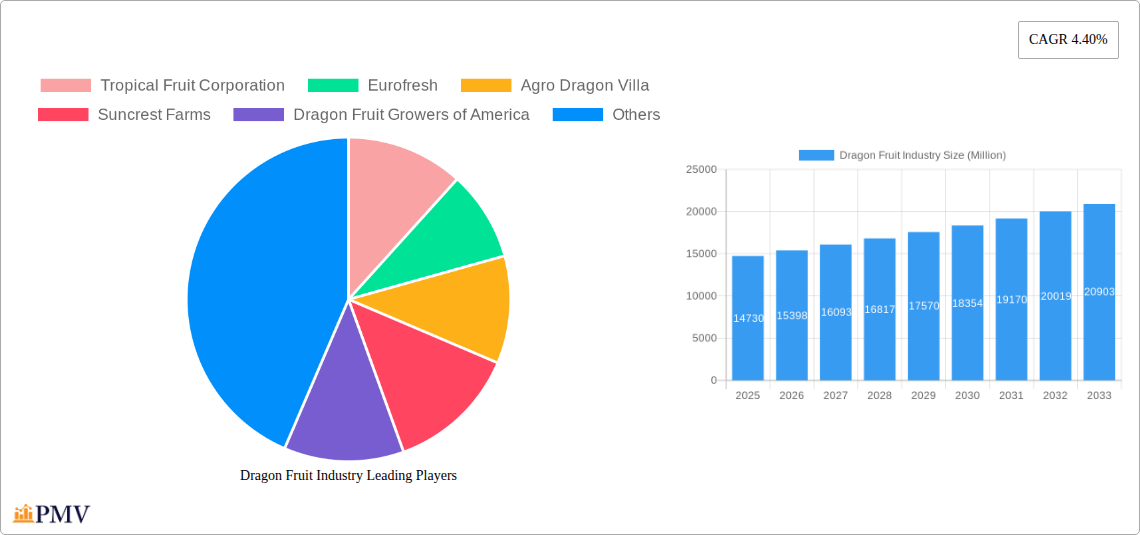
The global dragon fruit market, valued at $14.73 billion in 2025, is projected to experience robust growth, driven by increasing consumer demand for exotic fruits, health-conscious eating habits, and rising awareness of the fruit's nutritional benefits. The compound annual growth rate (CAGR) of 4.40% from 2025 to 2033 indicates a significant expansion of this market over the forecast period. Key drivers include the rising popularity of dragon fruit in various food and beverage applications, including fresh consumption, processed foods, and beverages. The growing adoption of natural colorants derived from dragon fruit further boosts market growth, as manufacturers seek natural alternatives to synthetic food colorings. The market segmentation reveals a strong presence across retail, foodservice, and industrial end-users, with both offline and online distribution channels contributing to market reach. While challenges such as seasonal availability and the need for efficient post-harvest handling exist, the market's growth trajectory remains positive, fueled by continuous product innovation and expanding distribution networks.

The North American region, particularly the United States, is expected to hold a significant market share, owing to high consumer spending and the increasing accessibility of exotic fruits. However, the Asia-Pacific region, especially Southeast Asia, is poised for rapid growth due to the dragon fruit's indigenous nature and the region's growing middle class with increasing disposable income. Major players such as Tropical Fruit Corporation, Eurofresh, and others are strategically investing in research and development, expanding their production capabilities, and exploring new markets to capitalize on the burgeoning demand. The market's future depends on overcoming challenges related to sustainable farming practices and ensuring consistent product quality to meet growing global demand. A focus on building robust supply chains and further diversifying product applications will be crucial for sustained market expansion in the coming years.

Dragon Fruit Industry Research Report - Market Size, Growth & Forecast

Dragon Fruit Industry: A Comprehensive Market Analysis & Forecast (2019-2033)

This comprehensive report provides an in-depth analysis of the global dragon fruit industry, offering valuable insights for businesses, investors, and stakeholders. The study covers the period from 2019 to 2033, with a focus on the estimated year 2025 and a forecast period from 2025 to 2033. The report leverages extensive primary and secondary research to deliver actionable intelligence, examining market size, segmentation, competitive dynamics, and future growth potential. The global dragon fruit market is projected to reach xx Million by 2033, exhibiting a CAGR of xx% during the forecast period.

Dragon Fruit Industry Market Structure & Competitive Dynamics

The global dragon fruit market is characterized by a moderately fragmented structure, with several key players competing for market share. Major players like Tropical Fruit Corporation, Eurofresh, Agro Dragon Villa, Suncrest Farms, Dragon Fruit Growers of America, Miami Fruit, and Fruit Lovers contribute significantly to the overall market volume. Market concentration is relatively low, with no single company dominating the landscape. However, larger players often benefit from economies of scale in production and distribution.

Innovation ecosystems are dynamic, driven by advancements in cultivation techniques, processing technologies, and packaging solutions. Regulatory frameworks vary across regions, impacting production and trade. Product substitutes, such as other exotic fruits, pose some competitive pressure, while the increasing health consciousness among consumers fuels demand for dragon fruit. Mergers and acquisitions (M&A) activity has been moderate in the recent past, with deal values ranging from xx Million to xx Million.

  • Market Share (Estimated 2025): Tropical Fruit Corporation (xx%), Eurofresh (xx%), Agro Dragon Villa (xx%), Others (xx%).
  • Recent M&A Activity: While specific deal values are not publicly available for all transactions, analysis suggests a rise in smaller-scale acquisitions focused on expanding regional reach and product lines.

Dragon Fruit Industry Industry Trends & Insights

The dragon fruit industry is experiencing robust growth, driven by factors such as increasing consumer awareness of its nutritional benefits, rising demand for exotic fruits, and expansion into new markets. Technological advancements in cultivation practices have improved yields and quality, further fueling market expansion. Consumer preferences are shifting towards convenient, ready-to-consume products, driving innovation in processed foods and beverages. The market's competitive landscape is dynamic, with companies investing in brand building, product diversification, and sustainable sourcing practices. The industry faces challenges related to seasonality, perishability, and price fluctuations.

The CAGR for the period 2025-2033 is projected at xx%, indicating substantial growth potential. Market penetration in key regions remains relatively low, presenting opportunities for expansion. The increasing adoption of online sales channels is also a key trend reshaping distribution.

Dragon Fruit Industry Growth

Dominant Markets & Segments in Dragon Fruit Industry

The Asia-Pacific region dominates the global dragon fruit market, driven by strong domestic consumption, favorable climatic conditions, and extensive cultivation. Within this region, countries like Vietnam and Thailand are major producers and exporters. Other key regions include Southeast Asia and parts of South America. The fresh consumption segment is currently the largest, however, processed food products (like jams, dried slices, and powders), beverages, and natural colorants are rapidly gaining traction. The retail channel remains dominant, although foodservice and industrial applications are witnessing steady growth, particularly for processed products.

  • Key Drivers of Regional Dominance:
    • Asia-Pacific: Favorable climate, established cultivation practices, large consumer base, and government support.
    • Fresh Consumption Segment: Growing consumer preference for healthy and exotic fruits, increasing availability in supermarkets, and rising disposable incomes.

Dragon Fruit Industry Product Innovations

Recent product innovations focus on expanding dragon fruit's applications beyond fresh consumption. This includes the development of convenient ready-to-eat products, functional beverages enriched with dragon fruit extracts, and the use of dragon fruit as a natural colorant in food and beverage manufacturing. Technological advancements in processing and preservation techniques are enhancing the shelf life and quality of processed dragon fruit products, improving market acceptance. New product launches are targeting specific consumer segments, catering to diverse preferences and health needs.

Report Segmentation & Scope

This report provides detailed segmentation of the dragon fruit market across product types (Fresh Consumption, Processed Food Products, Beverages, Natural Colorants), end-users (Retail, Foodservice, Industrial), and distribution channels (Offline, Online). Each segment's growth projections, market sizes, and competitive dynamics are analyzed, providing a granular view of the industry's structure and growth potential. For example, the processed food products segment is projected to experience robust growth due to rising demand for convenient and value-added products.

Key Drivers of Dragon Fruit Industry Growth

Several factors are driving the growth of the dragon fruit industry. These include increasing consumer awareness of its health benefits (rich in antioxidants and vitamins), rising demand for exotic fruits, technological advancements improving cultivation and processing, and expanding distribution networks. Government initiatives promoting agricultural development and export in several key producing regions also contribute to the positive growth outlook.

Challenges in the Dragon Fruit Industry Sector

The dragon fruit industry faces several challenges including seasonality and perishability of the fresh fruit, leading to supply chain inefficiencies and post-harvest losses (estimated at xx Million annually). Price fluctuations due to variations in supply and demand also pose a risk. Competition from other exotic fruits and regulatory hurdles in different markets can also impede growth.

Leading Players in the Dragon Fruit Industry Market

  • Tropical Fruit Corporation
  • Eurofresh
  • Agro Dragon Villa
  • Suncrest Farms
  • Dragon Fruit Growers of America
  • Miami Fruit
  • Fruit Lovers

Key Developments in Dragon Fruit Industry Sector

  • 2022: Launch of a new dragon fruit-based beverage line by Eurofresh.
  • 2023: Acquisition of a smaller dragon fruit farm in Vietnam by Tropical Fruit Corporation.
  • 2024: Introduction of innovative packaging solutions to improve the shelf life of fresh dragon fruit by Suncrest Farms.

Strategic Dragon Fruit Industry Market Outlook

The dragon fruit industry holds significant potential for future growth, driven by expanding consumer demand, product diversification, and advancements in cultivation and processing technologies. Strategic opportunities lie in developing value-added products, expanding into new markets, and investing in sustainable farming practices. Companies focusing on innovation, brand building, and efficient supply chain management are poised to achieve greater market success.

Dragon Fruit Industry Segmentation

  • 1. Production Analysis
  • 2. Consumption Analysis
  • 3. Import Market Analysis (Value & Volume)
  • 4. Export Market Analysis (Value & Volume)
  • 5. Price Trend Analysis

Dragon Fruit Industry Segmentation By Geography

  • 1. North America
    • 1.1. United States
    • 1.2. Canada
    • 1.3. Mexico
  • 2. Europe
    • 2.1. Germany
    • 2.2. UK
    • 2.3. France
    • 2.4. Netherlands
  • 3. Asia Pacific
    • 3.1. China
    • 3.2. Vietnam
    • 3.3. Cambodia
    • 3.4. India
    • 3.5. Thailand
    • 3.6. Indonesia
  • 4. South America
    • 4.1. Brazil
    • 4.2. Columbia
    • 4.3. Argentina
  • 5. Middle East and Africa
    • 5.1. South Africa
    • 5.2. Israel
    • 5.3. Egypt
Dragon Fruit Industry Regional Share


Dragon Fruit Industry REPORT HIGHLIGHTS

AspectsDetails
Study Period 2019-2033
Base Year 2024
Estimated Year 2025
Forecast Period2025-2033
Historical Period2019-2024
Growth RateCAGR of 4.40% from 2019-2033
Segmentation
    • By Production Analysis
    • By Consumption Analysis
    • By Import Market Analysis (Value & Volume)
    • By Export Market Analysis (Value & Volume)
    • By Price Trend Analysis
  • By Geography
    • North America
      • United States
      • Canada
      • Mexico
    • Europe
      • Germany
      • UK
      • France
      • Netherlands
    • Asia Pacific
      • China
      • Vietnam
      • Cambodia
      • India
      • Thailand
      • Indonesia
    • South America
      • Brazil
      • Columbia
      • Argentina
    • Middle East and Africa
      • South Africa
      • Israel
      • Egypt


Table of Contents

  1. 1. Introduction
    • 1.1. Research Scope
    • 1.2. Market Segmentation
    • 1.3. Research Methodology
    • 1.4. Definitions and Assumptions
  2. 2. Executive Summary
    • 2.1. Introduction
  3. 3. Market Dynamics
    • 3.1. Introduction
      • 3.2. Market Drivers
        • 3.2.1. Increasing Demand for Garlic Due to Various Uses in Industries; Rising Demad of Organic Garlic; Increasing Government Initiatives
      • 3.3. Market Restrains
        • 3.3.1. Lack of Technical Knowledge of Farmers; Price Fluctuations
      • 3.4. Market Trends
        • 3.4.1. Growing Demand for Dragon Fruit in China
  4. 4. Market Factor Analysis
    • 4.1. Porters Five Forces
    • 4.2. Supply/Value Chain
    • 4.3. PESTEL analysis
    • 4.4. Market Entropy
    • 4.5. Patent/Trademark Analysis
  5. 5. Global Dragon Fruit Industry Analysis, Insights and Forecast, 2019-2031
    • 5.1. Market Analysis, Insights and Forecast - by Production Analysis
      • 5.2. Market Analysis, Insights and Forecast - by Consumption Analysis
        • 5.3. Market Analysis, Insights and Forecast - by Import Market Analysis (Value & Volume)
          • 5.4. Market Analysis, Insights and Forecast - by Export Market Analysis (Value & Volume)
            • 5.5. Market Analysis, Insights and Forecast - by Price Trend Analysis
              • 5.6. Market Analysis, Insights and Forecast - by Region
                • 5.6.1. North America
                • 5.6.2. Europe
                • 5.6.3. Asia Pacific
                • 5.6.4. South America
                • 5.6.5. Middle East and Africa
            • 6. North America Dragon Fruit Industry Analysis, Insights and Forecast, 2019-2031
              • 6.1. Market Analysis, Insights and Forecast - by Production Analysis
                • 6.2. Market Analysis, Insights and Forecast - by Consumption Analysis
                  • 6.3. Market Analysis, Insights and Forecast - by Import Market Analysis (Value & Volume)
                    • 6.4. Market Analysis, Insights and Forecast - by Export Market Analysis (Value & Volume)
                      • 6.5. Market Analysis, Insights and Forecast - by Price Trend Analysis
                      • 7. Europe Dragon Fruit Industry Analysis, Insights and Forecast, 2019-2031
                        • 7.1. Market Analysis, Insights and Forecast - by Production Analysis
                          • 7.2. Market Analysis, Insights and Forecast - by Consumption Analysis
                            • 7.3. Market Analysis, Insights and Forecast - by Import Market Analysis (Value & Volume)
                              • 7.4. Market Analysis, Insights and Forecast - by Export Market Analysis (Value & Volume)
                                • 7.5. Market Analysis, Insights and Forecast - by Price Trend Analysis
                                • 8. Asia Pacific Dragon Fruit Industry Analysis, Insights and Forecast, 2019-2031
                                  • 8.1. Market Analysis, Insights and Forecast - by Production Analysis
                                    • 8.2. Market Analysis, Insights and Forecast - by Consumption Analysis
                                      • 8.3. Market Analysis, Insights and Forecast - by Import Market Analysis (Value & Volume)
                                        • 8.4. Market Analysis, Insights and Forecast - by Export Market Analysis (Value & Volume)
                                          • 8.5. Market Analysis, Insights and Forecast - by Price Trend Analysis
                                          • 9. South America Dragon Fruit Industry Analysis, Insights and Forecast, 2019-2031
                                            • 9.1. Market Analysis, Insights and Forecast - by Production Analysis
                                              • 9.2. Market Analysis, Insights and Forecast - by Consumption Analysis
                                                • 9.3. Market Analysis, Insights and Forecast - by Import Market Analysis (Value & Volume)
                                                  • 9.4. Market Analysis, Insights and Forecast - by Export Market Analysis (Value & Volume)
                                                    • 9.5. Market Analysis, Insights and Forecast - by Price Trend Analysis
                                                    • 10. Middle East and Africa Dragon Fruit Industry Analysis, Insights and Forecast, 2019-2031
                                                      • 10.1. Market Analysis, Insights and Forecast - by Production Analysis
                                                        • 10.2. Market Analysis, Insights and Forecast - by Consumption Analysis
                                                          • 10.3. Market Analysis, Insights and Forecast - by Import Market Analysis (Value & Volume)
                                                            • 10.4. Market Analysis, Insights and Forecast - by Export Market Analysis (Value & Volume)
                                                              • 10.5. Market Analysis, Insights and Forecast - by Price Trend Analysis
                                                              • 11. North America Dragon Fruit Industry Analysis, Insights and Forecast, 2019-2031
                                                                  • 11.1. Market Analysis, Insights and Forecast - By Country/Sub-region
                                                                    • 11.1.1 United States
                                                                    • 11.1.2 Canada
                                                                    • 11.1.3 Mexico
                                                              • 12. Europe Dragon Fruit Industry Analysis, Insights and Forecast, 2019-2031
                                                                  • 12.1. Market Analysis, Insights and Forecast - By Country/Sub-region
                                                                    • 12.1.1 Germany
                                                                    • 12.1.2 United Kingdom
                                                                    • 12.1.3 France
                                                                    • 12.1.4 Spain
                                                                    • 12.1.5 Italy
                                                                    • 12.1.6 Spain
                                                                    • 12.1.7 Belgium
                                                                    • 12.1.8 Netherland
                                                                    • 12.1.9 Nordics
                                                                    • 12.1.10 Rest of Europe
                                                              • 13. Asia Pacific Dragon Fruit Industry Analysis, Insights and Forecast, 2019-2031
                                                                  • 13.1. Market Analysis, Insights and Forecast - By Country/Sub-region
                                                                    • 13.1.1 China
                                                                    • 13.1.2 Japan
                                                                    • 13.1.3 India
                                                                    • 13.1.4 South Korea
                                                                    • 13.1.5 Southeast Asia
                                                                    • 13.1.6 Australia
                                                                    • 13.1.7 Indonesia
                                                                    • 13.1.8 Phillipes
                                                                    • 13.1.9 Singapore
                                                                    • 13.1.10 Thailandc
                                                                    • 13.1.11 Rest of Asia Pacific
                                                              • 14. South America Dragon Fruit Industry Analysis, Insights and Forecast, 2019-2031
                                                                  • 14.1. Market Analysis, Insights and Forecast - By Country/Sub-region
                                                                    • 14.1.1 Brazil
                                                                    • 14.1.2 Argentina
                                                                    • 14.1.3 Peru
                                                                    • 14.1.4 Chile
                                                                    • 14.1.5 Colombia
                                                                    • 14.1.6 Ecuador
                                                                    • 14.1.7 Venezuela
                                                                    • 14.1.8 Rest of South America
                                                              • 15. MEA Dragon Fruit Industry Analysis, Insights and Forecast, 2019-2031
                                                                  • 15.1. Market Analysis, Insights and Forecast - By Country/Sub-region
                                                                    • 15.1.1 United Arab Emirates
                                                                    • 15.1.2 Saudi Arabia
                                                                    • 15.1.3 South Africa
                                                                    • 15.1.4 Rest of Middle East and Africa
                                                              • 16. Competitive Analysis
                                                                • 16.1. Global Market Share Analysis 2024
                                                                  • 16.2. Company Profiles
                                                                    • 16.2.1 Tropical Fruit Corporation
                                                                      • 16.2.1.1. Overview
                                                                      • 16.2.1.2. Products
                                                                      • 16.2.1.3. SWOT Analysis
                                                                      • 16.2.1.4. Recent Developments
                                                                      • 16.2.1.5. Financials (Based on Availability)
                                                                    • 16.2.2 Eurofresh
                                                                      • 16.2.2.1. Overview
                                                                      • 16.2.2.2. Products
                                                                      • 16.2.2.3. SWOT Analysis
                                                                      • 16.2.2.4. Recent Developments
                                                                      • 16.2.2.5. Financials (Based on Availability)
                                                                    • 16.2.3 Agro Dragon Villa
                                                                      • 16.2.3.1. Overview
                                                                      • 16.2.3.2. Products
                                                                      • 16.2.3.3. SWOT Analysis
                                                                      • 16.2.3.4. Recent Developments
                                                                      • 16.2.3.5. Financials (Based on Availability)
                                                                    • 16.2.4 Suncrest Farms
                                                                      • 16.2.4.1. Overview
                                                                      • 16.2.4.2. Products
                                                                      • 16.2.4.3. SWOT Analysis
                                                                      • 16.2.4.4. Recent Developments
                                                                      • 16.2.4.5. Financials (Based on Availability)
                                                                    • 16.2.5 Dragon Fruit Growers of America
                                                                      • 16.2.5.1. Overview
                                                                      • 16.2.5.2. Products
                                                                      • 16.2.5.3. SWOT Analysis
                                                                      • 16.2.5.4. Recent Developments
                                                                      • 16.2.5.5. Financials (Based on Availability)
                                                                    • 16.2.6 Miami Fruit
                                                                      • 16.2.6.1. Overview
                                                                      • 16.2.6.2. Products
                                                                      • 16.2.6.3. SWOT Analysis
                                                                      • 16.2.6.4. Recent Developments
                                                                      • 16.2.6.5. Financials (Based on Availability)
                                                                    • 16.2.7 Fruit Lovers
                                                                      • 16.2.7.1. Overview
                                                                      • 16.2.7.2. Products
                                                                      • 16.2.7.3. SWOT Analysis
                                                                      • 16.2.7.4. Recent Developments
                                                                      • 16.2.7.5. Financials (Based on Availability)

                                                              List of Figures

                                                              1. Figure 1: Global Dragon Fruit Industry Revenue Breakdown (Million, %) by Region 2024 & 2032
                                                              2. Figure 2: North America Dragon Fruit Industry Revenue (Million), by Country 2024 & 2032
                                                              3. Figure 3: North America Dragon Fruit Industry Revenue Share (%), by Country 2024 & 2032
                                                              4. Figure 4: Europe Dragon Fruit Industry Revenue (Million), by Country 2024 & 2032
                                                              5. Figure 5: Europe Dragon Fruit Industry Revenue Share (%), by Country 2024 & 2032
                                                              6. Figure 6: Asia Pacific Dragon Fruit Industry Revenue (Million), by Country 2024 & 2032
                                                              7. Figure 7: Asia Pacific Dragon Fruit Industry Revenue Share (%), by Country 2024 & 2032
                                                              8. Figure 8: South America Dragon Fruit Industry Revenue (Million), by Country 2024 & 2032
                                                              9. Figure 9: South America Dragon Fruit Industry Revenue Share (%), by Country 2024 & 2032
                                                              10. Figure 10: MEA Dragon Fruit Industry Revenue (Million), by Country 2024 & 2032
                                                              11. Figure 11: MEA Dragon Fruit Industry Revenue Share (%), by Country 2024 & 2032
                                                              12. Figure 12: North America Dragon Fruit Industry Revenue (Million), by Production Analysis 2024 & 2032
                                                              13. Figure 13: North America Dragon Fruit Industry Revenue Share (%), by Production Analysis 2024 & 2032
                                                              14. Figure 14: North America Dragon Fruit Industry Revenue (Million), by Consumption Analysis 2024 & 2032
                                                              15. Figure 15: North America Dragon Fruit Industry Revenue Share (%), by Consumption Analysis 2024 & 2032
                                                              16. Figure 16: North America Dragon Fruit Industry Revenue (Million), by Import Market Analysis (Value & Volume) 2024 & 2032
                                                              17. Figure 17: North America Dragon Fruit Industry Revenue Share (%), by Import Market Analysis (Value & Volume) 2024 & 2032
                                                              18. Figure 18: North America Dragon Fruit Industry Revenue (Million), by Export Market Analysis (Value & Volume) 2024 & 2032
                                                              19. Figure 19: North America Dragon Fruit Industry Revenue Share (%), by Export Market Analysis (Value & Volume) 2024 & 2032
                                                              20. Figure 20: North America Dragon Fruit Industry Revenue (Million), by Price Trend Analysis 2024 & 2032
                                                              21. Figure 21: North America Dragon Fruit Industry Revenue Share (%), by Price Trend Analysis 2024 & 2032
                                                              22. Figure 22: North America Dragon Fruit Industry Revenue (Million), by Country 2024 & 2032
                                                              23. Figure 23: North America Dragon Fruit Industry Revenue Share (%), by Country 2024 & 2032
                                                              24. Figure 24: Europe Dragon Fruit Industry Revenue (Million), by Production Analysis 2024 & 2032
                                                              25. Figure 25: Europe Dragon Fruit Industry Revenue Share (%), by Production Analysis 2024 & 2032
                                                              26. Figure 26: Europe Dragon Fruit Industry Revenue (Million), by Consumption Analysis 2024 & 2032
                                                              27. Figure 27: Europe Dragon Fruit Industry Revenue Share (%), by Consumption Analysis 2024 & 2032
                                                              28. Figure 28: Europe Dragon Fruit Industry Revenue (Million), by Import Market Analysis (Value & Volume) 2024 & 2032
                                                              29. Figure 29: Europe Dragon Fruit Industry Revenue Share (%), by Import Market Analysis (Value & Volume) 2024 & 2032
                                                              30. Figure 30: Europe Dragon Fruit Industry Revenue (Million), by Export Market Analysis (Value & Volume) 2024 & 2032
                                                              31. Figure 31: Europe Dragon Fruit Industry Revenue Share (%), by Export Market Analysis (Value & Volume) 2024 & 2032
                                                              32. Figure 32: Europe Dragon Fruit Industry Revenue (Million), by Price Trend Analysis 2024 & 2032
                                                              33. Figure 33: Europe Dragon Fruit Industry Revenue Share (%), by Price Trend Analysis 2024 & 2032
                                                              34. Figure 34: Europe Dragon Fruit Industry Revenue (Million), by Country 2024 & 2032
                                                              35. Figure 35: Europe Dragon Fruit Industry Revenue Share (%), by Country 2024 & 2032
                                                              36. Figure 36: Asia Pacific Dragon Fruit Industry Revenue (Million), by Production Analysis 2024 & 2032
                                                              37. Figure 37: Asia Pacific Dragon Fruit Industry Revenue Share (%), by Production Analysis 2024 & 2032
                                                              38. Figure 38: Asia Pacific Dragon Fruit Industry Revenue (Million), by Consumption Analysis 2024 & 2032
                                                              39. Figure 39: Asia Pacific Dragon Fruit Industry Revenue Share (%), by Consumption Analysis 2024 & 2032
                                                              40. Figure 40: Asia Pacific Dragon Fruit Industry Revenue (Million), by Import Market Analysis (Value & Volume) 2024 & 2032
                                                              41. Figure 41: Asia Pacific Dragon Fruit Industry Revenue Share (%), by Import Market Analysis (Value & Volume) 2024 & 2032
                                                              42. Figure 42: Asia Pacific Dragon Fruit Industry Revenue (Million), by Export Market Analysis (Value & Volume) 2024 & 2032
                                                              43. Figure 43: Asia Pacific Dragon Fruit Industry Revenue Share (%), by Export Market Analysis (Value & Volume) 2024 & 2032
                                                              44. Figure 44: Asia Pacific Dragon Fruit Industry Revenue (Million), by Price Trend Analysis 2024 & 2032
                                                              45. Figure 45: Asia Pacific Dragon Fruit Industry Revenue Share (%), by Price Trend Analysis 2024 & 2032
                                                              46. Figure 46: Asia Pacific Dragon Fruit Industry Revenue (Million), by Country 2024 & 2032
                                                              47. Figure 47: Asia Pacific Dragon Fruit Industry Revenue Share (%), by Country 2024 & 2032
                                                              48. Figure 48: South America Dragon Fruit Industry Revenue (Million), by Production Analysis 2024 & 2032
                                                              49. Figure 49: South America Dragon Fruit Industry Revenue Share (%), by Production Analysis 2024 & 2032
                                                              50. Figure 50: South America Dragon Fruit Industry Revenue (Million), by Consumption Analysis 2024 & 2032
                                                              51. Figure 51: South America Dragon Fruit Industry Revenue Share (%), by Consumption Analysis 2024 & 2032
                                                              52. Figure 52: South America Dragon Fruit Industry Revenue (Million), by Import Market Analysis (Value & Volume) 2024 & 2032
                                                              53. Figure 53: South America Dragon Fruit Industry Revenue Share (%), by Import Market Analysis (Value & Volume) 2024 & 2032
                                                              54. Figure 54: South America Dragon Fruit Industry Revenue (Million), by Export Market Analysis (Value & Volume) 2024 & 2032
                                                              55. Figure 55: South America Dragon Fruit Industry Revenue Share (%), by Export Market Analysis (Value & Volume) 2024 & 2032
                                                              56. Figure 56: South America Dragon Fruit Industry Revenue (Million), by Price Trend Analysis 2024 & 2032
                                                              57. Figure 57: South America Dragon Fruit Industry Revenue Share (%), by Price Trend Analysis 2024 & 2032
                                                              58. Figure 58: South America Dragon Fruit Industry Revenue (Million), by Country 2024 & 2032
                                                              59. Figure 59: South America Dragon Fruit Industry Revenue Share (%), by Country 2024 & 2032
                                                              60. Figure 60: Middle East and Africa Dragon Fruit Industry Revenue (Million), by Production Analysis 2024 & 2032
                                                              61. Figure 61: Middle East and Africa Dragon Fruit Industry Revenue Share (%), by Production Analysis 2024 & 2032
                                                              62. Figure 62: Middle East and Africa Dragon Fruit Industry Revenue (Million), by Consumption Analysis 2024 & 2032
                                                              63. Figure 63: Middle East and Africa Dragon Fruit Industry Revenue Share (%), by Consumption Analysis 2024 & 2032
                                                              64. Figure 64: Middle East and Africa Dragon Fruit Industry Revenue (Million), by Import Market Analysis (Value & Volume) 2024 & 2032
                                                              65. Figure 65: Middle East and Africa Dragon Fruit Industry Revenue Share (%), by Import Market Analysis (Value & Volume) 2024 & 2032
                                                              66. Figure 66: Middle East and Africa Dragon Fruit Industry Revenue (Million), by Export Market Analysis (Value & Volume) 2024 & 2032
                                                              67. Figure 67: Middle East and Africa Dragon Fruit Industry Revenue Share (%), by Export Market Analysis (Value & Volume) 2024 & 2032
                                                              68. Figure 68: Middle East and Africa Dragon Fruit Industry Revenue (Million), by Price Trend Analysis 2024 & 2032
                                                              69. Figure 69: Middle East and Africa Dragon Fruit Industry Revenue Share (%), by Price Trend Analysis 2024 & 2032
                                                              70. Figure 70: Middle East and Africa Dragon Fruit Industry Revenue (Million), by Country 2024 & 2032
                                                              71. Figure 71: Middle East and Africa Dragon Fruit Industry Revenue Share (%), by Country 2024 & 2032

                                                              List of Tables

                                                              1. Table 1: Global Dragon Fruit Industry Revenue Million Forecast, by Region 2019 & 2032
                                                              2. Table 2: Global Dragon Fruit Industry Revenue Million Forecast, by Production Analysis 2019 & 2032
                                                              3. Table 3: Global Dragon Fruit Industry Revenue Million Forecast, by Consumption Analysis 2019 & 2032
                                                              4. Table 4: Global Dragon Fruit Industry Revenue Million Forecast, by Import Market Analysis (Value & Volume) 2019 & 2032
                                                              5. Table 5: Global Dragon Fruit Industry Revenue Million Forecast, by Export Market Analysis (Value & Volume) 2019 & 2032
                                                              6. Table 6: Global Dragon Fruit Industry Revenue Million Forecast, by Price Trend Analysis 2019 & 2032
                                                              7. Table 7: Global Dragon Fruit Industry Revenue Million Forecast, by Region 2019 & 2032
                                                              8. Table 8: Global Dragon Fruit Industry Revenue Million Forecast, by Country 2019 & 2032
                                                              9. Table 9: United States Dragon Fruit Industry Revenue (Million) Forecast, by Application 2019 & 2032
                                                              10. Table 10: Canada Dragon Fruit Industry Revenue (Million) Forecast, by Application 2019 & 2032
                                                              11. Table 11: Mexico Dragon Fruit Industry Revenue (Million) Forecast, by Application 2019 & 2032
                                                              12. Table 12: Global Dragon Fruit Industry Revenue Million Forecast, by Country 2019 & 2032
                                                              13. Table 13: Germany Dragon Fruit Industry Revenue (Million) Forecast, by Application 2019 & 2032
                                                              14. Table 14: United Kingdom Dragon Fruit Industry Revenue (Million) Forecast, by Application 2019 & 2032
                                                              15. Table 15: France Dragon Fruit Industry Revenue (Million) Forecast, by Application 2019 & 2032
                                                              16. Table 16: Spain Dragon Fruit Industry Revenue (Million) Forecast, by Application 2019 & 2032
                                                              17. Table 17: Italy Dragon Fruit Industry Revenue (Million) Forecast, by Application 2019 & 2032
                                                              18. Table 18: Spain Dragon Fruit Industry Revenue (Million) Forecast, by Application 2019 & 2032
                                                              19. Table 19: Belgium Dragon Fruit Industry Revenue (Million) Forecast, by Application 2019 & 2032
                                                              20. Table 20: Netherland Dragon Fruit Industry Revenue (Million) Forecast, by Application 2019 & 2032
                                                              21. Table 21: Nordics Dragon Fruit Industry Revenue (Million) Forecast, by Application 2019 & 2032
                                                              22. Table 22: Rest of Europe Dragon Fruit Industry Revenue (Million) Forecast, by Application 2019 & 2032
                                                              23. Table 23: Global Dragon Fruit Industry Revenue Million Forecast, by Country 2019 & 2032
                                                              24. Table 24: China Dragon Fruit Industry Revenue (Million) Forecast, by Application 2019 & 2032
                                                              25. Table 25: Japan Dragon Fruit Industry Revenue (Million) Forecast, by Application 2019 & 2032
                                                              26. Table 26: India Dragon Fruit Industry Revenue (Million) Forecast, by Application 2019 & 2032
                                                              27. Table 27: South Korea Dragon Fruit Industry Revenue (Million) Forecast, by Application 2019 & 2032
                                                              28. Table 28: Southeast Asia Dragon Fruit Industry Revenue (Million) Forecast, by Application 2019 & 2032
                                                              29. Table 29: Australia Dragon Fruit Industry Revenue (Million) Forecast, by Application 2019 & 2032
                                                              30. Table 30: Indonesia Dragon Fruit Industry Revenue (Million) Forecast, by Application 2019 & 2032
                                                              31. Table 31: Phillipes Dragon Fruit Industry Revenue (Million) Forecast, by Application 2019 & 2032
                                                              32. Table 32: Singapore Dragon Fruit Industry Revenue (Million) Forecast, by Application 2019 & 2032
                                                              33. Table 33: Thailandc Dragon Fruit Industry Revenue (Million) Forecast, by Application 2019 & 2032
                                                              34. Table 34: Rest of Asia Pacific Dragon Fruit Industry Revenue (Million) Forecast, by Application 2019 & 2032
                                                              35. Table 35: Global Dragon Fruit Industry Revenue Million Forecast, by Country 2019 & 2032
                                                              36. Table 36: Brazil Dragon Fruit Industry Revenue (Million) Forecast, by Application 2019 & 2032
                                                              37. Table 37: Argentina Dragon Fruit Industry Revenue (Million) Forecast, by Application 2019 & 2032
                                                              38. Table 38: Peru Dragon Fruit Industry Revenue (Million) Forecast, by Application 2019 & 2032
                                                              39. Table 39: Chile Dragon Fruit Industry Revenue (Million) Forecast, by Application 2019 & 2032
                                                              40. Table 40: Colombia Dragon Fruit Industry Revenue (Million) Forecast, by Application 2019 & 2032
                                                              41. Table 41: Ecuador Dragon Fruit Industry Revenue (Million) Forecast, by Application 2019 & 2032
                                                              42. Table 42: Venezuela Dragon Fruit Industry Revenue (Million) Forecast, by Application 2019 & 2032
                                                              43. Table 43: Rest of South America Dragon Fruit Industry Revenue (Million) Forecast, by Application 2019 & 2032
                                                              44. Table 44: Global Dragon Fruit Industry Revenue Million Forecast, by Country 2019 & 2032
                                                              45. Table 45: United Arab Emirates Dragon Fruit Industry Revenue (Million) Forecast, by Application 2019 & 2032
                                                              46. Table 46: Saudi Arabia Dragon Fruit Industry Revenue (Million) Forecast, by Application 2019 & 2032
                                                              47. Table 47: South Africa Dragon Fruit Industry Revenue (Million) Forecast, by Application 2019 & 2032
                                                              48. Table 48: Rest of Middle East and Africa Dragon Fruit Industry Revenue (Million) Forecast, by Application 2019 & 2032
                                                              49. Table 49: Global Dragon Fruit Industry Revenue Million Forecast, by Production Analysis 2019 & 2032
                                                              50. Table 50: Global Dragon Fruit Industry Revenue Million Forecast, by Consumption Analysis 2019 & 2032
                                                              51. Table 51: Global Dragon Fruit Industry Revenue Million Forecast, by Import Market Analysis (Value & Volume) 2019 & 2032
                                                              52. Table 52: Global Dragon Fruit Industry Revenue Million Forecast, by Export Market Analysis (Value & Volume) 2019 & 2032
                                                              53. Table 53: Global Dragon Fruit Industry Revenue Million Forecast, by Price Trend Analysis 2019 & 2032
                                                              54. Table 54: Global Dragon Fruit Industry Revenue Million Forecast, by Country 2019 & 2032
                                                              55. Table 55: United States Dragon Fruit Industry Revenue (Million) Forecast, by Application 2019 & 2032
                                                              56. Table 56: Canada Dragon Fruit Industry Revenue (Million) Forecast, by Application 2019 & 2032
                                                              57. Table 57: Mexico Dragon Fruit Industry Revenue (Million) Forecast, by Application 2019 & 2032
                                                              58. Table 58: Global Dragon Fruit Industry Revenue Million Forecast, by Production Analysis 2019 & 2032
                                                              59. Table 59: Global Dragon Fruit Industry Revenue Million Forecast, by Consumption Analysis 2019 & 2032
                                                              60. Table 60: Global Dragon Fruit Industry Revenue Million Forecast, by Import Market Analysis (Value & Volume) 2019 & 2032
                                                              61. Table 61: Global Dragon Fruit Industry Revenue Million Forecast, by Export Market Analysis (Value & Volume) 2019 & 2032
                                                              62. Table 62: Global Dragon Fruit Industry Revenue Million Forecast, by Price Trend Analysis 2019 & 2032
                                                              63. Table 63: Global Dragon Fruit Industry Revenue Million Forecast, by Country 2019 & 2032
                                                              64. Table 64: Germany Dragon Fruit Industry Revenue (Million) Forecast, by Application 2019 & 2032
                                                              65. Table 65: UK Dragon Fruit Industry Revenue (Million) Forecast, by Application 2019 & 2032
                                                              66. Table 66: France Dragon Fruit Industry Revenue (Million) Forecast, by Application 2019 & 2032
                                                              67. Table 67: Netherlands Dragon Fruit Industry Revenue (Million) Forecast, by Application 2019 & 2032
                                                              68. Table 68: Global Dragon Fruit Industry Revenue Million Forecast, by Production Analysis 2019 & 2032
                                                              69. Table 69: Global Dragon Fruit Industry Revenue Million Forecast, by Consumption Analysis 2019 & 2032
                                                              70. Table 70: Global Dragon Fruit Industry Revenue Million Forecast, by Import Market Analysis (Value & Volume) 2019 & 2032
                                                              71. Table 71: Global Dragon Fruit Industry Revenue Million Forecast, by Export Market Analysis (Value & Volume) 2019 & 2032
                                                              72. Table 72: Global Dragon Fruit Industry Revenue Million Forecast, by Price Trend Analysis 2019 & 2032
                                                              73. Table 73: Global Dragon Fruit Industry Revenue Million Forecast, by Country 2019 & 2032
                                                              74. Table 74: China Dragon Fruit Industry Revenue (Million) Forecast, by Application 2019 & 2032
                                                              75. Table 75: Vietnam Dragon Fruit Industry Revenue (Million) Forecast, by Application 2019 & 2032
                                                              76. Table 76: Cambodia Dragon Fruit Industry Revenue (Million) Forecast, by Application 2019 & 2032
                                                              77. Table 77: India Dragon Fruit Industry Revenue (Million) Forecast, by Application 2019 & 2032
                                                              78. Table 78: Thailand Dragon Fruit Industry Revenue (Million) Forecast, by Application 2019 & 2032
                                                              79. Table 79: Indonesia Dragon Fruit Industry Revenue (Million) Forecast, by Application 2019 & 2032
                                                              80. Table 80: Global Dragon Fruit Industry Revenue Million Forecast, by Production Analysis 2019 & 2032
                                                              81. Table 81: Global Dragon Fruit Industry Revenue Million Forecast, by Consumption Analysis 2019 & 2032
                                                              82. Table 82: Global Dragon Fruit Industry Revenue Million Forecast, by Import Market Analysis (Value & Volume) 2019 & 2032
                                                              83. Table 83: Global Dragon Fruit Industry Revenue Million Forecast, by Export Market Analysis (Value & Volume) 2019 & 2032
                                                              84. Table 84: Global Dragon Fruit Industry Revenue Million Forecast, by Price Trend Analysis 2019 & 2032
                                                              85. Table 85: Global Dragon Fruit Industry Revenue Million Forecast, by Country 2019 & 2032
                                                              86. Table 86: Brazil Dragon Fruit Industry Revenue (Million) Forecast, by Application 2019 & 2032
                                                              87. Table 87: Columbia Dragon Fruit Industry Revenue (Million) Forecast, by Application 2019 & 2032
                                                              88. Table 88: Argentina Dragon Fruit Industry Revenue (Million) Forecast, by Application 2019 & 2032
                                                              89. Table 89: Global Dragon Fruit Industry Revenue Million Forecast, by Production Analysis 2019 & 2032
                                                              90. Table 90: Global Dragon Fruit Industry Revenue Million Forecast, by Consumption Analysis 2019 & 2032
                                                              91. Table 91: Global Dragon Fruit Industry Revenue Million Forecast, by Import Market Analysis (Value & Volume) 2019 & 2032
                                                              92. Table 92: Global Dragon Fruit Industry Revenue Million Forecast, by Export Market Analysis (Value & Volume) 2019 & 2032
                                                              93. Table 93: Global Dragon Fruit Industry Revenue Million Forecast, by Price Trend Analysis 2019 & 2032
                                                              94. Table 94: Global Dragon Fruit Industry Revenue Million Forecast, by Country 2019 & 2032
                                                              95. Table 95: South Africa Dragon Fruit Industry Revenue (Million) Forecast, by Application 2019 & 2032
                                                              96. Table 96: Israel Dragon Fruit Industry Revenue (Million) Forecast, by Application 2019 & 2032
                                                              97. Table 97: Egypt Dragon Fruit Industry Revenue (Million) Forecast, by Application 2019 & 2032


                                                              Frequently Asked Questions

                                                              1. What is the projected Compound Annual Growth Rate (CAGR) of the Dragon Fruit Industry?

                                                              The projected CAGR is approximately 4.40%.

                                                              2. Which companies are prominent players in the Dragon Fruit Industry?

                                                              Key companies in the market include Tropical Fruit Corporation , Eurofresh , Agro Dragon Villa , Suncrest Farms , Dragon Fruit Growers of America , Miami Fruit , Fruit Lovers.

                                                              3. What are the main segments of the Dragon Fruit Industry?

                                                              The market segments include Production Analysis, Consumption Analysis, Import Market Analysis (Value & Volume), Export Market Analysis (Value & Volume), Price Trend Analysis.

                                                              4. Can you provide details about the market size?

                                                              The market size is estimated to be USD 14.73 Million as of 2022.

                                                              5. What are some drivers contributing to market growth?

                                                              Increasing Demand for Garlic Due to Various Uses in Industries; Rising Demad of Organic Garlic; Increasing Government Initiatives.

                                                              6. What are the notable trends driving market growth?

                                                              Growing Demand for Dragon Fruit in China.

                                                              7. Are there any restraints impacting market growth?

                                                              Lack of Technical Knowledge of Farmers; Price Fluctuations.

                                                              8. Can you provide examples of recent developments in the market?

                                                              N/A

                                                              9. What pricing options are available for accessing the report?

                                                              Pricing options include single-user, multi-user, and enterprise licenses priced at USD 4750, USD 5250, and USD 8750 respectively.

                                                              10. Is the market size provided in terms of value or volume?

                                                              The market size is provided in terms of value, measured in Million.

                                                              11. Are there any specific market keywords associated with the report?

                                                              Yes, the market keyword associated with the report is "Dragon Fruit Industry," which aids in identifying and referencing the specific market segment covered.

                                                              12. How do I determine which pricing option suits my needs best?

                                                              The pricing options vary based on user requirements and access needs. Individual users may opt for single-user licenses, while businesses requiring broader access may choose multi-user or enterprise licenses for cost-effective access to the report.

                                                              13. Are there any additional resources or data provided in the Dragon Fruit Industry report?

                                                              While the report offers comprehensive insights, it's advisable to review the specific contents or supplementary materials provided to ascertain if additional resources or data are available.

                                                              14. How can I stay updated on further developments or reports in the Dragon Fruit Industry?

                                                              To stay informed about further developments, trends, and reports in the Dragon Fruit Industry, consider subscribing to industry newsletters, following relevant companies and organizations, or regularly checking reputable industry news sources and publications.


                                                              Methodology

                                                              Step 1 - Identification of Relevant Samples Size from Population Database

                                                              Step Chart
                                                              Bar Chart
                                                              Method Chart

                                                              Step 2 - Approaches for Defining Global Market Size (Value, Volume* & Price*)

                                                              Approach Chart
                                                              Top-down and bottom-up approaches are used to validate the global market size and estimate the market size for manufactures, regional segments, product, and application.

                                                              Note*: In applicable scenarios

                                                              Step 3 - Data Sources

                                                              Primary Research

                                                              • Web Analytics
                                                              • Survey Reports
                                                              • Research Institute
                                                              • Latest Research Reports
                                                              • Opinion Leaders

                                                              Secondary Research

                                                              • Annual Reports
                                                              • White Paper
                                                              • Latest Press Release
                                                              • Industry Association
                                                              • Paid Database
                                                              • Investor Presentations
                                                              Analyst Chart

                                                              Step 4 - Data Triangulation

                                                              Involves using different sources of information in order to increase the validity of a study

                                                              These sources are likely to be stakeholders in a program - participants, other researchers, program staff, other community members, and so on.

                                                              Then we put all data in single framework & apply various statistical tools to find out the dynamic on the market.

                                                              During the analysis stage, feedback from the stakeholder groups would be compared to determine areas of agreement as well as areas of divergence

                                                              Additionally, after gathering mixed and scattered data from a wide range of sources, data is triangulated and correlated to come up with estimated figures which are further validated through primary mediums or industry experts, opinion leaders.

                                                              About Precision Market View

                                                              Precision Market View offers precise market research, industry intelligence, and data analysis for healthcare, manufacturing, technology, and energy. Our reports provide the clarity you need to make informed decisions and drive growth.

                                                              Our team combines primary research, advanced analytics, and industry expertise to deliver actionable intelligence. We offer syndicated reports, custom research, and consulting services tailored to your business needs.

                                                              At Precision Market View, we are committed to quality, transparency, and client satisfaction. Every report is rigorously validated to ensure accuracy and relevance. Our global perspective and local expertise help you understand both the big picture and the finer details of your market.

                                                              Stay informed with Precision Market View. Subscribe to our newsletter for the latest updates and research highlights, and follow us on social media for real-time insights.

                                                              Precision Market View – Clarity for Your Strategic Decisions.

                                                              artwork spiralartwork spiralRelated Reports
                                                              artwork underline

                                                              India Maize Seed Market Market Strategies for the Next Decade: 2025-2033

                                                              Discover the booming Indian maize seed market! This comprehensive analysis reveals a CAGR of 10.20% (2025-2033), driven by hybrid seed adoption and rising demand. Explore key players, regional trends, and growth projections for this lucrative sector.

                                                              July 2025
                                                              Base Year: 2024
                                                              No Of Pages: 197
                                                              Price: $3800

                                                              Future Forecasts for India Combine Harvester Market Industry Growth

                                                              The India Combine Harvester Market is booming, projected to reach ₹[estimated 2033 value] million by 2033 with a 5.70% CAGR. Discover key trends, drivers, and restraints shaping this dynamic sector, including leading players like Kubota and Mahindra. Explore regional market analysis and growth forecasts for self-propelled, track, and tractor-powered harvesters.

                                                              July 2025
                                                              Base Year: 2024
                                                              No Of Pages: 197
                                                              Price: $3800

                                                              Canada Crop Protection Chemicals Industry Unlocking Growth Potential: 2025-2033 Analysis and Forecasts

                                                              Discover the growth trajectory of Canada's crop protection chemicals market (2025-2033). This in-depth analysis reveals market size, CAGR, key segments (insecticides, fungicides, herbicides), leading companies, and regional trends. Learn about market drivers, restraints, and future opportunities in the Canadian agricultural sector.

                                                              July 2025
                                                              Base Year: 2024
                                                              No Of Pages: 150
                                                              Price: $3800

                                                              Turf & Ornamental Chemical Input Industry Market Report: Trends and Growth

                                                              The Turf & Ornamental Chemical Input market is booming, projected to reach $9.875 billion by 2033 with a 4.34% CAGR. Discover key trends, leading companies (FMC, Bayer, Syngenta), and regional insights in this comprehensive market analysis. Explore the impact of pesticides, fertilizers, and growth regulators on landscaping and gardening.

                                                              July 2025
                                                              Base Year: 2024
                                                              No Of Pages: 234
                                                              Price: $4750

                                                              Brazil Maize Market: Growth Opportunities and Competitive Landscape Overview 2025-2033

                                                              Discover the booming Brazil maize market forecast (2025-2033)! This in-depth analysis reveals key trends, drivers, and challenges impacting hybrid maize, conventional maize, and applications across animal feed, human consumption, and biofuels. Learn about major players like Syngenta and Corteva and the projected market size and CAGR.

                                                              July 2025
                                                              Base Year: 2024
                                                              No Of Pages: 180
                                                              Price: $3800

                                                              Opportunities in North America Crop Protection Chemicals Industry Market 2025-2033

                                                              The North American crop protection chemicals market is booming, projected to reach [estimated 2033 market size in millions] by 2033 with a 4.34% CAGR. Discover key trends, driving forces, and major players shaping this dynamic industry, including insecticides, herbicides, fungicides, and more. Learn about regional variations and market segmentation across various crop types and application methods.

                                                              July 2025
                                                              Base Year: 2024
                                                              No Of Pages: 180
                                                              Price: $3800

                                                              Apple Industry to Grow at XX CAGR: Market Size Analysis and Forecasts 2025-2033

                                                              Discover the latest trends in the global apple industry. This in-depth market analysis reveals a steady growth trajectory, driven by consumer demand, diverse product applications, and expanding online retail. Learn about key players, regional insights, and future projections for the apple market from 2025-2033.

                                                              July 2025
                                                              Base Year: 2024
                                                              No Of Pages: 234
                                                              Price: $4750

                                                              Digital Agriculture Market 2025-2033: Preparing for Growth and Change

                                                              The booming digital agriculture market is projected to reach \$44.14 billion by 2033, fueled by precision farming, AI, and drone technology. Explore market trends, key players (AGCO, Microsoft, Deere), and regional growth in this comprehensive analysis.

                                                              July 2025
                                                              Base Year: 2024
                                                              No Of Pages: 150
                                                              Price: $4750

                                                              North America Maize Industry Charting Growth Trajectories 2025-2033: Strategic Insights and Forecasts

                                                              Discover the booming North American maize market! This comprehensive analysis reveals key trends, drivers, and restraints, including insights into hybrid seeds, field corn, sweet corn, popcorn, and major players like Bayer & Syngenta. Project your business strategy with our forecast to 2033.

                                                              July 2025
                                                              Base Year: 2024
                                                              No Of Pages: 180
                                                              Price: $3800

                                                              North America Agricultural Tractors Machinery Market 2025-2033 Overview: Trends, Competitor Dynamics, and Opportunities

                                                              Discover the booming North American agricultural tractors market! This comprehensive analysis reveals key trends, drivers, and restraints impacting the $16.39 billion industry through 2033, focusing on key players like Deere & Company and Mahindra & Mahindra. Explore market segmentation by HP and drive type, plus regional breakdowns.

                                                              July 2025
                                                              Base Year: 2024
                                                              No Of Pages: 234
                                                              Price: $4750

                                                              APAC Biofertilizers Market Growth Opportunities: Market Size Forecast to 2033

                                                              Discover the booming APAC biofertilizers market! This comprehensive analysis reveals a CAGR of 10.80%, driven by sustainable agriculture and growing demand for organic food. Explore market size projections, key segments (Rhizobium, Azospirillum, etc.), and leading companies shaping this dynamic industry.

                                                              July 2025
                                                              Base Year: 2024
                                                              No Of Pages: 180
                                                              Price: $4750

                                                              Turkey Agricultural Tractor Market Dynamics and Forecasts: 2025-2033 Strategic Insights

                                                              Discover the booming Turkish agricultural tractor market! This comprehensive analysis reveals a 6.10% CAGR, driven by government support and technological advancements. Explore market trends, segmentation by horsepower (50HP, 75HP, 100HP, 200HP+), key players, and growth projections to 2033. Invest wisely in this expanding sector!

                                                              July 2025
                                                              Base Year: 2024
                                                              No Of Pages: 197
                                                              Price: $3800

                                                              North America Herbicide Market Insightful Analysis: Trends, Competitor Dynamics, and Opportunities 2025-2033

                                                              Discover the surging North American herbicide market, projected to reach $XX million by 2033 with a 4.34% CAGR. This in-depth analysis explores key drivers, trends, restraints, and competitive landscapes, covering chemigation, foliar application, crop types, and leading companies like FMC and Bayer. Gain insights into regional market shares and future growth projections.

                                                              July 2025
                                                              Base Year: 2024
                                                              No Of Pages: 180
                                                              Price: $3800

                                                              Vietnam Agro Machinery Market Insights: Growth at XX CAGR Through 2033

                                                              Discover the booming Vietnam agro-machinery market, projected to reach [estimated value] by 2033 with a CAGR of 11.50%. This in-depth analysis explores market drivers, trends, restraints, key players (Yanmar, Kubota, VEAM), and segment insights (tractors, rice transplanters, harvesting machinery). Learn about investment opportunities and future growth potential.

                                                              July 2025
                                                              Base Year: 2024
                                                              No Of Pages: 150
                                                              Price: $3800

                                                              Exploring Key Dynamics of Honey Industry Industry

                                                              Discover the booming honey market! This comprehensive analysis reveals a $11.08B industry with a 5.20% CAGR, exploring key drivers, trends, regional insights (North America, Europe, Asia-Pacific), and leading brands like Dabur Honey and Patanjali Ayurved. Learn about raw honey, organic honey, Manuka honey, and more. Get your free market research now!

                                                              July 2025
                                                              Base Year: 2024
                                                              No Of Pages: 234
                                                              Price: $4750

                                                              Emerging Market Insights in Cotton Trade Analysis Market: 2025-2033 Overview

                                                              Discover the latest insights into the booming global cotton trade market. This comprehensive analysis reveals a $60B market (2025) projected to grow at a 4.5% CAGR through 2033, driven by textile industry growth and sustainable cotton demand. Explore key trends, restraints, and regional market shares.

                                                              July 2025
                                                              Base Year: 2024
                                                              No Of Pages: 150
                                                              Price: $4750

                                                              Asia-pacific Tomato Seed Market Projected to Grow at XX CAGR: Insights and Forecasts 2025-2033

                                                              The Asia-Pacific tomato seed market is booming, driven by rising demand and advancements in breeding technology. Discover key market trends, growth projections (2025-2033), major players, and regional insights in this comprehensive market analysis.

                                                              July 2025
                                                              Base Year: 2024
                                                              No Of Pages: 180
                                                              Price: $3800

                                                              Uganda Agriculture Industry Market Strategies for the Next Decade: 2025-2033

                                                              Discover the booming Ugandan agriculture industry! Explore market size ($4.07B in 2025), 4.20% CAGR growth projections to 2033, key players, and regional trends in cereals, oilseeds, fruits, and vegetables. Invest in Uganda's agricultural future.

                                                              July 2025
                                                              Base Year: 2024
                                                              No Of Pages: 150
                                                              Price: $3800

                                                              Artichokes Industry: Harnessing Emerging Innovations for Growth 2025-2033

                                                              Discover the booming artichoke market! Explore key trends, regional analysis, and leading companies driving growth in this $XX million industry projected to reach [estimated 2033 value] by 2033. Learn about the rising demand for fresh, canned, frozen, and marinated artichokes in the food service, household, and industrial sectors.

                                                              July 2025
                                                              Base Year: 2024
                                                              No Of Pages: 197
                                                              Price: $3800

                                                              Agricultural Inoculants Market Growth Opportunities and Market Forecast 2025-2033: A Strategic Analysis

                                                              Discover the booming agricultural inoculants market! Our comprehensive analysis reveals a CAGR of 10.50%, driven by sustainable farming trends and rising food demands. Explore market size, segmentation, key players (Bioceres, Novozymes, BASF), and regional insights for 2025-2033. Learn how bio-based solutions are revolutionizing agriculture.

                                                              July 2025
                                                              Base Year: 2024
                                                              No Of Pages: 150
                                                              Price: $4750
                                                              • Home
                                                              • About Us
                                                              • Industries
                                                                • Aerospace & Defense
                                                                • Agriculture
                                                                • Animal Nutrition & Wellness
                                                                • Automotive
                                                                • Chemicals & Materials
                                                                • Consumer Goods and Services
                                                                • Energy & Power
                                                                • Financial Services and Investment Intelligence
                                                                • Food & Beverage
                                                                • Home and Property Improvement
                                                                • Hospitality and Tourism
                                                                • Logistics
                                                                • Manufacturing Products and Services
                                                                • Packaging
                                                                • Professional and Commercial Services
                                                                • Real Estate and Construction
                                                                • Retail
                                                                • Technology, Media and Telecom
                                                                • Healthcare
                                                              • Services
                                                              • Contact
                                                              Main Logo
                                                              • Home
                                                              • About Us
                                                              • Industries
                                                                • Aerospace & Defense
                                                                • Agriculture
                                                                • Animal Nutrition & Wellness
                                                                • Automotive
                                                                • Chemicals & Materials
                                                                • Consumer Goods and Services
                                                                • Energy & Power
                                                                • Financial Services and Investment Intelligence
                                                                • Food & Beverage
                                                                • Home and Property Improvement
                                                                • Hospitality and Tourism
                                                                • Logistics
                                                                • Manufacturing Products and Services
                                                                • Packaging
                                                                • Professional and Commercial Services
                                                                • Real Estate and Construction
                                                                • Retail
                                                                • Technology, Media and Telecom
                                                                • Healthcare
                                                              • Services
                                                              • Contact
                                                              +17162654855
                                                              [email protected]

                                                              +17162654855

                                                              [email protected]

                                                              Business Address

                                                              Head Office

                                                              Office no. A 5010, fifth floor, Solitaire Business Hub, Near Phoenix mall, Pune, Maharashtra 411014

                                                              Contact Information

                                                              Craig Francis

                                                              Business Development Head

                                                              +17162654855

                                                              [email protected]

                                                              Connect With Us

                                                              Secure Payment Partners

                                                              payment image
                                                              RetailLogisticsPackagingAutomotiveHealthcareAgricultureEnergy & PowerFood & BeverageAerospace & DefenseChemicals & MaterialsHospitality and TourismAnimal Nutrition & WellnessConsumer Goods and ServicesReal Estate and ConstructionHome and Property ImprovementTechnology, Media and TelecomManufacturing Products and ServicesFinancial Services and Investment Intelligence

                                                              © 2025 All rights reserved


                                                              Privacy Policy
                                                              Terms and Conditions
                                                              FAQ