

Key Insights
The Direct Drive Smart Turbo Trainer market is poised for significant expansion, with a robust projected market size of USD 466.87 million in 2025, and an impressive CAGR of 7.5% expected to drive substantial growth through 2033. This upward trajectory is primarily fueled by increasing participation in cycling, a growing awareness of the health benefits associated with indoor training, and the technological advancements that enhance the realism and engagement of smart turbo trainers. The integration of virtual training platforms, personalized coaching, and advanced performance metrics has transformed these devices from simple trainers into sophisticated fitness solutions. This evolution is attracting both professional athletes seeking to maintain peak condition and amateur cyclists looking for convenient and effective ways to train, regardless of weather conditions or time constraints. The burgeoning trend towards connected fitness ecosystems further amplifies demand, as users increasingly seek integrated solutions for tracking, analysis, and social interaction.
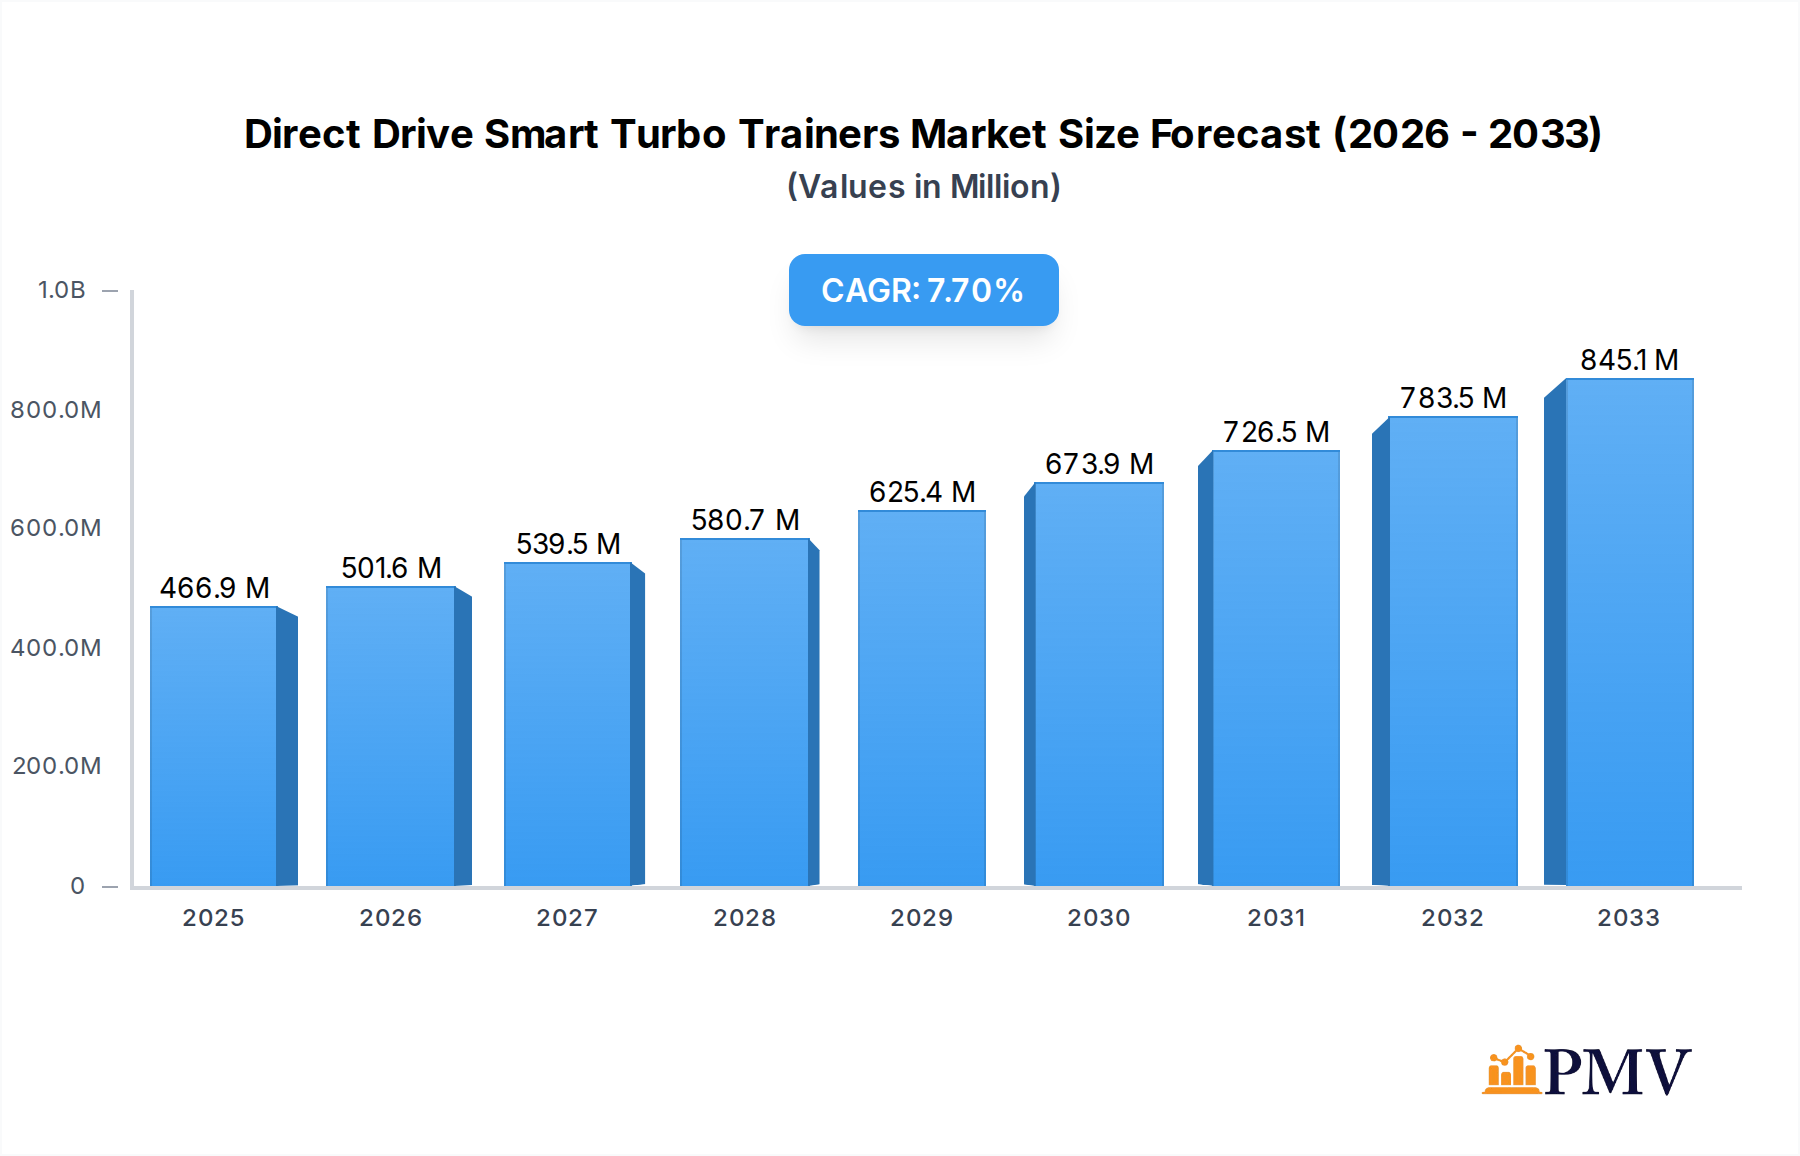
Direct Drive Smart Turbo Trainers Market Size (In Million)
The market's growth is further underpinned by several key drivers. The increasing popularity of competitive cycling events, coupled with a rise in health and wellness consciousness globally, is a major impetus. Furthermore, the convenience and safety offered by indoor training, especially in urban environments or during adverse weather, contribute significantly to market penetration. While the market is experiencing a strong upward trend, potential restraints such as the high initial cost of advanced models and the need for robust internet connectivity for optimal performance could temper rapid adoption in certain segments. However, continuous innovation in pricing strategies and technological improvements are expected to mitigate these challenges. Key segments like 'Commercial' and 'Household' applications are both showing strong potential, while the 'up to 2000 Watts' power output category is likely to see accelerated demand due to its suitability for a wider range of training intensities.

Direct Drive Smart Turbo Trainers Company Market Share
Direct Drive Smart Turbo Trainers Market: A Comprehensive Industry Analysis (2019–2033)
This detailed report provides an in-depth analysis of the global Direct Drive Smart Turbo Trainers market, encompassing historical performance, current trends, and future projections. With a study period from 2019 to 2033, a base year of 2025, and a forecast period of 2025–2033, this report offers critical insights for industry stakeholders. The market is segmented by application (Commercial, Household) and type (up to 1500 Watts, up to 1800 Watts, up to 2000 Watts, Other), with a focus on key players and technological advancements driving growth. This report is essential for understanding the evolving landscape of indoor cycling technology and its impact on both consumer and commercial fitness markets.
Direct Drive Smart Turbo Trainers Market Structure & Competitive Dynamics
The Direct Drive Smart Turbo Trainers market exhibits a moderate level of concentration, with several key players vying for market share. Innovation ecosystems are thriving, driven by significant investments in research and development by leading companies such as Wahoo Fitness, Technogym, and Garmin. These companies are continuously introducing advanced features to enhance user experience and performance metrics. Regulatory frameworks, while generally supportive of technological advancement, may introduce nuances in product certification and safety standards across different regions. Product substitutes, including wheel-on smart trainers and non-smart turbo trainers, exist but are increasingly challenged by the superior realism and accuracy of direct drive systems. End-user trends highlight a growing demand for immersive training experiences, particularly with the rise of virtual cycling platforms. Mergers and acquisitions (M&A) activities are anticipated to increase as larger companies seek to consolidate their market positions and acquire innovative technologies. The estimated market share of the top five players is projected to exceed 60% by 2025, with M&A deal values potentially reaching several hundred million dollars as strategic acquisitions become more prevalent.
- Market Concentration: Moderate, with key players dominating innovation and market penetration.
- Innovation Ecosystems: Robust, fueled by R&D investments in advanced features and connectivity.
- Regulatory Frameworks: Evolving, with a focus on safety, interoperability, and data privacy.
- Product Substitutes: Wheel-on smart trainers and non-smart trainers, but with declining competitive advantage.
- End-User Trends: Strong demand for realistic, interactive, and data-driven training experiences.
- M&A Activities: Expected to rise for market consolidation and technology acquisition, with deal values in the hundreds of millions.
Direct Drive Smart Turbo Trainers Industry Trends & Insights
The Direct Drive Smart Turbo Trainers industry is experiencing robust growth, primarily propelled by the increasing adoption of smart home gym equipment and the burgeoning popularity of virtual cycling and fitness applications. The market is witnessing a compound annual growth rate (CAGR) of approximately 12% during the forecast period. This surge is underpinned by several key drivers: the growing health consciousness among a global population, the convenience offered by home-based fitness solutions, and the technological advancements that provide an increasingly realistic and engaging indoor cycling experience. The integration of sophisticated power measurement, accurate gradient simulation, and seamless connectivity with platforms like Zwift, TrainerRoad, and Rouvy is transforming how individuals approach their fitness regimes. Technological disruptions, such as the development of more accurate gyroscopic sensors, quieter drive mechanisms, and enhanced data analytics capabilities, are continuously pushing the boundaries of what is possible in indoor training. Consumer preferences are leaning towards premium products that offer unparalleled realism, advanced training metrics, and a sense of community through virtual races and group rides. The market penetration of smart turbo trainers is projected to reach over 40% in developed economies by 2030. Furthermore, the increasing availability of financing options and subscription-based training services is making these advanced fitness tools more accessible to a wider consumer base. The competitive dynamics are characterized by intense product development, strategic partnerships with virtual platforms, and a focus on building brand loyalty through exceptional user support and community engagement. As the smart fitness industry matures, the emphasis is shifting towards personalization, AI-driven coaching, and integration with other smart health devices, further solidifying the position of direct drive smart turbo trainers as a cornerstone of modern fitness. The market is poised for sustained expansion, driven by a confluence of evolving lifestyle choices, technological innovation, and an ever-present desire for effective and engaging fitness solutions. The demand for high-fidelity training is expected to continue its upward trajectory, making direct drive smart turbo trainers an indispensable component of the modern fitness landscape.
Dominant Markets & Segments in Direct Drive Smart Turbo Trainers
North America is currently the dominant region in the Direct Drive Smart Turbo Trainers market, driven by a high disposable income, a strong culture of fitness and athletic pursuits, and early adoption of innovative fitness technologies. The United States, in particular, leads this dominance due to its extensive network of cycling enthusiasts, professional athletes, and a burgeoning virtual cycling community. The "Household" application segment is the largest, accounting for an estimated 70% of the market share, as individuals increasingly invest in premium home gym equipment for convenience and personalized training. Within the product types, the "up to 2000 Watts" segment holds a significant share, catering to serious cyclists and athletes who require high resistance levels for intense training and simulation. Key drivers for this dominance include robust economic policies that encourage consumer spending on health and wellness, well-developed retail infrastructure that facilitates product accessibility, and advanced digital infrastructure supporting the seamless operation of online platforms and connectivity. The increasing availability of subscription-based training services in this region also plays a crucial role.
- Leading Region: North America, with the United States as the primary driver.
- Dominant Application: Household, fueled by the demand for convenient and sophisticated home fitness solutions.
- Leading Product Type: Up to 2000 Watts, meeting the needs of performance-oriented athletes and cycling enthusiasts.
- Key Economic Drivers: High disposable income, strong consumer spending on health and wellness, and accessible financing options.
- Technological Drivers: Advanced digital infrastructure, widespread adoption of virtual cycling platforms, and high-speed internet penetration.
- Infrastructure Drivers: Well-established retail networks and efficient logistics for product distribution.
Direct Drive Smart Turbo Trainers Product Innovations
Direct drive smart turbo trainers are characterized by rapid product innovation, focusing on enhanced realism, accuracy, and connectivity. Key developments include improvements in electromagnetic resistance systems for smoother and more precise gradient simulation, the integration of advanced power meters for ultra-accurate wattage readings, and quieter drive mechanisms for user convenience. Product applications are expanding beyond traditional road cycling simulation to include a broader range of indoor fitness activities, with seamless integration with popular virtual training platforms. Competitive advantages are being gained through superior build quality, advanced analytics, and features like automatic calibration and intuitive app interfaces, ensuring a compelling user experience and strong market fit.
Report Segmentation & Scope
This report segments the Direct Drive Smart Turbo Trainers market by Application and Type.
Application Segmentation:
- Commercial: This segment includes gymnasiums, fitness centers, and professional training facilities. Growth projections for this segment are approximately 8% CAGR, with an estimated market size of several hundred million by 2025. Competitive dynamics are driven by durability, reliability, and the ability to cater to a high volume of users.
- Household: This segment encompasses home users seeking advanced indoor cycling solutions. It is projected to grow at a CAGR of 13%, with an estimated market size exceeding one billion by 2025. Competitive dynamics are focused on user experience, connectivity, and the integration with popular fitness apps.
Type Segmentation:
- Up to 1500 Watts: This segment caters to recreational cyclists and fitness enthusiasts, with an estimated market size of several hundred million. Growth is projected at 9% CAGR.
- Up to 1800 Watts: This segment targets intermediate cyclists and those seeking more challenging training, with an estimated market size of several hundred million. Growth is projected at 11% CAGR.
- Up to 2000 Watts: This segment is for advanced cyclists and competitive athletes, with an estimated market size exceeding one billion by 2025. Growth is projected at 14% CAGR.
- Other: This category includes specialized trainers or those with unique resistance capabilities, with a projected market size in the tens of millions. Growth is estimated at 7% CAGR.
Key Drivers of Direct Drive Smart Turbo Trainers Growth
The growth of the Direct Drive Smart Turbo Trainers market is propelled by several interconnected factors. Technologically, the continuous innovation in smart connectivity, accurate power measurement, and realistic gradient simulation significantly enhances user engagement and training effectiveness. Economically, rising disposable incomes, coupled with a growing awareness of health and wellness, fuels consumer spending on premium fitness equipment. The increasing popularity of virtual cycling platforms and the desire for immersive, data-driven workouts are key consumer preference drivers. Furthermore, the convenience of home-based training, especially in urban environments and during inclement weather, presents a substantial advantage. Supportive government initiatives promoting physical activity and the development of smart home technology also contribute to market expansion.
Challenges in the Direct Drive Smart Turbo Trainers Sector
Despite the strong growth trajectory, the Direct Drive Smart Turbo Trainers sector faces several challenges. High product costs can be a barrier for some consumers, limiting market penetration in price-sensitive regions. The complexity of initial setup and technical troubleshooting for some users can also be a restraint. Supply chain disruptions, particularly for electronic components, can impact production and lead times, potentially affecting market availability and pricing. Intense competition from established brands and new entrants can lead to price wars and margin pressures. Regulatory hurdles related to product safety, data privacy, and interoperability standards across different platforms can also pose challenges. Quantifiable impacts of these challenges can include a potential slowdown in growth by 1-2% and increased marketing expenditure to overcome price perception.
Leading Players in the Direct Drive Smart Turbo Trainers Market
- Wahoo Fitness
- Technogym
- Garmin
- Elite
- Saris
- Minoura
- Sunlite
- BKOOL
- Kinetic
Key Developments in Direct Drive Smart Turbo Trainers Sector
- 2023/2024: Introduction of AI-powered adaptive training programs and personalized coaching features integrated into trainer firmware.
- 2022/2023: Enhanced electromagnetic resistance units offering wider resistance ranges and faster response times, simulating steeper gradients more accurately.
- 2021/2022: Increased focus on quieter drive systems and improved power meter accuracy to sub-1% variance.
- 2020/2021: Significant growth in partnerships with major virtual cycling platforms (Zwift, TrainerRoad) for seamless integration and enhanced user experience.
- 2019/2020: Emergence of direct drive trainers with integrated, smart steering functionality for a more immersive virtual riding experience.
Strategic Direct Drive Smart Turbo Trainers Market Outlook
The strategic outlook for the Direct Drive Smart Turbo Trainers market is exceptionally positive, driven by continued innovation and evolving consumer behavior. Future growth accelerators include the integration of advanced virtual reality (VR) and augmented reality (AR) technologies to create even more immersive training environments, further blurring the lines between indoor and outdoor cycling. The expansion of the market into emerging economies, fueled by increasing disposable incomes and a growing fitness consciousness, presents significant untapped potential. Strategic opportunities lie in developing more affordable yet feature-rich models, fostering stronger partnerships with health and wellness providers, and leveraging big data analytics to offer highly personalized training insights and recommendations. The market is expected to witness further consolidation and strategic alliances as companies aim to capture a larger share of this rapidly expanding and dynamic sector.
Direct Drive Smart Turbo Trainers Segmentation
-
1. Application
- 1.1. Commercial
- 1.2. Household
-
2. Types
- 2.1. up to 1500 Watts
- 2.2. up to 1800 Watts
- 2.3. up to 2000 Watts
- 2.4. Other
Direct Drive Smart Turbo Trainers Segmentation By Geography
-
1. North America
- 1.1. United States
- 1.2. Canada
- 1.3. Mexico
-
2. South America
- 2.1. Brazil
- 2.2. Argentina
- 2.3. Rest of South America
-
3. Europe
- 3.1. United Kingdom
- 3.2. Germany
- 3.3. France
- 3.4. Italy
- 3.5. Spain
- 3.6. Russia
- 3.7. Benelux
- 3.8. Nordics
- 3.9. Rest of Europe
-
4. Middle East & Africa
- 4.1. Turkey
- 4.2. Israel
- 4.3. GCC
- 4.4. North Africa
- 4.5. South Africa
- 4.6. Rest of Middle East & Africa
-
5. Asia Pacific
- 5.1. China
- 5.2. India
- 5.3. Japan
- 5.4. South Korea
- 5.5. ASEAN
- 5.6. Oceania
- 5.7. Rest of Asia Pacific
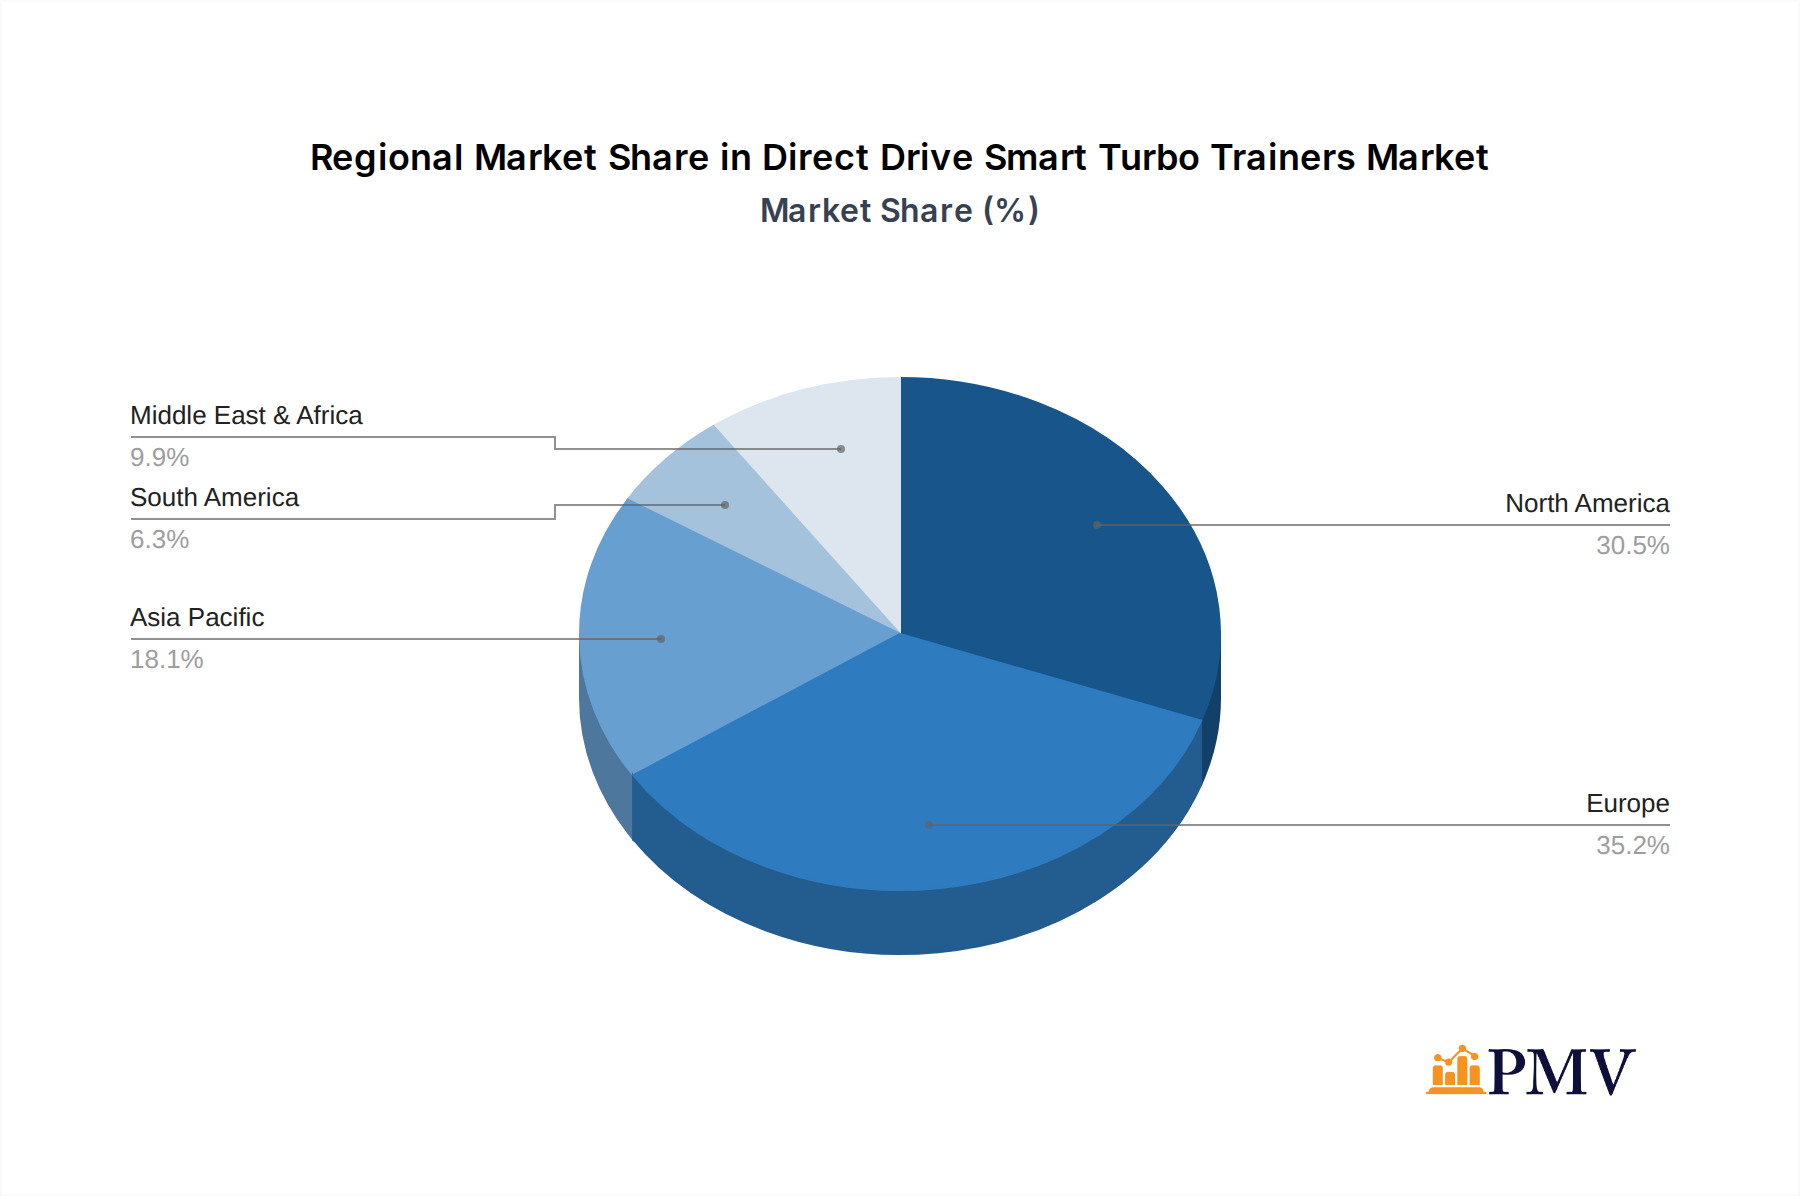
Direct Drive Smart Turbo Trainers Regional Market Share
Geographic Coverage of Direct Drive Smart Turbo Trainers
Direct Drive Smart Turbo Trainers REPORT HIGHLIGHTS
| Aspects | Details |
|---|---|
| Study Period | 2020-2034 |
| Base Year | 2025 |
| Estimated Year | 2026 |
| Forecast Period | 2026-2034 |
| Historical Period | 2020-2025 |
| Growth Rate | CAGR of 7.5% from 2020-2034 |
| Segmentation |
|
Table of Contents
- 1. Introduction
- 1.1. Research Scope
- 1.2. Market Segmentation
- 1.3. Research Methodology
- 1.4. Definitions and Assumptions
- 2. Executive Summary
- 2.1. Introduction
- 3. Market Dynamics
- 3.1. Introduction
- 3.2. Market Drivers
- 3.3. Market Restrains
- 3.4. Market Trends
- 4. Market Factor Analysis
- 4.1. Porters Five Forces
- 4.2. Supply/Value Chain
- 4.3. PESTEL analysis
- 4.4. Market Entropy
- 4.5. Patent/Trademark Analysis
- 5. Global Direct Drive Smart Turbo Trainers Analysis, Insights and Forecast, 2020-2032
- 5.1. Market Analysis, Insights and Forecast - by Application
- 5.1.1. Commercial
- 5.1.2. Household
- 5.2. Market Analysis, Insights and Forecast - by Types
- 5.2.1. up to 1500 Watts
- 5.2.2. up to 1800 Watts
- 5.2.3. up to 2000 Watts
- 5.2.4. Other
- 5.3. Market Analysis, Insights and Forecast - by Region
- 5.3.1. North America
- 5.3.2. South America
- 5.3.3. Europe
- 5.3.4. Middle East & Africa
- 5.3.5. Asia Pacific
- 5.1. Market Analysis, Insights and Forecast - by Application
- 6. North America Direct Drive Smart Turbo Trainers Analysis, Insights and Forecast, 2020-2032
- 6.1. Market Analysis, Insights and Forecast - by Application
- 6.1.1. Commercial
- 6.1.2. Household
- 6.2. Market Analysis, Insights and Forecast - by Types
- 6.2.1. up to 1500 Watts
- 6.2.2. up to 1800 Watts
- 6.2.3. up to 2000 Watts
- 6.2.4. Other
- 6.1. Market Analysis, Insights and Forecast - by Application
- 7. South America Direct Drive Smart Turbo Trainers Analysis, Insights and Forecast, 2020-2032
- 7.1. Market Analysis, Insights and Forecast - by Application
- 7.1.1. Commercial
- 7.1.2. Household
- 7.2. Market Analysis, Insights and Forecast - by Types
- 7.2.1. up to 1500 Watts
- 7.2.2. up to 1800 Watts
- 7.2.3. up to 2000 Watts
- 7.2.4. Other
- 7.1. Market Analysis, Insights and Forecast - by Application
- 8. Europe Direct Drive Smart Turbo Trainers Analysis, Insights and Forecast, 2020-2032
- 8.1. Market Analysis, Insights and Forecast - by Application
- 8.1.1. Commercial
- 8.1.2. Household
- 8.2. Market Analysis, Insights and Forecast - by Types
- 8.2.1. up to 1500 Watts
- 8.2.2. up to 1800 Watts
- 8.2.3. up to 2000 Watts
- 8.2.4. Other
- 8.1. Market Analysis, Insights and Forecast - by Application
- 9. Middle East & Africa Direct Drive Smart Turbo Trainers Analysis, Insights and Forecast, 2020-2032
- 9.1. Market Analysis, Insights and Forecast - by Application
- 9.1.1. Commercial
- 9.1.2. Household
- 9.2. Market Analysis, Insights and Forecast - by Types
- 9.2.1. up to 1500 Watts
- 9.2.2. up to 1800 Watts
- 9.2.3. up to 2000 Watts
- 9.2.4. Other
- 9.1. Market Analysis, Insights and Forecast - by Application
- 10. Asia Pacific Direct Drive Smart Turbo Trainers Analysis, Insights and Forecast, 2020-2032
- 10.1. Market Analysis, Insights and Forecast - by Application
- 10.1.1. Commercial
- 10.1.2. Household
- 10.2. Market Analysis, Insights and Forecast - by Types
- 10.2.1. up to 1500 Watts
- 10.2.2. up to 1800 Watts
- 10.2.3. up to 2000 Watts
- 10.2.4. Other
- 10.1. Market Analysis, Insights and Forecast - by Application
- 11. Competitive Analysis
- 11.1. Global Market Share Analysis 2025
- 11.2. Company Profiles
- 11.2.1 Wahoo Fitness
- 11.2.1.1. Overview
- 11.2.1.2. Products
- 11.2.1.3. SWOT Analysis
- 11.2.1.4. Recent Developments
- 11.2.1.5. Financials (Based on Availability)
- 11.2.2 Technogym
- 11.2.2.1. Overview
- 11.2.2.2. Products
- 11.2.2.3. SWOT Analysis
- 11.2.2.4. Recent Developments
- 11.2.2.5. Financials (Based on Availability)
- 11.2.3 Garmin
- 11.2.3.1. Overview
- 11.2.3.2. Products
- 11.2.3.3. SWOT Analysis
- 11.2.3.4. Recent Developments
- 11.2.3.5. Financials (Based on Availability)
- 11.2.4 Elite
- 11.2.4.1. Overview
- 11.2.4.2. Products
- 11.2.4.3. SWOT Analysis
- 11.2.4.4. Recent Developments
- 11.2.4.5. Financials (Based on Availability)
- 11.2.5 Saris
- 11.2.5.1. Overview
- 11.2.5.2. Products
- 11.2.5.3. SWOT Analysis
- 11.2.5.4. Recent Developments
- 11.2.5.5. Financials (Based on Availability)
- 11.2.6 Minoura
- 11.2.6.1. Overview
- 11.2.6.2. Products
- 11.2.6.3. SWOT Analysis
- 11.2.6.4. Recent Developments
- 11.2.6.5. Financials (Based on Availability)
- 11.2.7 Sunlite
- 11.2.7.1. Overview
- 11.2.7.2. Products
- 11.2.7.3. SWOT Analysis
- 11.2.7.4. Recent Developments
- 11.2.7.5. Financials (Based on Availability)
- 11.2.8 BKOOL
- 11.2.8.1. Overview
- 11.2.8.2. Products
- 11.2.8.3. SWOT Analysis
- 11.2.8.4. Recent Developments
- 11.2.8.5. Financials (Based on Availability)
- 11.2.9 Kinetic
- 11.2.9.1. Overview
- 11.2.9.2. Products
- 11.2.9.3. SWOT Analysis
- 11.2.9.4. Recent Developments
- 11.2.9.5. Financials (Based on Availability)
- 11.2.1 Wahoo Fitness
List of Figures
- Figure 1: Global Direct Drive Smart Turbo Trainers Revenue Breakdown (undefined, %) by Region 2025 & 2033
- Figure 2: Global Direct Drive Smart Turbo Trainers Volume Breakdown (K, %) by Region 2025 & 2033
- Figure 3: North America Direct Drive Smart Turbo Trainers Revenue (undefined), by Application 2025 & 2033
- Figure 4: North America Direct Drive Smart Turbo Trainers Volume (K), by Application 2025 & 2033
- Figure 5: North America Direct Drive Smart Turbo Trainers Revenue Share (%), by Application 2025 & 2033
- Figure 6: North America Direct Drive Smart Turbo Trainers Volume Share (%), by Application 2025 & 2033
- Figure 7: North America Direct Drive Smart Turbo Trainers Revenue (undefined), by Types 2025 & 2033
- Figure 8: North America Direct Drive Smart Turbo Trainers Volume (K), by Types 2025 & 2033
- Figure 9: North America Direct Drive Smart Turbo Trainers Revenue Share (%), by Types 2025 & 2033
- Figure 10: North America Direct Drive Smart Turbo Trainers Volume Share (%), by Types 2025 & 2033
- Figure 11: North America Direct Drive Smart Turbo Trainers Revenue (undefined), by Country 2025 & 2033
- Figure 12: North America Direct Drive Smart Turbo Trainers Volume (K), by Country 2025 & 2033
- Figure 13: North America Direct Drive Smart Turbo Trainers Revenue Share (%), by Country 2025 & 2033
- Figure 14: North America Direct Drive Smart Turbo Trainers Volume Share (%), by Country 2025 & 2033
- Figure 15: South America Direct Drive Smart Turbo Trainers Revenue (undefined), by Application 2025 & 2033
- Figure 16: South America Direct Drive Smart Turbo Trainers Volume (K), by Application 2025 & 2033
- Figure 17: South America Direct Drive Smart Turbo Trainers Revenue Share (%), by Application 2025 & 2033
- Figure 18: South America Direct Drive Smart Turbo Trainers Volume Share (%), by Application 2025 & 2033
- Figure 19: South America Direct Drive Smart Turbo Trainers Revenue (undefined), by Types 2025 & 2033
- Figure 20: South America Direct Drive Smart Turbo Trainers Volume (K), by Types 2025 & 2033
- Figure 21: South America Direct Drive Smart Turbo Trainers Revenue Share (%), by Types 2025 & 2033
- Figure 22: South America Direct Drive Smart Turbo Trainers Volume Share (%), by Types 2025 & 2033
- Figure 23: South America Direct Drive Smart Turbo Trainers Revenue (undefined), by Country 2025 & 2033
- Figure 24: South America Direct Drive Smart Turbo Trainers Volume (K), by Country 2025 & 2033
- Figure 25: South America Direct Drive Smart Turbo Trainers Revenue Share (%), by Country 2025 & 2033
- Figure 26: South America Direct Drive Smart Turbo Trainers Volume Share (%), by Country 2025 & 2033
- Figure 27: Europe Direct Drive Smart Turbo Trainers Revenue (undefined), by Application 2025 & 2033
- Figure 28: Europe Direct Drive Smart Turbo Trainers Volume (K), by Application 2025 & 2033
- Figure 29: Europe Direct Drive Smart Turbo Trainers Revenue Share (%), by Application 2025 & 2033
- Figure 30: Europe Direct Drive Smart Turbo Trainers Volume Share (%), by Application 2025 & 2033
- Figure 31: Europe Direct Drive Smart Turbo Trainers Revenue (undefined), by Types 2025 & 2033
- Figure 32: Europe Direct Drive Smart Turbo Trainers Volume (K), by Types 2025 & 2033
- Figure 33: Europe Direct Drive Smart Turbo Trainers Revenue Share (%), by Types 2025 & 2033
- Figure 34: Europe Direct Drive Smart Turbo Trainers Volume Share (%), by Types 2025 & 2033
- Figure 35: Europe Direct Drive Smart Turbo Trainers Revenue (undefined), by Country 2025 & 2033
- Figure 36: Europe Direct Drive Smart Turbo Trainers Volume (K), by Country 2025 & 2033
- Figure 37: Europe Direct Drive Smart Turbo Trainers Revenue Share (%), by Country 2025 & 2033
- Figure 38: Europe Direct Drive Smart Turbo Trainers Volume Share (%), by Country 2025 & 2033
- Figure 39: Middle East & Africa Direct Drive Smart Turbo Trainers Revenue (undefined), by Application 2025 & 2033
- Figure 40: Middle East & Africa Direct Drive Smart Turbo Trainers Volume (K), by Application 2025 & 2033
- Figure 41: Middle East & Africa Direct Drive Smart Turbo Trainers Revenue Share (%), by Application 2025 & 2033
- Figure 42: Middle East & Africa Direct Drive Smart Turbo Trainers Volume Share (%), by Application 2025 & 2033
- Figure 43: Middle East & Africa Direct Drive Smart Turbo Trainers Revenue (undefined), by Types 2025 & 2033
- Figure 44: Middle East & Africa Direct Drive Smart Turbo Trainers Volume (K), by Types 2025 & 2033
- Figure 45: Middle East & Africa Direct Drive Smart Turbo Trainers Revenue Share (%), by Types 2025 & 2033
- Figure 46: Middle East & Africa Direct Drive Smart Turbo Trainers Volume Share (%), by Types 2025 & 2033
- Figure 47: Middle East & Africa Direct Drive Smart Turbo Trainers Revenue (undefined), by Country 2025 & 2033
- Figure 48: Middle East & Africa Direct Drive Smart Turbo Trainers Volume (K), by Country 2025 & 2033
- Figure 49: Middle East & Africa Direct Drive Smart Turbo Trainers Revenue Share (%), by Country 2025 & 2033
- Figure 50: Middle East & Africa Direct Drive Smart Turbo Trainers Volume Share (%), by Country 2025 & 2033
- Figure 51: Asia Pacific Direct Drive Smart Turbo Trainers Revenue (undefined), by Application 2025 & 2033
- Figure 52: Asia Pacific Direct Drive Smart Turbo Trainers Volume (K), by Application 2025 & 2033
- Figure 53: Asia Pacific Direct Drive Smart Turbo Trainers Revenue Share (%), by Application 2025 & 2033
- Figure 54: Asia Pacific Direct Drive Smart Turbo Trainers Volume Share (%), by Application 2025 & 2033
- Figure 55: Asia Pacific Direct Drive Smart Turbo Trainers Revenue (undefined), by Types 2025 & 2033
- Figure 56: Asia Pacific Direct Drive Smart Turbo Trainers Volume (K), by Types 2025 & 2033
- Figure 57: Asia Pacific Direct Drive Smart Turbo Trainers Revenue Share (%), by Types 2025 & 2033
- Figure 58: Asia Pacific Direct Drive Smart Turbo Trainers Volume Share (%), by Types 2025 & 2033
- Figure 59: Asia Pacific Direct Drive Smart Turbo Trainers Revenue (undefined), by Country 2025 & 2033
- Figure 60: Asia Pacific Direct Drive Smart Turbo Trainers Volume (K), by Country 2025 & 2033
- Figure 61: Asia Pacific Direct Drive Smart Turbo Trainers Revenue Share (%), by Country 2025 & 2033
- Figure 62: Asia Pacific Direct Drive Smart Turbo Trainers Volume Share (%), by Country 2025 & 2033
List of Tables
- Table 1: Global Direct Drive Smart Turbo Trainers Revenue undefined Forecast, by Application 2020 & 2033
- Table 2: Global Direct Drive Smart Turbo Trainers Volume K Forecast, by Application 2020 & 2033
- Table 3: Global Direct Drive Smart Turbo Trainers Revenue undefined Forecast, by Types 2020 & 2033
- Table 4: Global Direct Drive Smart Turbo Trainers Volume K Forecast, by Types 2020 & 2033
- Table 5: Global Direct Drive Smart Turbo Trainers Revenue undefined Forecast, by Region 2020 & 2033
- Table 6: Global Direct Drive Smart Turbo Trainers Volume K Forecast, by Region 2020 & 2033
- Table 7: Global Direct Drive Smart Turbo Trainers Revenue undefined Forecast, by Application 2020 & 2033
- Table 8: Global Direct Drive Smart Turbo Trainers Volume K Forecast, by Application 2020 & 2033
- Table 9: Global Direct Drive Smart Turbo Trainers Revenue undefined Forecast, by Types 2020 & 2033
- Table 10: Global Direct Drive Smart Turbo Trainers Volume K Forecast, by Types 2020 & 2033
- Table 11: Global Direct Drive Smart Turbo Trainers Revenue undefined Forecast, by Country 2020 & 2033
- Table 12: Global Direct Drive Smart Turbo Trainers Volume K Forecast, by Country 2020 & 2033
- Table 13: United States Direct Drive Smart Turbo Trainers Revenue (undefined) Forecast, by Application 2020 & 2033
- Table 14: United States Direct Drive Smart Turbo Trainers Volume (K) Forecast, by Application 2020 & 2033
- Table 15: Canada Direct Drive Smart Turbo Trainers Revenue (undefined) Forecast, by Application 2020 & 2033
- Table 16: Canada Direct Drive Smart Turbo Trainers Volume (K) Forecast, by Application 2020 & 2033
- Table 17: Mexico Direct Drive Smart Turbo Trainers Revenue (undefined) Forecast, by Application 2020 & 2033
- Table 18: Mexico Direct Drive Smart Turbo Trainers Volume (K) Forecast, by Application 2020 & 2033
- Table 19: Global Direct Drive Smart Turbo Trainers Revenue undefined Forecast, by Application 2020 & 2033
- Table 20: Global Direct Drive Smart Turbo Trainers Volume K Forecast, by Application 2020 & 2033
- Table 21: Global Direct Drive Smart Turbo Trainers Revenue undefined Forecast, by Types 2020 & 2033
- Table 22: Global Direct Drive Smart Turbo Trainers Volume K Forecast, by Types 2020 & 2033
- Table 23: Global Direct Drive Smart Turbo Trainers Revenue undefined Forecast, by Country 2020 & 2033
- Table 24: Global Direct Drive Smart Turbo Trainers Volume K Forecast, by Country 2020 & 2033
- Table 25: Brazil Direct Drive Smart Turbo Trainers Revenue (undefined) Forecast, by Application 2020 & 2033
- Table 26: Brazil Direct Drive Smart Turbo Trainers Volume (K) Forecast, by Application 2020 & 2033
- Table 27: Argentina Direct Drive Smart Turbo Trainers Revenue (undefined) Forecast, by Application 2020 & 2033
- Table 28: Argentina Direct Drive Smart Turbo Trainers Volume (K) Forecast, by Application 2020 & 2033
- Table 29: Rest of South America Direct Drive Smart Turbo Trainers Revenue (undefined) Forecast, by Application 2020 & 2033
- Table 30: Rest of South America Direct Drive Smart Turbo Trainers Volume (K) Forecast, by Application 2020 & 2033
- Table 31: Global Direct Drive Smart Turbo Trainers Revenue undefined Forecast, by Application 2020 & 2033
- Table 32: Global Direct Drive Smart Turbo Trainers Volume K Forecast, by Application 2020 & 2033
- Table 33: Global Direct Drive Smart Turbo Trainers Revenue undefined Forecast, by Types 2020 & 2033
- Table 34: Global Direct Drive Smart Turbo Trainers Volume K Forecast, by Types 2020 & 2033
- Table 35: Global Direct Drive Smart Turbo Trainers Revenue undefined Forecast, by Country 2020 & 2033
- Table 36: Global Direct Drive Smart Turbo Trainers Volume K Forecast, by Country 2020 & 2033
- Table 37: United Kingdom Direct Drive Smart Turbo Trainers Revenue (undefined) Forecast, by Application 2020 & 2033
- Table 38: United Kingdom Direct Drive Smart Turbo Trainers Volume (K) Forecast, by Application 2020 & 2033
- Table 39: Germany Direct Drive Smart Turbo Trainers Revenue (undefined) Forecast, by Application 2020 & 2033
- Table 40: Germany Direct Drive Smart Turbo Trainers Volume (K) Forecast, by Application 2020 & 2033
- Table 41: France Direct Drive Smart Turbo Trainers Revenue (undefined) Forecast, by Application 2020 & 2033
- Table 42: France Direct Drive Smart Turbo Trainers Volume (K) Forecast, by Application 2020 & 2033
- Table 43: Italy Direct Drive Smart Turbo Trainers Revenue (undefined) Forecast, by Application 2020 & 2033
- Table 44: Italy Direct Drive Smart Turbo Trainers Volume (K) Forecast, by Application 2020 & 2033
- Table 45: Spain Direct Drive Smart Turbo Trainers Revenue (undefined) Forecast, by Application 2020 & 2033
- Table 46: Spain Direct Drive Smart Turbo Trainers Volume (K) Forecast, by Application 2020 & 2033
- Table 47: Russia Direct Drive Smart Turbo Trainers Revenue (undefined) Forecast, by Application 2020 & 2033
- Table 48: Russia Direct Drive Smart Turbo Trainers Volume (K) Forecast, by Application 2020 & 2033
- Table 49: Benelux Direct Drive Smart Turbo Trainers Revenue (undefined) Forecast, by Application 2020 & 2033
- Table 50: Benelux Direct Drive Smart Turbo Trainers Volume (K) Forecast, by Application 2020 & 2033
- Table 51: Nordics Direct Drive Smart Turbo Trainers Revenue (undefined) Forecast, by Application 2020 & 2033
- Table 52: Nordics Direct Drive Smart Turbo Trainers Volume (K) Forecast, by Application 2020 & 2033
- Table 53: Rest of Europe Direct Drive Smart Turbo Trainers Revenue (undefined) Forecast, by Application 2020 & 2033
- Table 54: Rest of Europe Direct Drive Smart Turbo Trainers Volume (K) Forecast, by Application 2020 & 2033
- Table 55: Global Direct Drive Smart Turbo Trainers Revenue undefined Forecast, by Application 2020 & 2033
- Table 56: Global Direct Drive Smart Turbo Trainers Volume K Forecast, by Application 2020 & 2033
- Table 57: Global Direct Drive Smart Turbo Trainers Revenue undefined Forecast, by Types 2020 & 2033
- Table 58: Global Direct Drive Smart Turbo Trainers Volume K Forecast, by Types 2020 & 2033
- Table 59: Global Direct Drive Smart Turbo Trainers Revenue undefined Forecast, by Country 2020 & 2033
- Table 60: Global Direct Drive Smart Turbo Trainers Volume K Forecast, by Country 2020 & 2033
- Table 61: Turkey Direct Drive Smart Turbo Trainers Revenue (undefined) Forecast, by Application 2020 & 2033
- Table 62: Turkey Direct Drive Smart Turbo Trainers Volume (K) Forecast, by Application 2020 & 2033
- Table 63: Israel Direct Drive Smart Turbo Trainers Revenue (undefined) Forecast, by Application 2020 & 2033
- Table 64: Israel Direct Drive Smart Turbo Trainers Volume (K) Forecast, by Application 2020 & 2033
- Table 65: GCC Direct Drive Smart Turbo Trainers Revenue (undefined) Forecast, by Application 2020 & 2033
- Table 66: GCC Direct Drive Smart Turbo Trainers Volume (K) Forecast, by Application 2020 & 2033
- Table 67: North Africa Direct Drive Smart Turbo Trainers Revenue (undefined) Forecast, by Application 2020 & 2033
- Table 68: North Africa Direct Drive Smart Turbo Trainers Volume (K) Forecast, by Application 2020 & 2033
- Table 69: South Africa Direct Drive Smart Turbo Trainers Revenue (undefined) Forecast, by Application 2020 & 2033
- Table 70: South Africa Direct Drive Smart Turbo Trainers Volume (K) Forecast, by Application 2020 & 2033
- Table 71: Rest of Middle East & Africa Direct Drive Smart Turbo Trainers Revenue (undefined) Forecast, by Application 2020 & 2033
- Table 72: Rest of Middle East & Africa Direct Drive Smart Turbo Trainers Volume (K) Forecast, by Application 2020 & 2033
- Table 73: Global Direct Drive Smart Turbo Trainers Revenue undefined Forecast, by Application 2020 & 2033
- Table 74: Global Direct Drive Smart Turbo Trainers Volume K Forecast, by Application 2020 & 2033
- Table 75: Global Direct Drive Smart Turbo Trainers Revenue undefined Forecast, by Types 2020 & 2033
- Table 76: Global Direct Drive Smart Turbo Trainers Volume K Forecast, by Types 2020 & 2033
- Table 77: Global Direct Drive Smart Turbo Trainers Revenue undefined Forecast, by Country 2020 & 2033
- Table 78: Global Direct Drive Smart Turbo Trainers Volume K Forecast, by Country 2020 & 2033
- Table 79: China Direct Drive Smart Turbo Trainers Revenue (undefined) Forecast, by Application 2020 & 2033
- Table 80: China Direct Drive Smart Turbo Trainers Volume (K) Forecast, by Application 2020 & 2033
- Table 81: India Direct Drive Smart Turbo Trainers Revenue (undefined) Forecast, by Application 2020 & 2033
- Table 82: India Direct Drive Smart Turbo Trainers Volume (K) Forecast, by Application 2020 & 2033
- Table 83: Japan Direct Drive Smart Turbo Trainers Revenue (undefined) Forecast, by Application 2020 & 2033
- Table 84: Japan Direct Drive Smart Turbo Trainers Volume (K) Forecast, by Application 2020 & 2033
- Table 85: South Korea Direct Drive Smart Turbo Trainers Revenue (undefined) Forecast, by Application 2020 & 2033
- Table 86: South Korea Direct Drive Smart Turbo Trainers Volume (K) Forecast, by Application 2020 & 2033
- Table 87: ASEAN Direct Drive Smart Turbo Trainers Revenue (undefined) Forecast, by Application 2020 & 2033
- Table 88: ASEAN Direct Drive Smart Turbo Trainers Volume (K) Forecast, by Application 2020 & 2033
- Table 89: Oceania Direct Drive Smart Turbo Trainers Revenue (undefined) Forecast, by Application 2020 & 2033
- Table 90: Oceania Direct Drive Smart Turbo Trainers Volume (K) Forecast, by Application 2020 & 2033
- Table 91: Rest of Asia Pacific Direct Drive Smart Turbo Trainers Revenue (undefined) Forecast, by Application 2020 & 2033
- Table 92: Rest of Asia Pacific Direct Drive Smart Turbo Trainers Volume (K) Forecast, by Application 2020 & 2033
Frequently Asked Questions
1. What is the projected Compound Annual Growth Rate (CAGR) of the Direct Drive Smart Turbo Trainers?
The projected CAGR is approximately 7.5%.
2. Which companies are prominent players in the Direct Drive Smart Turbo Trainers?
Key companies in the market include Wahoo Fitness, Technogym, Garmin, Elite, Saris, Minoura, Sunlite, BKOOL, Kinetic.
3. What are the main segments of the Direct Drive Smart Turbo Trainers?
The market segments include Application, Types.
4. Can you provide details about the market size?
The market size is estimated to be USD XXX N/A as of 2022.
5. What are some drivers contributing to market growth?
N/A
6. What are the notable trends driving market growth?
N/A
7. Are there any restraints impacting market growth?
N/A
8. Can you provide examples of recent developments in the market?
N/A
9. What pricing options are available for accessing the report?
Pricing options include single-user, multi-user, and enterprise licenses priced at USD 3950.00, USD 5925.00, and USD 7900.00 respectively.
10. Is the market size provided in terms of value or volume?
The market size is provided in terms of value, measured in N/A and volume, measured in K.
11. Are there any specific market keywords associated with the report?
Yes, the market keyword associated with the report is "Direct Drive Smart Turbo Trainers," which aids in identifying and referencing the specific market segment covered.
12. How do I determine which pricing option suits my needs best?
The pricing options vary based on user requirements and access needs. Individual users may opt for single-user licenses, while businesses requiring broader access may choose multi-user or enterprise licenses for cost-effective access to the report.
13. Are there any additional resources or data provided in the Direct Drive Smart Turbo Trainers report?
While the report offers comprehensive insights, it's advisable to review the specific contents or supplementary materials provided to ascertain if additional resources or data are available.
14. How can I stay updated on further developments or reports in the Direct Drive Smart Turbo Trainers?
To stay informed about further developments, trends, and reports in the Direct Drive Smart Turbo Trainers, consider subscribing to industry newsletters, following relevant companies and organizations, or regularly checking reputable industry news sources and publications.
Methodology
Step 1 - Identification of Relevant Samples Size from Population Database


Step 2 - Approaches for Defining Global Market Size (Value, Volume* & Price*)

Note*: In applicable scenarios
Step 3 - Data Sources
Primary Research
- Web Analytics
- Survey Reports
- Research Institute
- Latest Research Reports
- Opinion Leaders
Secondary Research
- Annual Reports
- White Paper
- Latest Press Release
- Industry Association
- Paid Database
- Investor Presentations

Step 4 - Data Triangulation
Involves using different sources of information in order to increase the validity of a study
These sources are likely to be stakeholders in a program - participants, other researchers, program staff, other community members, and so on.
Then we put all data in single framework & apply various statistical tools to find out the dynamic on the market.
During the analysis stage, feedback from the stakeholder groups would be compared to determine areas of agreement as well as areas of divergence