
Key Insights
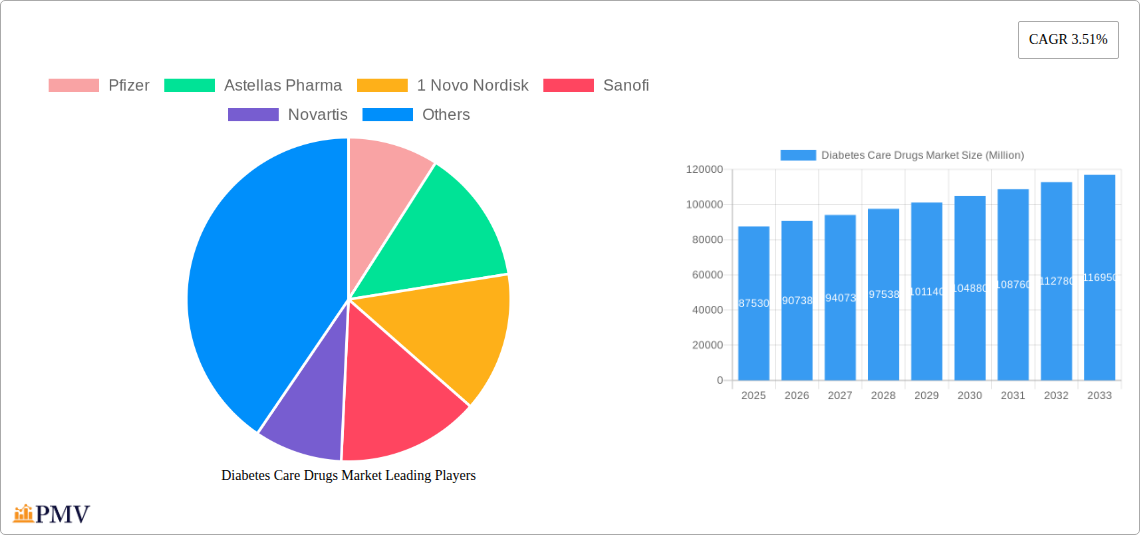
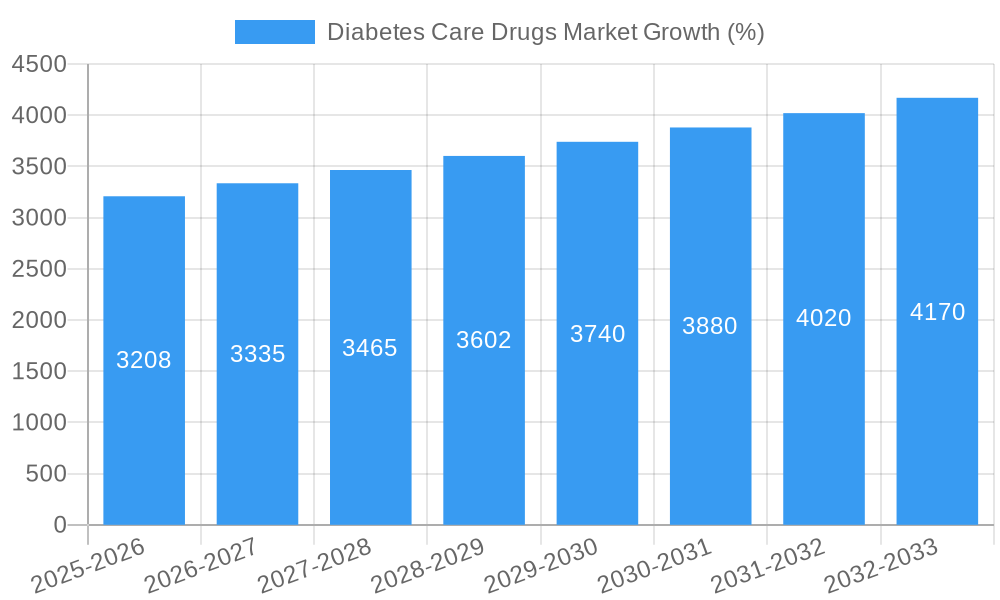
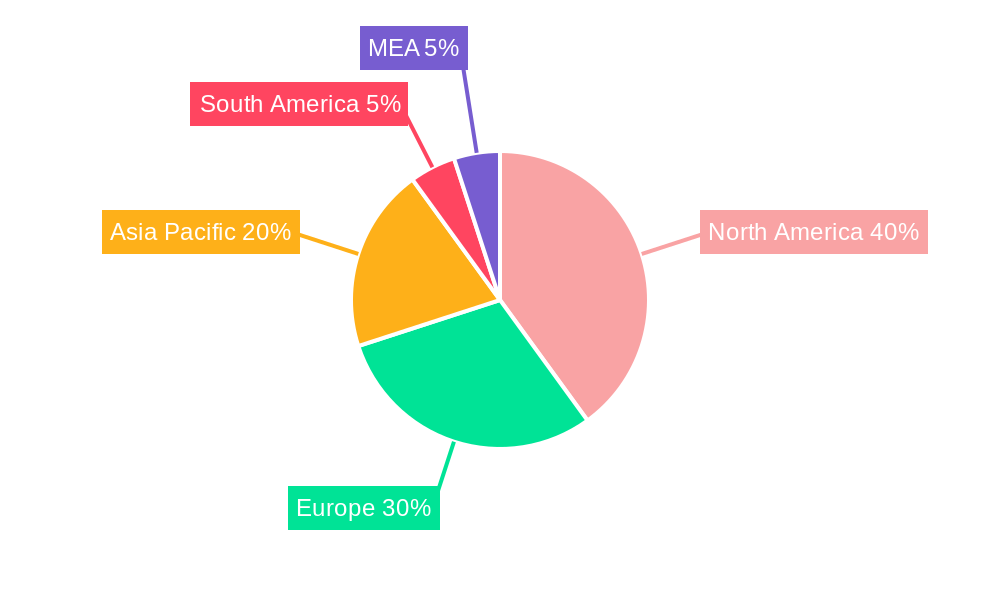
The global Diabetes Care Drugs market, valued at $87.53 billion in 2025, is projected to experience steady growth, driven by rising prevalence of diabetes worldwide, an aging population, and increasing awareness of the disease. The market's Compound Annual Growth Rate (CAGR) of 3.51% from 2025 to 2033 indicates a consistent expansion, although this rate may be influenced by factors like the introduction of novel therapies, pricing pressures, and the adoption of cost-effective treatment strategies. Key growth drivers include the increasing availability of innovative insulin analogs (such as Lantus, Levemir, and Tresiba), oral hypoglycemic agents (metformin, SGLT-2 inhibitors, DPP-4 inhibitors, and GLP-1 receptor agonists), and the expanding biosimilar insulin market. The market segmentation reveals strong performance across various drug classes, with insulin (both basal/long-acting and bolus/fast-acting) and oral combinations holding significant market shares. The distribution channel is also a critical factor, with both online and offline channels contributing to market expansion. Geographical variations exist, with North America and Europe currently dominating the market due to higher prevalence rates and robust healthcare infrastructure; however, Asia Pacific is expected to show significant growth potential in the coming years due to increasing diabetes diagnoses in rapidly developing economies.
Market restraints include the high cost of treatment, potential side effects associated with certain drugs, and the need for patient adherence to complex treatment regimens. The emergence of biosimilars presents both opportunities and challenges; while offering cost-effective alternatives, they also create competitive pressures within the insulin market. Future growth will likely depend on advancements in drug development, including the potential for novel therapies targeting specific diabetes complications and personalized medicine approaches. The continued focus on prevention and early detection of diabetes, coupled with improved patient education and management strategies, will play a significant role in shaping the future landscape of the Diabetes Care Drugs market. Further research into the long-term efficacy and safety of emerging treatment options, along with efforts to enhance patient affordability and access, will be crucial for sustained market growth.
Diabetes Care Drugs Market: A Comprehensive Report (2019-2033)
This in-depth report provides a comprehensive analysis of the Diabetes Care Drugs Market, covering market structure, competitive dynamics, industry trends, dominant segments, product innovations, and future outlook. The report utilizes data from the historical period (2019-2024), base year (2025), and estimated year (2025) to project market trends through 2033. The study period encompasses 2019-2033, with a forecast period of 2025-2033. This report is essential for stakeholders seeking actionable insights into this rapidly evolving market.
Diabetes Care Drugs Market Market Structure & Competitive Dynamics
The Diabetes Care Drugs Market is characterized by a moderately concentrated structure, with key players like Novo Nordisk, Sanofi, Eli Lilly and Company, and Pfizer holding significant market share. The market exhibits a dynamic competitive landscape marked by continuous innovation, strategic alliances, and mergers and acquisitions (M&A) activities. Regulatory frameworks, particularly regarding drug approvals and pricing, significantly influence market dynamics. The availability of substitute therapies, such as lifestyle modifications and alternative treatment approaches, also affects market growth. End-user trends, such as increasing adoption of advanced therapies and personalized medicine, are shaping the market.
- Market Concentration: The top 5 players account for approximately xx% of the global market share in 2025.
- M&A Activity: Recent years have witnessed significant M&A activity, including Novo Nordisk's acquisition of Inversago Pharma for up to $1,075 Million in August 2023, indicating a consolidation trend within the industry. Further significant deals valued at xx Million are expected during the forecast period.
- Innovation Ecosystems: A robust innovation ecosystem characterized by collaboration between pharmaceutical companies, research institutions, and biotech startups drives the development of novel diabetes care drugs.
- Regulatory Frameworks: Stringent regulatory requirements for drug approval and pricing policies influence market access and profitability.
- Product Substitutes: Lifestyle changes, such as diet and exercise, and alternative therapies compete with pharmaceutical interventions.
Diabetes Care Drugs Market Industry Trends & Insights
The Diabetes Care Drugs Market is projected to experience substantial growth during the forecast period (2025-2033), driven by several factors. The rising prevalence of diabetes globally, particularly type 2 diabetes, is a primary growth driver. Technological advancements, such as the development of novel drug classes and improved drug delivery systems, are further boosting market expansion. Increasing consumer preference for convenient and effective treatments is also contributing to market growth. However, competitive pressures from biosimilars and generic drugs pose a challenge.
The market is expected to exhibit a CAGR of xx% during the forecast period. Market penetration of newer drug classes, such as GLP-1 receptor agonists and SGLT-2 inhibitors, is steadily increasing. Growing awareness of diabetes and its complications is also driving demand for effective treatments. The increasing adoption of telemedicine and remote patient monitoring is impacting the delivery of diabetes care. The market is experiencing an increasing focus on the development of personalized medicine approaches, adapting treatment strategies to individual patient needs. The shift towards value-based healthcare models is influencing pricing and reimbursement strategies for diabetes care drugs.
Dominant Markets & Segments in Diabetes Care Drugs Market
The North American region currently holds the largest market share in the Diabetes Care Drugs Market, driven by high prevalence of diabetes, advanced healthcare infrastructure, and strong pharmaceutical industry presence. Within specific segments, Insulin drugs maintain a considerable market share. However, the GLP-1 receptor agonists and SGLT-2 inhibitors segments are witnessing significant growth due to their efficacy and safety profiles. The oral route of administration remains the most common, while subcutaneous and intravenous routes are also seeing increasing adoption.
Key Drivers of Regional Dominance:
- High Prevalence of Diabetes: North America reports a higher incidence of type 2 diabetes compared to other regions.
- Robust Healthcare Infrastructure: Access to advanced diagnostic and treatment facilities supports market growth.
- Strong Pharmaceutical Industry Presence: Major pharmaceutical companies have a strong footprint in the region, leading to increased R&D efforts and product launches.
Dominant Segments:
- Insulin Drugs: Basal or long-acting insulins (Lantus, Levemir, Tresiba) and bolus or fast-acting insulins (NovoRapid, Humalog) are widely used. Traditional human insulin (Novolin, Humulin) also holds a significant market share. The biosimilar insulin segment is witnessing rapid growth. The combination insulin segment, with products like NovoMix and Xultophy, is showing a promising trajectory.
- Oral Anti-diabetic Drugs: This segment includes Biguanides (Metformin), DPP-4 Inhibitors (Januvia, Onglyza), and SGLT-2 Inhibitors (Invokana, Jardiance, Farxiga). Oral combination therapy (Janumet) is also increasingly adopted. The demand for these drugs is high due to their convenience.
- Non-insulin Injectable Drugs: This segment, including GLP-1 receptor agonists and Amylin analogues like Symlin, offers a range of therapy options for patients.
- Distribution Channels: While offline channels like pharmacies and hospitals remain dominant, online channels are witnessing growth.
Diabetes Care Drugs Market Product Innovations
The Diabetes Care Drugs Market is witnessing significant product innovations, driven by advancements in drug delivery systems and the development of novel drug classes. The emergence of biosimilar insulins offers cost-effective alternatives to branded drugs. Technological trends such as personalized medicine, focusing on individual patient characteristics to optimize treatment, are gaining prominence. The market is experiencing increasing research towards developing long-acting, once-weekly or even once-monthly insulin formulations, aiming to enhance patient convenience and compliance. Innovative drug combinations aiming to improve glycemic control are showing promise. The focus on improving patient safety and reducing adverse effects is a key driver of innovation.
Report Segmentation & Scope
This report segments the Diabetes Care Drugs Market by various factors, including drug type (Insulin, Oral Anti-diabetic drugs, Non-insulin Injectable Drugs), route of administration (Oral, Subcutaneous, Intravenous), distribution channel (Online, Offline), and specific drug classes (e.g., GLP-1 receptor agonists, SGLT-2 inhibitors, DPP-4 inhibitors). Each segment's growth projections, market size, and competitive dynamics are analyzed. The market is further segmented by region and country to provide a detailed geographic analysis.
Key Drivers of Diabetes Care Drugs Market Growth
Several factors contribute to the growth of the Diabetes Care Drugs Market. The rising prevalence of diabetes globally is a significant driver, fueled by factors like aging populations, sedentary lifestyles, and unhealthy diets. Technological advancements leading to the development of more effective and convenient therapies are boosting market growth. Favorable regulatory environments in some regions facilitate faster approvals and market entry. Increased awareness campaigns and improved access to healthcare also stimulate market expansion.
Challenges in the Diabetes Care Drugs Market Sector
The Diabetes Care Drugs Market faces challenges including stringent regulatory requirements for drug approval, leading to delays and increased costs. Supply chain disruptions and price pressures from generic and biosimilar drugs pose significant hurdles. The high cost of some advanced therapies can limit access for many patients. Intense competition among established pharmaceutical companies and emerging players creates a challenging market environment.
Leading Players in the Diabetes Care Drugs Market Market
- Pfizer
- Astellas Pharma
- Novo Nordisk
- Sanofi
- Novartis
- Eli Lilly and Company
- Teva Pharmaceuticals
- AstraZeneca
- Biocon
- Bristol Myers Squibb
- Mylan
- Johnson & Johnson
- Boehringer Ingelheim
- Insulin Drugs
- Merck & Co
Key Developments in Diabetes Care Drugs Market Sector
- October 2023: Sanofi announced promising Phase 3 data for TZIELD in slowing type 1 diabetes progression in children and adolescents, published in The New England Journal of Medicine.
- August 2023: Novo Nordisk acquired Inversago Pharma for up to $1,075 Million, expanding its portfolio in obesity and metabolic disorders.
Strategic Diabetes Care Drugs Market Market Outlook
The Diabetes Care Drugs Market is poised for continued growth, driven by the increasing prevalence of diabetes, ongoing technological advancements, and the emergence of novel therapies. Strategic opportunities exist in developing personalized medicine approaches, exploring innovative drug delivery systems, and focusing on cost-effective treatments. Companies can leverage collaborations and partnerships to accelerate innovation and improve market access. The market presents significant potential for companies that can effectively navigate regulatory hurdles and compete in a dynamic market environment.
Diabetes Care Drugs Market Segmentation
-
1. Drugs
- 1.1. Oral Anti-diabetic drugs
- 1.2. Non-insulin Injectable Drug
- 1.3. Insulin
-
2. Route of Administration
- 2.1. Oral
- 2.2. Subcutaneous
- 2.3. Intravenous
-
3. Distribution Channel
- 3.1. Online
- 3.2. Offline
Diabetes Care Drugs Market Segmentation By Geography
-
1. North America
- 1.1. United States
- 1.2. Canada
- 1.3. Rest of North America
-
2. Europe
- 2.1. France
- 2.2. Germany
- 2.3. Italy
- 2.4. Spain
- 2.5. United Kingdom
- 2.6. Russia
- 2.7. Rest of Europe
-
3. Latin America
- 3.1. Mexico
- 3.2. Brazil
- 3.3. Rest of Latin America
-
4. Asia Pacific
- 4.1. Japan
- 4.2. South Korea
- 4.3. China
- 4.4. India
- 4.5. Australia
- 4.6. Vietnam
- 4.7. Malaysia
- 4.8. Indonesia
- 4.9. Philippines
- 4.10. Thailand
- 4.11. Rest of Asia Pacific
-
5. Middle East and Africa
- 5.1. Saudi Arabia
- 5.2. Iran
- 5.3. Egypt
- 5.4. Oman
- 5.5. South Africa
- 5.6. Rest of Middle East and Africa
Diabetes Care Drugs Market REPORT HIGHLIGHTS
| Aspects | Details |
|---|---|
| Study Period | 2019-2033 |
| Base Year | 2024 |
| Estimated Year | 2025 |
| Forecast Period | 2025-2033 |
| Historical Period | 2019-2024 |
| Growth Rate | CAGR of 3.51% from 2019-2033 |
| Segmentation |
|
Table of Contents
- 1. Introduction
- 1.1. Research Scope
- 1.2. Market Segmentation
- 1.3. Research Methodology
- 1.4. Definitions and Assumptions
- 2. Executive Summary
- 2.1. Introduction
- 3. Market Dynamics
- 3.1. Introduction
- 3.2. Market Drivers
- 3.2.1. ; The Rise in Global Prevalence of Cases of Obesity due to Modern Sedentary Lifestyles; Rise in Awareness and Disposable Income in Developed Economies
- 3.3. Market Restrains
- 3.3.1 ; Highly Cost of Branded Products in Emerging Countries; Severe Adverse Associated with Medication Including Seizures
- 3.3.2 Suicidal Attempts and Even Death; Adoption of Traditional Yoga and Herbal Products
- 3.4. Market Trends
- 3.4.1. Insulin Drugs is Having the Highest Market Share in current year
- 4. Market Factor Analysis
- 4.1. Porters Five Forces
- 4.2. Supply/Value Chain
- 4.3. PESTEL analysis
- 4.4. Market Entropy
- 4.5. Patent/Trademark Analysis
- 5. Global Diabetes Care Drugs Market Analysis, Insights and Forecast, 2019-2031
- 5.1. Market Analysis, Insights and Forecast - by Drugs
- 5.1.1. Oral Anti-diabetic drugs
- 5.1.2. Non-insulin Injectable Drug
- 5.1.3. Insulin
- 5.2. Market Analysis, Insights and Forecast - by Route of Administration
- 5.2.1. Oral
- 5.2.2. Subcutaneous
- 5.2.3. Intravenous
- 5.3. Market Analysis, Insights and Forecast - by Distribution Channel
- 5.3.1. Online
- 5.3.2. Offline
- 5.4. Market Analysis, Insights and Forecast - by Region
- 5.4.1. North America
- 5.4.2. Europe
- 5.4.3. Latin America
- 5.4.4. Asia Pacific
- 5.4.5. Middle East and Africa
- 5.1. Market Analysis, Insights and Forecast - by Drugs
- 6. North America Diabetes Care Drugs Market Analysis, Insights and Forecast, 2019-2031
- 6.1. Market Analysis, Insights and Forecast - by Drugs
- 6.1.1. Oral Anti-diabetic drugs
- 6.1.2. Non-insulin Injectable Drug
- 6.1.3. Insulin
- 6.2. Market Analysis, Insights and Forecast - by Route of Administration
- 6.2.1. Oral
- 6.2.2. Subcutaneous
- 6.2.3. Intravenous
- 6.3. Market Analysis, Insights and Forecast - by Distribution Channel
- 6.3.1. Online
- 6.3.2. Offline
- 6.1. Market Analysis, Insights and Forecast - by Drugs
- 7. Europe Diabetes Care Drugs Market Analysis, Insights and Forecast, 2019-2031
- 7.1. Market Analysis, Insights and Forecast - by Drugs
- 7.1.1. Oral Anti-diabetic drugs
- 7.1.2. Non-insulin Injectable Drug
- 7.1.3. Insulin
- 7.2. Market Analysis, Insights and Forecast - by Route of Administration
- 7.2.1. Oral
- 7.2.2. Subcutaneous
- 7.2.3. Intravenous
- 7.3. Market Analysis, Insights and Forecast - by Distribution Channel
- 7.3.1. Online
- 7.3.2. Offline
- 7.1. Market Analysis, Insights and Forecast - by Drugs
- 8. Latin America Diabetes Care Drugs Market Analysis, Insights and Forecast, 2019-2031
- 8.1. Market Analysis, Insights and Forecast - by Drugs
- 8.1.1. Oral Anti-diabetic drugs
- 8.1.2. Non-insulin Injectable Drug
- 8.1.3. Insulin
- 8.2. Market Analysis, Insights and Forecast - by Route of Administration
- 8.2.1. Oral
- 8.2.2. Subcutaneous
- 8.2.3. Intravenous
- 8.3. Market Analysis, Insights and Forecast - by Distribution Channel
- 8.3.1. Online
- 8.3.2. Offline
- 8.1. Market Analysis, Insights and Forecast - by Drugs
- 9. Asia Pacific Diabetes Care Drugs Market Analysis, Insights and Forecast, 2019-2031
- 9.1. Market Analysis, Insights and Forecast - by Drugs
- 9.1.1. Oral Anti-diabetic drugs
- 9.1.2. Non-insulin Injectable Drug
- 9.1.3. Insulin
- 9.2. Market Analysis, Insights and Forecast - by Route of Administration
- 9.2.1. Oral
- 9.2.2. Subcutaneous
- 9.2.3. Intravenous
- 9.3. Market Analysis, Insights and Forecast - by Distribution Channel
- 9.3.1. Online
- 9.3.2. Offline
- 9.1. Market Analysis, Insights and Forecast - by Drugs
- 10. Middle East and Africa Diabetes Care Drugs Market Analysis, Insights and Forecast, 2019-2031
- 10.1. Market Analysis, Insights and Forecast - by Drugs
- 10.1.1. Oral Anti-diabetic drugs
- 10.1.2. Non-insulin Injectable Drug
- 10.1.3. Insulin
- 10.2. Market Analysis, Insights and Forecast - by Route of Administration
- 10.2.1. Oral
- 10.2.2. Subcutaneous
- 10.2.3. Intravenous
- 10.3. Market Analysis, Insights and Forecast - by Distribution Channel
- 10.3.1. Online
- 10.3.2. Offline
- 10.1. Market Analysis, Insights and Forecast - by Drugs
- 11. North America Diabetes Care Drugs Market Analysis, Insights and Forecast, 2019-2031
- 11.1. Market Analysis, Insights and Forecast - By Country/Sub-region
- 11.1.1 United States
- 11.1.2 Canada
- 11.1.3 Mexico
- 12. Europe Diabetes Care Drugs Market Analysis, Insights and Forecast, 2019-2031
- 12.1. Market Analysis, Insights and Forecast - By Country/Sub-region
- 12.1.1 Germany
- 12.1.2 United Kingdom
- 12.1.3 France
- 12.1.4 Spain
- 12.1.5 Italy
- 12.1.6 Spain
- 12.1.7 Belgium
- 12.1.8 Netherland
- 12.1.9 Nordics
- 12.1.10 Rest of Europe
- 13. Asia Pacific Diabetes Care Drugs Market Analysis, Insights and Forecast, 2019-2031
- 13.1. Market Analysis, Insights and Forecast - By Country/Sub-region
- 13.1.1 China
- 13.1.2 Japan
- 13.1.3 India
- 13.1.4 South Korea
- 13.1.5 Southeast Asia
- 13.1.6 Australia
- 13.1.7 Indonesia
- 13.1.8 Phillipes
- 13.1.9 Singapore
- 13.1.10 Thailandc
- 13.1.11 Rest of Asia Pacific
- 14. South America Diabetes Care Drugs Market Analysis, Insights and Forecast, 2019-2031
- 14.1. Market Analysis, Insights and Forecast - By Country/Sub-region
- 14.1.1 Brazil
- 14.1.2 Argentina
- 14.1.3 Peru
- 14.1.4 Chile
- 14.1.5 Colombia
- 14.1.6 Ecuador
- 14.1.7 Venezuela
- 14.1.8 Rest of South America
- 15. North America Diabetes Care Drugs Market Analysis, Insights and Forecast, 2019-2031
- 15.1. Market Analysis, Insights and Forecast - By Country/Sub-region
- 15.1.1 United States
- 15.1.2 Canada
- 15.1.3 Mexico
- 16. MEA Diabetes Care Drugs Market Analysis, Insights and Forecast, 2019-2031
- 16.1. Market Analysis, Insights and Forecast - By Country/Sub-region
- 16.1.1 United Arab Emirates
- 16.1.2 Saudi Arabia
- 16.1.3 South Africa
- 16.1.4 Rest of Middle East and Africa
- 17. Competitive Analysis
- 17.1. Global Market Share Analysis 2024
- 17.2. Company Profiles
- 17.2.1 Pfizer
- 17.2.1.1. Overview
- 17.2.1.2. Products
- 17.2.1.3. SWOT Analysis
- 17.2.1.4. Recent Developments
- 17.2.1.5. Financials (Based on Availability)
- 17.2.2 Astellas Pharma
- 17.2.2.1. Overview
- 17.2.2.2. Products
- 17.2.2.3. SWOT Analysis
- 17.2.2.4. Recent Developments
- 17.2.2.5. Financials (Based on Availability)
- 17.2.3 1 Novo Nordisk
- 17.2.3.1. Overview
- 17.2.3.2. Products
- 17.2.3.3. SWOT Analysis
- 17.2.3.4. Recent Developments
- 17.2.3.5. Financials (Based on Availability)
- 17.2.4 Sanofi
- 17.2.4.1. Overview
- 17.2.4.2. Products
- 17.2.4.3. SWOT Analysis
- 17.2.4.4. Recent Developments
- 17.2.4.5. Financials (Based on Availability)
- 17.2.5 Novartis
- 17.2.5.1. Overview
- 17.2.5.2. Products
- 17.2.5.3. SWOT Analysis
- 17.2.5.4. Recent Developments
- 17.2.5.5. Financials (Based on Availability)
- 17.2.6 2 Sanofi
- 17.2.6.1. Overview
- 17.2.6.2. Products
- 17.2.6.3. SWOT Analysis
- 17.2.6.4. Recent Developments
- 17.2.6.5. Financials (Based on Availability)
- 17.2.7 3 Eli Lilly and Company
- 17.2.7.1. Overview
- 17.2.7.2. Products
- 17.2.7.3. SWOT Analysis
- 17.2.7.4. Recent Developments
- 17.2.7.5. Financials (Based on Availability)
- 17.2.8 Teva Pharmaceuticals
- 17.2.8.1. Overview
- 17.2.8.2. Products
- 17.2.8.3. SWOT Analysis
- 17.2.8.4. Recent Developments
- 17.2.8.5. Financials (Based on Availability)
- 17.2.9 Eli Lilly and Company
- 17.2.9.1. Overview
- 17.2.9.2. Products
- 17.2.9.3. SWOT Analysis
- 17.2.9.4. Recent Developments
- 17.2.9.5. Financials (Based on Availability)
- 17.2.10 AstraZeneca
- 17.2.10.1. Overview
- 17.2.10.2. Products
- 17.2.10.3. SWOT Analysis
- 17.2.10.4. Recent Developments
- 17.2.10.5. Financials (Based on Availability)
- 17.2.11 Biocon
- 17.2.11.1. Overview
- 17.2.11.2. Products
- 17.2.11.3. SWOT Analysis
- 17.2.11.4. Recent Developments
- 17.2.11.5. Financials (Based on Availability)
- 17.2.12 Bristol Myers Squibb
- 17.2.12.1. Overview
- 17.2.12.2. Products
- 17.2.12.3. SWOT Analysis
- 17.2.12.4. Recent Developments
- 17.2.12.5. Financials (Based on Availability)
- 17.2.13 Novo Nordisk
- 17.2.13.1. Overview
- 17.2.13.2. Products
- 17.2.13.3. SWOT Analysis
- 17.2.13.4. Recent Developments
- 17.2.13.5. Financials (Based on Availability)
- 17.2.14 Mylan
- 17.2.14.1. Overview
- 17.2.14.2. Products
- 17.2.14.3. SWOT Analysis
- 17.2.14.4. Recent Developments
- 17.2.14.5. Financials (Based on Availability)
- 17.2.15 Johnson & Johnson
- 17.2.15.1. Overview
- 17.2.15.2. Products
- 17.2.15.3. SWOT Analysis
- 17.2.15.4. Recent Developments
- 17.2.15.5. Financials (Based on Availability)
- 17.2.16 Boehringer Ingelheim
- 17.2.16.1. Overview
- 17.2.16.2. Products
- 17.2.16.3. SWOT Analysis
- 17.2.16.4. Recent Developments
- 17.2.16.5. Financials (Based on Availability)
- 17.2.17 Insulin Drugs
- 17.2.17.1. Overview
- 17.2.17.2. Products
- 17.2.17.3. SWOT Analysis
- 17.2.17.4. Recent Developments
- 17.2.17.5. Financials (Based on Availability)
- 17.2.18 Merck & Co
- 17.2.18.1. Overview
- 17.2.18.2. Products
- 17.2.18.3. SWOT Analysis
- 17.2.18.4. Recent Developments
- 17.2.18.5. Financials (Based on Availability)
- 17.2.1 Pfizer
List of Figures
- Figure 1: Global Diabetes Care Drugs Market Revenue Breakdown (Million, %) by Region 2024 & 2032
- Figure 2: Global Diabetes Care Drugs Market Volume Breakdown (K Unit, %) by Region 2024 & 2032
- Figure 3: North America Diabetes Care Drugs Market Revenue (Million), by Country 2024 & 2032
- Figure 4: North America Diabetes Care Drugs Market Volume (K Unit), by Country 2024 & 2032
- Figure 5: North America Diabetes Care Drugs Market Revenue Share (%), by Country 2024 & 2032
- Figure 6: North America Diabetes Care Drugs Market Volume Share (%), by Country 2024 & 2032
- Figure 7: Europe Diabetes Care Drugs Market Revenue (Million), by Country 2024 & 2032
- Figure 8: Europe Diabetes Care Drugs Market Volume (K Unit), by Country 2024 & 2032
- Figure 9: Europe Diabetes Care Drugs Market Revenue Share (%), by Country 2024 & 2032
- Figure 10: Europe Diabetes Care Drugs Market Volume Share (%), by Country 2024 & 2032
- Figure 11: Asia Pacific Diabetes Care Drugs Market Revenue (Million), by Country 2024 & 2032
- Figure 12: Asia Pacific Diabetes Care Drugs Market Volume (K Unit), by Country 2024 & 2032
- Figure 13: Asia Pacific Diabetes Care Drugs Market Revenue Share (%), by Country 2024 & 2032
- Figure 14: Asia Pacific Diabetes Care Drugs Market Volume Share (%), by Country 2024 & 2032
- Figure 15: South America Diabetes Care Drugs Market Revenue (Million), by Country 2024 & 2032
- Figure 16: South America Diabetes Care Drugs Market Volume (K Unit), by Country 2024 & 2032
- Figure 17: South America Diabetes Care Drugs Market Revenue Share (%), by Country 2024 & 2032
- Figure 18: South America Diabetes Care Drugs Market Volume Share (%), by Country 2024 & 2032
- Figure 19: North America Diabetes Care Drugs Market Revenue (Million), by Country 2024 & 2032
- Figure 20: North America Diabetes Care Drugs Market Volume (K Unit), by Country 2024 & 2032
- Figure 21: North America Diabetes Care Drugs Market Revenue Share (%), by Country 2024 & 2032
- Figure 22: North America Diabetes Care Drugs Market Volume Share (%), by Country 2024 & 2032
- Figure 23: MEA Diabetes Care Drugs Market Revenue (Million), by Country 2024 & 2032
- Figure 24: MEA Diabetes Care Drugs Market Volume (K Unit), by Country 2024 & 2032
- Figure 25: MEA Diabetes Care Drugs Market Revenue Share (%), by Country 2024 & 2032
- Figure 26: MEA Diabetes Care Drugs Market Volume Share (%), by Country 2024 & 2032
- Figure 27: North America Diabetes Care Drugs Market Revenue (Million), by Drugs 2024 & 2032
- Figure 28: North America Diabetes Care Drugs Market Volume (K Unit), by Drugs 2024 & 2032
- Figure 29: North America Diabetes Care Drugs Market Revenue Share (%), by Drugs 2024 & 2032
- Figure 30: North America Diabetes Care Drugs Market Volume Share (%), by Drugs 2024 & 2032
- Figure 31: North America Diabetes Care Drugs Market Revenue (Million), by Route of Administration 2024 & 2032
- Figure 32: North America Diabetes Care Drugs Market Volume (K Unit), by Route of Administration 2024 & 2032
- Figure 33: North America Diabetes Care Drugs Market Revenue Share (%), by Route of Administration 2024 & 2032
- Figure 34: North America Diabetes Care Drugs Market Volume Share (%), by Route of Administration 2024 & 2032
- Figure 35: North America Diabetes Care Drugs Market Revenue (Million), by Distribution Channel 2024 & 2032
- Figure 36: North America Diabetes Care Drugs Market Volume (K Unit), by Distribution Channel 2024 & 2032
- Figure 37: North America Diabetes Care Drugs Market Revenue Share (%), by Distribution Channel 2024 & 2032
- Figure 38: North America Diabetes Care Drugs Market Volume Share (%), by Distribution Channel 2024 & 2032
- Figure 39: North America Diabetes Care Drugs Market Revenue (Million), by Country 2024 & 2032
- Figure 40: North America Diabetes Care Drugs Market Volume (K Unit), by Country 2024 & 2032
- Figure 41: North America Diabetes Care Drugs Market Revenue Share (%), by Country 2024 & 2032
- Figure 42: North America Diabetes Care Drugs Market Volume Share (%), by Country 2024 & 2032
- Figure 43: Europe Diabetes Care Drugs Market Revenue (Million), by Drugs 2024 & 2032
- Figure 44: Europe Diabetes Care Drugs Market Volume (K Unit), by Drugs 2024 & 2032
- Figure 45: Europe Diabetes Care Drugs Market Revenue Share (%), by Drugs 2024 & 2032
- Figure 46: Europe Diabetes Care Drugs Market Volume Share (%), by Drugs 2024 & 2032
- Figure 47: Europe Diabetes Care Drugs Market Revenue (Million), by Route of Administration 2024 & 2032
- Figure 48: Europe Diabetes Care Drugs Market Volume (K Unit), by Route of Administration 2024 & 2032
- Figure 49: Europe Diabetes Care Drugs Market Revenue Share (%), by Route of Administration 2024 & 2032
- Figure 50: Europe Diabetes Care Drugs Market Volume Share (%), by Route of Administration 2024 & 2032
- Figure 51: Europe Diabetes Care Drugs Market Revenue (Million), by Distribution Channel 2024 & 2032
- Figure 52: Europe Diabetes Care Drugs Market Volume (K Unit), by Distribution Channel 2024 & 2032
- Figure 53: Europe Diabetes Care Drugs Market Revenue Share (%), by Distribution Channel 2024 & 2032
- Figure 54: Europe Diabetes Care Drugs Market Volume Share (%), by Distribution Channel 2024 & 2032
- Figure 55: Europe Diabetes Care Drugs Market Revenue (Million), by Country 2024 & 2032
- Figure 56: Europe Diabetes Care Drugs Market Volume (K Unit), by Country 2024 & 2032
- Figure 57: Europe Diabetes Care Drugs Market Revenue Share (%), by Country 2024 & 2032
- Figure 58: Europe Diabetes Care Drugs Market Volume Share (%), by Country 2024 & 2032
- Figure 59: Latin America Diabetes Care Drugs Market Revenue (Million), by Drugs 2024 & 2032
- Figure 60: Latin America Diabetes Care Drugs Market Volume (K Unit), by Drugs 2024 & 2032
- Figure 61: Latin America Diabetes Care Drugs Market Revenue Share (%), by Drugs 2024 & 2032
- Figure 62: Latin America Diabetes Care Drugs Market Volume Share (%), by Drugs 2024 & 2032
- Figure 63: Latin America Diabetes Care Drugs Market Revenue (Million), by Route of Administration 2024 & 2032
- Figure 64: Latin America Diabetes Care Drugs Market Volume (K Unit), by Route of Administration 2024 & 2032
- Figure 65: Latin America Diabetes Care Drugs Market Revenue Share (%), by Route of Administration 2024 & 2032
- Figure 66: Latin America Diabetes Care Drugs Market Volume Share (%), by Route of Administration 2024 & 2032
- Figure 67: Latin America Diabetes Care Drugs Market Revenue (Million), by Distribution Channel 2024 & 2032
- Figure 68: Latin America Diabetes Care Drugs Market Volume (K Unit), by Distribution Channel 2024 & 2032
- Figure 69: Latin America Diabetes Care Drugs Market Revenue Share (%), by Distribution Channel 2024 & 2032
- Figure 70: Latin America Diabetes Care Drugs Market Volume Share (%), by Distribution Channel 2024 & 2032
- Figure 71: Latin America Diabetes Care Drugs Market Revenue (Million), by Country 2024 & 2032
- Figure 72: Latin America Diabetes Care Drugs Market Volume (K Unit), by Country 2024 & 2032
- Figure 73: Latin America Diabetes Care Drugs Market Revenue Share (%), by Country 2024 & 2032
- Figure 74: Latin America Diabetes Care Drugs Market Volume Share (%), by Country 2024 & 2032
- Figure 75: Asia Pacific Diabetes Care Drugs Market Revenue (Million), by Drugs 2024 & 2032
- Figure 76: Asia Pacific Diabetes Care Drugs Market Volume (K Unit), by Drugs 2024 & 2032
- Figure 77: Asia Pacific Diabetes Care Drugs Market Revenue Share (%), by Drugs 2024 & 2032
- Figure 78: Asia Pacific Diabetes Care Drugs Market Volume Share (%), by Drugs 2024 & 2032
- Figure 79: Asia Pacific Diabetes Care Drugs Market Revenue (Million), by Route of Administration 2024 & 2032
- Figure 80: Asia Pacific Diabetes Care Drugs Market Volume (K Unit), by Route of Administration 2024 & 2032
- Figure 81: Asia Pacific Diabetes Care Drugs Market Revenue Share (%), by Route of Administration 2024 & 2032
- Figure 82: Asia Pacific Diabetes Care Drugs Market Volume Share (%), by Route of Administration 2024 & 2032
- Figure 83: Asia Pacific Diabetes Care Drugs Market Revenue (Million), by Distribution Channel 2024 & 2032
- Figure 84: Asia Pacific Diabetes Care Drugs Market Volume (K Unit), by Distribution Channel 2024 & 2032
- Figure 85: Asia Pacific Diabetes Care Drugs Market Revenue Share (%), by Distribution Channel 2024 & 2032
- Figure 86: Asia Pacific Diabetes Care Drugs Market Volume Share (%), by Distribution Channel 2024 & 2032
- Figure 87: Asia Pacific Diabetes Care Drugs Market Revenue (Million), by Country 2024 & 2032
- Figure 88: Asia Pacific Diabetes Care Drugs Market Volume (K Unit), by Country 2024 & 2032
- Figure 89: Asia Pacific Diabetes Care Drugs Market Revenue Share (%), by Country 2024 & 2032
- Figure 90: Asia Pacific Diabetes Care Drugs Market Volume Share (%), by Country 2024 & 2032
- Figure 91: Middle East and Africa Diabetes Care Drugs Market Revenue (Million), by Drugs 2024 & 2032
- Figure 92: Middle East and Africa Diabetes Care Drugs Market Volume (K Unit), by Drugs 2024 & 2032
- Figure 93: Middle East and Africa Diabetes Care Drugs Market Revenue Share (%), by Drugs 2024 & 2032
- Figure 94: Middle East and Africa Diabetes Care Drugs Market Volume Share (%), by Drugs 2024 & 2032
- Figure 95: Middle East and Africa Diabetes Care Drugs Market Revenue (Million), by Route of Administration 2024 & 2032
- Figure 96: Middle East and Africa Diabetes Care Drugs Market Volume (K Unit), by Route of Administration 2024 & 2032
- Figure 97: Middle East and Africa Diabetes Care Drugs Market Revenue Share (%), by Route of Administration 2024 & 2032
- Figure 98: Middle East and Africa Diabetes Care Drugs Market Volume Share (%), by Route of Administration 2024 & 2032
- Figure 99: Middle East and Africa Diabetes Care Drugs Market Revenue (Million), by Distribution Channel 2024 & 2032
- Figure 100: Middle East and Africa Diabetes Care Drugs Market Volume (K Unit), by Distribution Channel 2024 & 2032
- Figure 101: Middle East and Africa Diabetes Care Drugs Market Revenue Share (%), by Distribution Channel 2024 & 2032
- Figure 102: Middle East and Africa Diabetes Care Drugs Market Volume Share (%), by Distribution Channel 2024 & 2032
- Figure 103: Middle East and Africa Diabetes Care Drugs Market Revenue (Million), by Country 2024 & 2032
- Figure 104: Middle East and Africa Diabetes Care Drugs Market Volume (K Unit), by Country 2024 & 2032
- Figure 105: Middle East and Africa Diabetes Care Drugs Market Revenue Share (%), by Country 2024 & 2032
- Figure 106: Middle East and Africa Diabetes Care Drugs Market Volume Share (%), by Country 2024 & 2032
List of Tables
- Table 1: Global Diabetes Care Drugs Market Revenue Million Forecast, by Region 2019 & 2032
- Table 2: Global Diabetes Care Drugs Market Volume K Unit Forecast, by Region 2019 & 2032
- Table 3: Global Diabetes Care Drugs Market Revenue Million Forecast, by Drugs 2019 & 2032
- Table 4: Global Diabetes Care Drugs Market Volume K Unit Forecast, by Drugs 2019 & 2032
- Table 5: Global Diabetes Care Drugs Market Revenue Million Forecast, by Route of Administration 2019 & 2032
- Table 6: Global Diabetes Care Drugs Market Volume K Unit Forecast, by Route of Administration 2019 & 2032
- Table 7: Global Diabetes Care Drugs Market Revenue Million Forecast, by Distribution Channel 2019 & 2032
- Table 8: Global Diabetes Care Drugs Market Volume K Unit Forecast, by Distribution Channel 2019 & 2032
- Table 9: Global Diabetes Care Drugs Market Revenue Million Forecast, by Region 2019 & 2032
- Table 10: Global Diabetes Care Drugs Market Volume K Unit Forecast, by Region 2019 & 2032
- Table 11: Global Diabetes Care Drugs Market Revenue Million Forecast, by Country 2019 & 2032
- Table 12: Global Diabetes Care Drugs Market Volume K Unit Forecast, by Country 2019 & 2032
- Table 13: United States Diabetes Care Drugs Market Revenue (Million) Forecast, by Application 2019 & 2032
- Table 14: United States Diabetes Care Drugs Market Volume (K Unit) Forecast, by Application 2019 & 2032
- Table 15: Canada Diabetes Care Drugs Market Revenue (Million) Forecast, by Application 2019 & 2032
- Table 16: Canada Diabetes Care Drugs Market Volume (K Unit) Forecast, by Application 2019 & 2032
- Table 17: Mexico Diabetes Care Drugs Market Revenue (Million) Forecast, by Application 2019 & 2032
- Table 18: Mexico Diabetes Care Drugs Market Volume (K Unit) Forecast, by Application 2019 & 2032
- Table 19: Global Diabetes Care Drugs Market Revenue Million Forecast, by Country 2019 & 2032
- Table 20: Global Diabetes Care Drugs Market Volume K Unit Forecast, by Country 2019 & 2032
- Table 21: Germany Diabetes Care Drugs Market Revenue (Million) Forecast, by Application 2019 & 2032
- Table 22: Germany Diabetes Care Drugs Market Volume (K Unit) Forecast, by Application 2019 & 2032
- Table 23: United Kingdom Diabetes Care Drugs Market Revenue (Million) Forecast, by Application 2019 & 2032
- Table 24: United Kingdom Diabetes Care Drugs Market Volume (K Unit) Forecast, by Application 2019 & 2032
- Table 25: France Diabetes Care Drugs Market Revenue (Million) Forecast, by Application 2019 & 2032
- Table 26: France Diabetes Care Drugs Market Volume (K Unit) Forecast, by Application 2019 & 2032
- Table 27: Spain Diabetes Care Drugs Market Revenue (Million) Forecast, by Application 2019 & 2032
- Table 28: Spain Diabetes Care Drugs Market Volume (K Unit) Forecast, by Application 2019 & 2032
- Table 29: Italy Diabetes Care Drugs Market Revenue (Million) Forecast, by Application 2019 & 2032
- Table 30: Italy Diabetes Care Drugs Market Volume (K Unit) Forecast, by Application 2019 & 2032
- Table 31: Spain Diabetes Care Drugs Market Revenue (Million) Forecast, by Application 2019 & 2032
- Table 32: Spain Diabetes Care Drugs Market Volume (K Unit) Forecast, by Application 2019 & 2032
- Table 33: Belgium Diabetes Care Drugs Market Revenue (Million) Forecast, by Application 2019 & 2032
- Table 34: Belgium Diabetes Care Drugs Market Volume (K Unit) Forecast, by Application 2019 & 2032
- Table 35: Netherland Diabetes Care Drugs Market Revenue (Million) Forecast, by Application 2019 & 2032
- Table 36: Netherland Diabetes Care Drugs Market Volume (K Unit) Forecast, by Application 2019 & 2032
- Table 37: Nordics Diabetes Care Drugs Market Revenue (Million) Forecast, by Application 2019 & 2032
- Table 38: Nordics Diabetes Care Drugs Market Volume (K Unit) Forecast, by Application 2019 & 2032
- Table 39: Rest of Europe Diabetes Care Drugs Market Revenue (Million) Forecast, by Application 2019 & 2032
- Table 40: Rest of Europe Diabetes Care Drugs Market Volume (K Unit) Forecast, by Application 2019 & 2032
- Table 41: Global Diabetes Care Drugs Market Revenue Million Forecast, by Country 2019 & 2032
- Table 42: Global Diabetes Care Drugs Market Volume K Unit Forecast, by Country 2019 & 2032
- Table 43: China Diabetes Care Drugs Market Revenue (Million) Forecast, by Application 2019 & 2032
- Table 44: China Diabetes Care Drugs Market Volume (K Unit) Forecast, by Application 2019 & 2032
- Table 45: Japan Diabetes Care Drugs Market Revenue (Million) Forecast, by Application 2019 & 2032
- Table 46: Japan Diabetes Care Drugs Market Volume (K Unit) Forecast, by Application 2019 & 2032
- Table 47: India Diabetes Care Drugs Market Revenue (Million) Forecast, by Application 2019 & 2032
- Table 48: India Diabetes Care Drugs Market Volume (K Unit) Forecast, by Application 2019 & 2032
- Table 49: South Korea Diabetes Care Drugs Market Revenue (Million) Forecast, by Application 2019 & 2032
- Table 50: South Korea Diabetes Care Drugs Market Volume (K Unit) Forecast, by Application 2019 & 2032
- Table 51: Southeast Asia Diabetes Care Drugs Market Revenue (Million) Forecast, by Application 2019 & 2032
- Table 52: Southeast Asia Diabetes Care Drugs Market Volume (K Unit) Forecast, by Application 2019 & 2032
- Table 53: Australia Diabetes Care Drugs Market Revenue (Million) Forecast, by Application 2019 & 2032
- Table 54: Australia Diabetes Care Drugs Market Volume (K Unit) Forecast, by Application 2019 & 2032
- Table 55: Indonesia Diabetes Care Drugs Market Revenue (Million) Forecast, by Application 2019 & 2032
- Table 56: Indonesia Diabetes Care Drugs Market Volume (K Unit) Forecast, by Application 2019 & 2032
- Table 57: Phillipes Diabetes Care Drugs Market Revenue (Million) Forecast, by Application 2019 & 2032
- Table 58: Phillipes Diabetes Care Drugs Market Volume (K Unit) Forecast, by Application 2019 & 2032
- Table 59: Singapore Diabetes Care Drugs Market Revenue (Million) Forecast, by Application 2019 & 2032
- Table 60: Singapore Diabetes Care Drugs Market Volume (K Unit) Forecast, by Application 2019 & 2032
- Table 61: Thailandc Diabetes Care Drugs Market Revenue (Million) Forecast, by Application 2019 & 2032
- Table 62: Thailandc Diabetes Care Drugs Market Volume (K Unit) Forecast, by Application 2019 & 2032
- Table 63: Rest of Asia Pacific Diabetes Care Drugs Market Revenue (Million) Forecast, by Application 2019 & 2032
- Table 64: Rest of Asia Pacific Diabetes Care Drugs Market Volume (K Unit) Forecast, by Application 2019 & 2032
- Table 65: Global Diabetes Care Drugs Market Revenue Million Forecast, by Country 2019 & 2032
- Table 66: Global Diabetes Care Drugs Market Volume K Unit Forecast, by Country 2019 & 2032
- Table 67: Brazil Diabetes Care Drugs Market Revenue (Million) Forecast, by Application 2019 & 2032
- Table 68: Brazil Diabetes Care Drugs Market Volume (K Unit) Forecast, by Application 2019 & 2032
- Table 69: Argentina Diabetes Care Drugs Market Revenue (Million) Forecast, by Application 2019 & 2032
- Table 70: Argentina Diabetes Care Drugs Market Volume (K Unit) Forecast, by Application 2019 & 2032
- Table 71: Peru Diabetes Care Drugs Market Revenue (Million) Forecast, by Application 2019 & 2032
- Table 72: Peru Diabetes Care Drugs Market Volume (K Unit) Forecast, by Application 2019 & 2032
- Table 73: Chile Diabetes Care Drugs Market Revenue (Million) Forecast, by Application 2019 & 2032
- Table 74: Chile Diabetes Care Drugs Market Volume (K Unit) Forecast, by Application 2019 & 2032
- Table 75: Colombia Diabetes Care Drugs Market Revenue (Million) Forecast, by Application 2019 & 2032
- Table 76: Colombia Diabetes Care Drugs Market Volume (K Unit) Forecast, by Application 2019 & 2032
- Table 77: Ecuador Diabetes Care Drugs Market Revenue (Million) Forecast, by Application 2019 & 2032
- Table 78: Ecuador Diabetes Care Drugs Market Volume (K Unit) Forecast, by Application 2019 & 2032
- Table 79: Venezuela Diabetes Care Drugs Market Revenue (Million) Forecast, by Application 2019 & 2032
- Table 80: Venezuela Diabetes Care Drugs Market Volume (K Unit) Forecast, by Application 2019 & 2032
- Table 81: Rest of South America Diabetes Care Drugs Market Revenue (Million) Forecast, by Application 2019 & 2032
- Table 82: Rest of South America Diabetes Care Drugs Market Volume (K Unit) Forecast, by Application 2019 & 2032
- Table 83: Global Diabetes Care Drugs Market Revenue Million Forecast, by Country 2019 & 2032
- Table 84: Global Diabetes Care Drugs Market Volume K Unit Forecast, by Country 2019 & 2032
- Table 85: United States Diabetes Care Drugs Market Revenue (Million) Forecast, by Application 2019 & 2032
- Table 86: United States Diabetes Care Drugs Market Volume (K Unit) Forecast, by Application 2019 & 2032
- Table 87: Canada Diabetes Care Drugs Market Revenue (Million) Forecast, by Application 2019 & 2032
- Table 88: Canada Diabetes Care Drugs Market Volume (K Unit) Forecast, by Application 2019 & 2032
- Table 89: Mexico Diabetes Care Drugs Market Revenue (Million) Forecast, by Application 2019 & 2032
- Table 90: Mexico Diabetes Care Drugs Market Volume (K Unit) Forecast, by Application 2019 & 2032
- Table 91: Global Diabetes Care Drugs Market Revenue Million Forecast, by Country 2019 & 2032
- Table 92: Global Diabetes Care Drugs Market Volume K Unit Forecast, by Country 2019 & 2032
- Table 93: United Arab Emirates Diabetes Care Drugs Market Revenue (Million) Forecast, by Application 2019 & 2032
- Table 94: United Arab Emirates Diabetes Care Drugs Market Volume (K Unit) Forecast, by Application 2019 & 2032
- Table 95: Saudi Arabia Diabetes Care Drugs Market Revenue (Million) Forecast, by Application 2019 & 2032
- Table 96: Saudi Arabia Diabetes Care Drugs Market Volume (K Unit) Forecast, by Application 2019 & 2032
- Table 97: South Africa Diabetes Care Drugs Market Revenue (Million) Forecast, by Application 2019 & 2032
- Table 98: South Africa Diabetes Care Drugs Market Volume (K Unit) Forecast, by Application 2019 & 2032
- Table 99: Rest of Middle East and Africa Diabetes Care Drugs Market Revenue (Million) Forecast, by Application 2019 & 2032
- Table 100: Rest of Middle East and Africa Diabetes Care Drugs Market Volume (K Unit) Forecast, by Application 2019 & 2032
- Table 101: Global Diabetes Care Drugs Market Revenue Million Forecast, by Drugs 2019 & 2032
- Table 102: Global Diabetes Care Drugs Market Volume K Unit Forecast, by Drugs 2019 & 2032
- Table 103: Global Diabetes Care Drugs Market Revenue Million Forecast, by Route of Administration 2019 & 2032
- Table 104: Global Diabetes Care Drugs Market Volume K Unit Forecast, by Route of Administration 2019 & 2032
- Table 105: Global Diabetes Care Drugs Market Revenue Million Forecast, by Distribution Channel 2019 & 2032
- Table 106: Global Diabetes Care Drugs Market Volume K Unit Forecast, by Distribution Channel 2019 & 2032
- Table 107: Global Diabetes Care Drugs Market Revenue Million Forecast, by Country 2019 & 2032
- Table 108: Global Diabetes Care Drugs Market Volume K Unit Forecast, by Country 2019 & 2032
- Table 109: United States Diabetes Care Drugs Market Revenue (Million) Forecast, by Application 2019 & 2032
- Table 110: United States Diabetes Care Drugs Market Volume (K Unit) Forecast, by Application 2019 & 2032
- Table 111: Canada Diabetes Care Drugs Market Revenue (Million) Forecast, by Application 2019 & 2032
- Table 112: Canada Diabetes Care Drugs Market Volume (K Unit) Forecast, by Application 2019 & 2032
- Table 113: Rest of North America Diabetes Care Drugs Market Revenue (Million) Forecast, by Application 2019 & 2032
- Table 114: Rest of North America Diabetes Care Drugs Market Volume (K Unit) Forecast, by Application 2019 & 2032
- Table 115: Global Diabetes Care Drugs Market Revenue Million Forecast, by Drugs 2019 & 2032
- Table 116: Global Diabetes Care Drugs Market Volume K Unit Forecast, by Drugs 2019 & 2032
- Table 117: Global Diabetes Care Drugs Market Revenue Million Forecast, by Route of Administration 2019 & 2032
- Table 118: Global Diabetes Care Drugs Market Volume K Unit Forecast, by Route of Administration 2019 & 2032
- Table 119: Global Diabetes Care Drugs Market Revenue Million Forecast, by Distribution Channel 2019 & 2032
- Table 120: Global Diabetes Care Drugs Market Volume K Unit Forecast, by Distribution Channel 2019 & 2032
- Table 121: Global Diabetes Care Drugs Market Revenue Million Forecast, by Country 2019 & 2032
- Table 122: Global Diabetes Care Drugs Market Volume K Unit Forecast, by Country 2019 & 2032
- Table 123: France Diabetes Care Drugs Market Revenue (Million) Forecast, by Application 2019 & 2032
- Table 124: France Diabetes Care Drugs Market Volume (K Unit) Forecast, by Application 2019 & 2032
- Table 125: Germany Diabetes Care Drugs Market Revenue (Million) Forecast, by Application 2019 & 2032
- Table 126: Germany Diabetes Care Drugs Market Volume (K Unit) Forecast, by Application 2019 & 2032
- Table 127: Italy Diabetes Care Drugs Market Revenue (Million) Forecast, by Application 2019 & 2032
- Table 128: Italy Diabetes Care Drugs Market Volume (K Unit) Forecast, by Application 2019 & 2032
- Table 129: Spain Diabetes Care Drugs Market Revenue (Million) Forecast, by Application 2019 & 2032
- Table 130: Spain Diabetes Care Drugs Market Volume (K Unit) Forecast, by Application 2019 & 2032
- Table 131: United Kingdom Diabetes Care Drugs Market Revenue (Million) Forecast, by Application 2019 & 2032
- Table 132: United Kingdom Diabetes Care Drugs Market Volume (K Unit) Forecast, by Application 2019 & 2032
- Table 133: Russia Diabetes Care Drugs Market Revenue (Million) Forecast, by Application 2019 & 2032
- Table 134: Russia Diabetes Care Drugs Market Volume (K Unit) Forecast, by Application 2019 & 2032
- Table 135: Rest of Europe Diabetes Care Drugs Market Revenue (Million) Forecast, by Application 2019 & 2032
- Table 136: Rest of Europe Diabetes Care Drugs Market Volume (K Unit) Forecast, by Application 2019 & 2032
- Table 137: Global Diabetes Care Drugs Market Revenue Million Forecast, by Drugs 2019 & 2032
- Table 138: Global Diabetes Care Drugs Market Volume K Unit Forecast, by Drugs 2019 & 2032
- Table 139: Global Diabetes Care Drugs Market Revenue Million Forecast, by Route of Administration 2019 & 2032
- Table 140: Global Diabetes Care Drugs Market Volume K Unit Forecast, by Route of Administration 2019 & 2032
- Table 141: Global Diabetes Care Drugs Market Revenue Million Forecast, by Distribution Channel 2019 & 2032
- Table 142: Global Diabetes Care Drugs Market Volume K Unit Forecast, by Distribution Channel 2019 & 2032
- Table 143: Global Diabetes Care Drugs Market Revenue Million Forecast, by Country 2019 & 2032
- Table 144: Global Diabetes Care Drugs Market Volume K Unit Forecast, by Country 2019 & 2032
- Table 145: Mexico Diabetes Care Drugs Market Revenue (Million) Forecast, by Application 2019 & 2032
- Table 146: Mexico Diabetes Care Drugs Market Volume (K Unit) Forecast, by Application 2019 & 2032
- Table 147: Brazil Diabetes Care Drugs Market Revenue (Million) Forecast, by Application 2019 & 2032
- Table 148: Brazil Diabetes Care Drugs Market Volume (K Unit) Forecast, by Application 2019 & 2032
- Table 149: Rest of Latin America Diabetes Care Drugs Market Revenue (Million) Forecast, by Application 2019 & 2032
- Table 150: Rest of Latin America Diabetes Care Drugs Market Volume (K Unit) Forecast, by Application 2019 & 2032
- Table 151: Global Diabetes Care Drugs Market Revenue Million Forecast, by Drugs 2019 & 2032
- Table 152: Global Diabetes Care Drugs Market Volume K Unit Forecast, by Drugs 2019 & 2032
- Table 153: Global Diabetes Care Drugs Market Revenue Million Forecast, by Route of Administration 2019 & 2032
- Table 154: Global Diabetes Care Drugs Market Volume K Unit Forecast, by Route of Administration 2019 & 2032
- Table 155: Global Diabetes Care Drugs Market Revenue Million Forecast, by Distribution Channel 2019 & 2032
- Table 156: Global Diabetes Care Drugs Market Volume K Unit Forecast, by Distribution Channel 2019 & 2032
- Table 157: Global Diabetes Care Drugs Market Revenue Million Forecast, by Country 2019 & 2032
- Table 158: Global Diabetes Care Drugs Market Volume K Unit Forecast, by Country 2019 & 2032
- Table 159: Japan Diabetes Care Drugs Market Revenue (Million) Forecast, by Application 2019 & 2032
- Table 160: Japan Diabetes Care Drugs Market Volume (K Unit) Forecast, by Application 2019 & 2032
- Table 161: South Korea Diabetes Care Drugs Market Revenue (Million) Forecast, by Application 2019 & 2032
- Table 162: South Korea Diabetes Care Drugs Market Volume (K Unit) Forecast, by Application 2019 & 2032
- Table 163: China Diabetes Care Drugs Market Revenue (Million) Forecast, by Application 2019 & 2032
- Table 164: China Diabetes Care Drugs Market Volume (K Unit) Forecast, by Application 2019 & 2032
- Table 165: India Diabetes Care Drugs Market Revenue (Million) Forecast, by Application 2019 & 2032
- Table 166: India Diabetes Care Drugs Market Volume (K Unit) Forecast, by Application 2019 & 2032
- Table 167: Australia Diabetes Care Drugs Market Revenue (Million) Forecast, by Application 2019 & 2032
- Table 168: Australia Diabetes Care Drugs Market Volume (K Unit) Forecast, by Application 2019 & 2032
- Table 169: Vietnam Diabetes Care Drugs Market Revenue (Million) Forecast, by Application 2019 & 2032
- Table 170: Vietnam Diabetes Care Drugs Market Volume (K Unit) Forecast, by Application 2019 & 2032
- Table 171: Malaysia Diabetes Care Drugs Market Revenue (Million) Forecast, by Application 2019 & 2032
- Table 172: Malaysia Diabetes Care Drugs Market Volume (K Unit) Forecast, by Application 2019 & 2032
- Table 173: Indonesia Diabetes Care Drugs Market Revenue (Million) Forecast, by Application 2019 & 2032
- Table 174: Indonesia Diabetes Care Drugs Market Volume (K Unit) Forecast, by Application 2019 & 2032
- Table 175: Philippines Diabetes Care Drugs Market Revenue (Million) Forecast, by Application 2019 & 2032
- Table 176: Philippines Diabetes Care Drugs Market Volume (K Unit) Forecast, by Application 2019 & 2032
- Table 177: Thailand Diabetes Care Drugs Market Revenue (Million) Forecast, by Application 2019 & 2032
- Table 178: Thailand Diabetes Care Drugs Market Volume (K Unit) Forecast, by Application 2019 & 2032
- Table 179: Rest of Asia Pacific Diabetes Care Drugs Market Revenue (Million) Forecast, by Application 2019 & 2032
- Table 180: Rest of Asia Pacific Diabetes Care Drugs Market Volume (K Unit) Forecast, by Application 2019 & 2032
- Table 181: Global Diabetes Care Drugs Market Revenue Million Forecast, by Drugs 2019 & 2032
- Table 182: Global Diabetes Care Drugs Market Volume K Unit Forecast, by Drugs 2019 & 2032
- Table 183: Global Diabetes Care Drugs Market Revenue Million Forecast, by Route of Administration 2019 & 2032
- Table 184: Global Diabetes Care Drugs Market Volume K Unit Forecast, by Route of Administration 2019 & 2032
- Table 185: Global Diabetes Care Drugs Market Revenue Million Forecast, by Distribution Channel 2019 & 2032
- Table 186: Global Diabetes Care Drugs Market Volume K Unit Forecast, by Distribution Channel 2019 & 2032
- Table 187: Global Diabetes Care Drugs Market Revenue Million Forecast, by Country 2019 & 2032
- Table 188: Global Diabetes Care Drugs Market Volume K Unit Forecast, by Country 2019 & 2032
- Table 189: Saudi Arabia Diabetes Care Drugs Market Revenue (Million) Forecast, by Application 2019 & 2032
- Table 190: Saudi Arabia Diabetes Care Drugs Market Volume (K Unit) Forecast, by Application 2019 & 2032
- Table 191: Iran Diabetes Care Drugs Market Revenue (Million) Forecast, by Application 2019 & 2032
- Table 192: Iran Diabetes Care Drugs Market Volume (K Unit) Forecast, by Application 2019 & 2032
- Table 193: Egypt Diabetes Care Drugs Market Revenue (Million) Forecast, by Application 2019 & 2032
- Table 194: Egypt Diabetes Care Drugs Market Volume (K Unit) Forecast, by Application 2019 & 2032
- Table 195: Oman Diabetes Care Drugs Market Revenue (Million) Forecast, by Application 2019 & 2032
- Table 196: Oman Diabetes Care Drugs Market Volume (K Unit) Forecast, by Application 2019 & 2032
- Table 197: South Africa Diabetes Care Drugs Market Revenue (Million) Forecast, by Application 2019 & 2032
- Table 198: South Africa Diabetes Care Drugs Market Volume (K Unit) Forecast, by Application 2019 & 2032
- Table 199: Rest of Middle East and Africa Diabetes Care Drugs Market Revenue (Million) Forecast, by Application 2019 & 2032
- Table 200: Rest of Middle East and Africa Diabetes Care Drugs Market Volume (K Unit) Forecast, by Application 2019 & 2032
Frequently Asked Questions
1. What is the projected Compound Annual Growth Rate (CAGR) of the Diabetes Care Drugs Market?
The projected CAGR is approximately 3.51%.
2. Which companies are prominent players in the Diabetes Care Drugs Market?
Key companies in the market include Pfizer, Astellas Pharma, 1 Novo Nordisk, Sanofi, Novartis, 2 Sanofi, 3 Eli Lilly and Company, Teva Pharmaceuticals, Eli Lilly and Company, AstraZeneca, Biocon, Bristol Myers Squibb, Novo Nordisk, Mylan, Johnson & Johnson, Boehringer Ingelheim, Insulin Drugs, Merck & Co.
3. What are the main segments of the Diabetes Care Drugs Market?
The market segments include Drugs, Route of Administration, Distribution Channel.
4. Can you provide details about the market size?
The market size is estimated to be USD 87.53 Million as of 2022.
5. What are some drivers contributing to market growth?
; The Rise in Global Prevalence of Cases of Obesity due to Modern Sedentary Lifestyles; Rise in Awareness and Disposable Income in Developed Economies.
6. What are the notable trends driving market growth?
Insulin Drugs is Having the Highest Market Share in current year.
7. Are there any restraints impacting market growth?
; Highly Cost of Branded Products in Emerging Countries; Severe Adverse Associated with Medication Including Seizures. Suicidal Attempts and Even Death; Adoption of Traditional Yoga and Herbal Products.
8. Can you provide examples of recent developments in the market?
October 2023: Sanofi unveiled groundbreaking results from the TZIELD Phase 3 data presentation at ISPAD, showcasing promising potential in slowing the progression of Stage 3 type 1 diabetes among recently diagnosed children and adolescents. The comprehensive findings were simultaneously published in The New England Journal of Medicine.
9. What pricing options are available for accessing the report?
Pricing options include single-user, multi-user, and enterprise licenses priced at USD 4750, USD 5250, and USD 8750 respectively.
10. Is the market size provided in terms of value or volume?
The market size is provided in terms of value, measured in Million and volume, measured in K Unit.
11. Are there any specific market keywords associated with the report?
Yes, the market keyword associated with the report is "Diabetes Care Drugs Market," which aids in identifying and referencing the specific market segment covered.
12. How do I determine which pricing option suits my needs best?
The pricing options vary based on user requirements and access needs. Individual users may opt for single-user licenses, while businesses requiring broader access may choose multi-user or enterprise licenses for cost-effective access to the report.
13. Are there any additional resources or data provided in the Diabetes Care Drugs Market report?
While the report offers comprehensive insights, it's advisable to review the specific contents or supplementary materials provided to ascertain if additional resources or data are available.
14. How can I stay updated on further developments or reports in the Diabetes Care Drugs Market?
To stay informed about further developments, trends, and reports in the Diabetes Care Drugs Market, consider subscribing to industry newsletters, following relevant companies and organizations, or regularly checking reputable industry news sources and publications.
Methodology
Step 1 - Identification of Relevant Samples Size from Population Database


Step 2 - Approaches for Defining Global Market Size (Value, Volume* & Price*)

Note*: In applicable scenarios
Step 3 - Data Sources
Primary Research
- Web Analytics
- Survey Reports
- Research Institute
- Latest Research Reports
- Opinion Leaders
Secondary Research
- Annual Reports
- White Paper
- Latest Press Release
- Industry Association
- Paid Database
- Investor Presentations

Step 4 - Data Triangulation
Involves using different sources of information in order to increase the validity of a study
These sources are likely to be stakeholders in a program - participants, other researchers, program staff, other community members, and so on.
Then we put all data in single framework & apply various statistical tools to find out the dynamic on the market.
During the analysis stage, feedback from the stakeholder groups would be compared to determine areas of agreement as well as areas of divergence


